Your business relies on IT to deliver services to your customer. But what happens when there is a failure, can you afford downtime?
Whether or not you can afford it, you should ask yourself this question: how to manage network risk to maximise service availability?
In this blog post, we are going to identify some risks you may be facing today, so you can understand better how to tackle them.
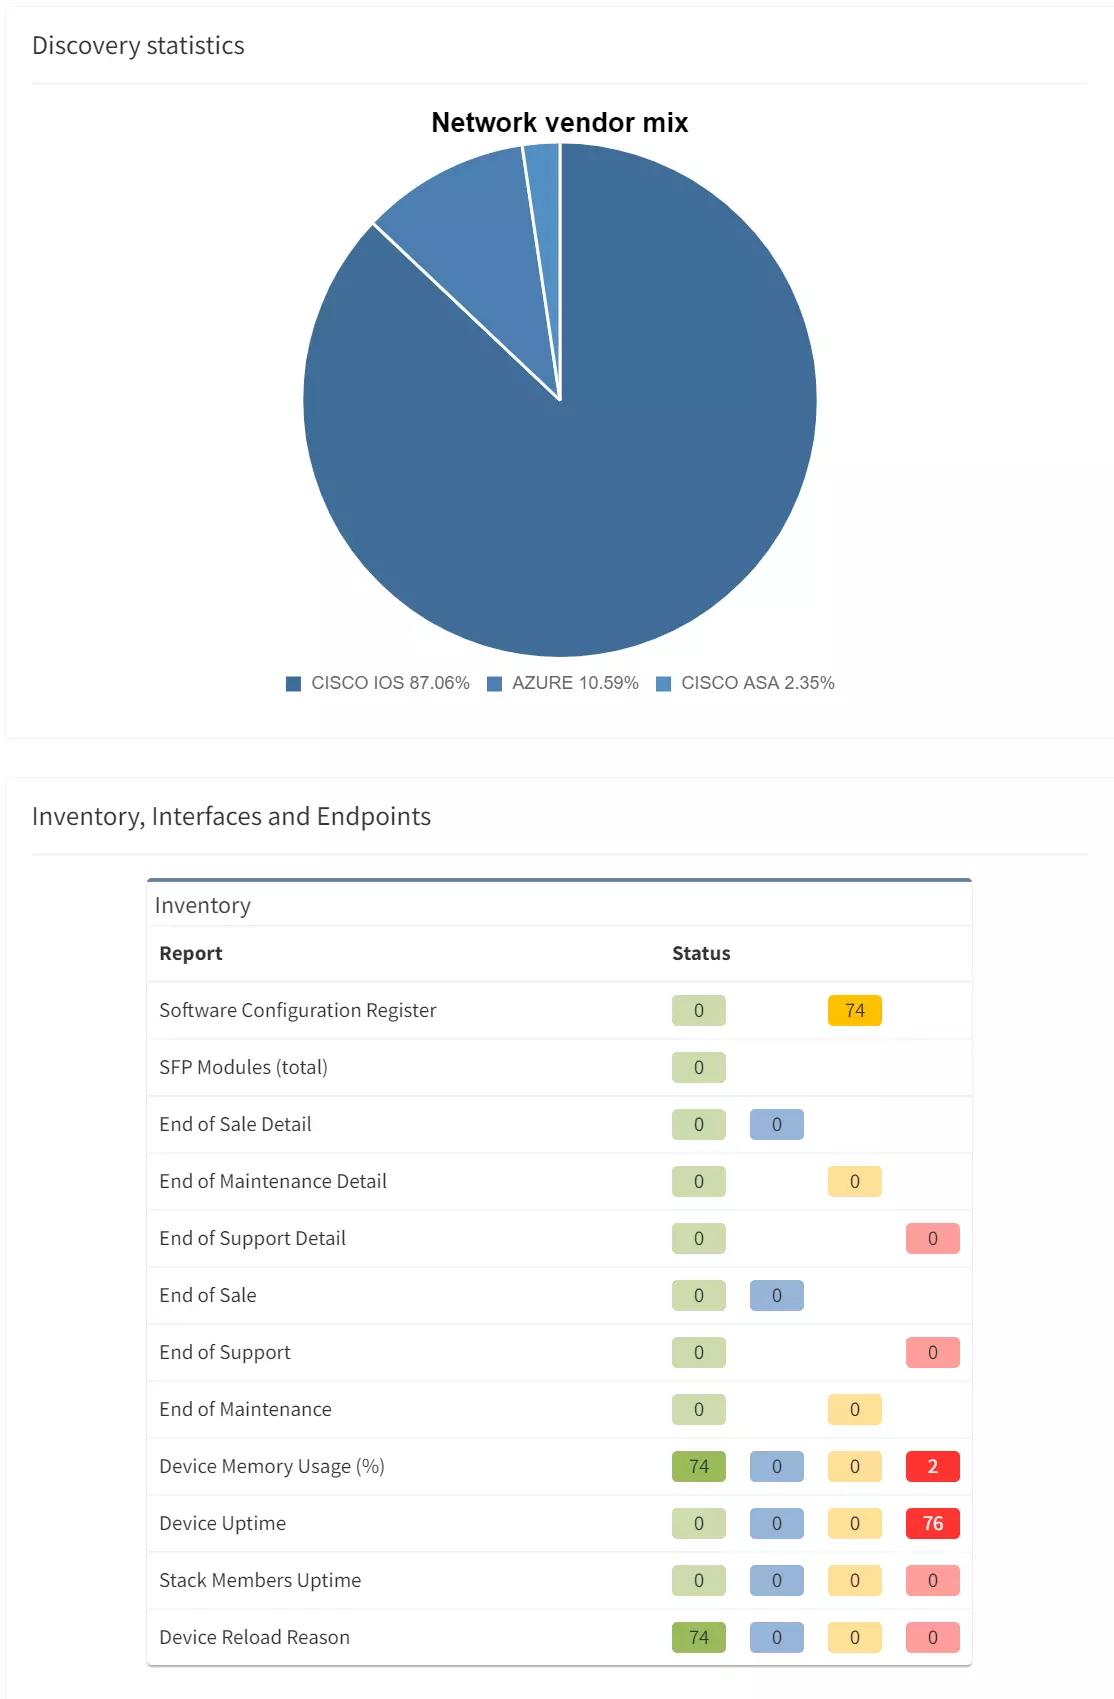
It is extremely important to have the full picture of your network. You cannot correctly manage devices or infrastructures you do not know about, or only have partial information.
The inventory is often used as the source to define the list of devices you will have under maintenance. What happens if a device fails and is not under maintenance?
You will need to order a replacement, which could take days, weeks, or more to arrive before you are able to restore the service. In the best-case scenario, the service is resilient, so only resiliency is affected, but while waiting for the replacement to arrive, you would be in a situation where you cannot afford for anything to fail.
In the worst-case scenario, if the service is not resilient, the service will be unavailable until the replacement of the faulty device.
So, we understand that maintaining an accurate inventory is crucial, but it can be very challenging:
We have a very similar problem with the documentation of the network and making sure it stays up to date. Otherwise, you are at risk of not being able to solve efficiently any issue arising on your network. A partially updated diagram could be very misleading for any change preparation or troubleshooting. This could cause unnecessary downtime which can be avoided.
Obviously, you may have processes in place to ensure diagrams and relevant documentation are accurate. But we all know that this is very time consuming, and let’s be honest, there are some more exciting projects you would rather be working on.
Monitoring tools are there to alert you of an issue, but what happens if there are some anomalies which are not considered as an issue, i.e., no SNMP traps are sent, nor syslog, and you have not experienced any symptoms because the problem is only on a backup link or device.
How do you detect these inaccuracies to fix them before they become service affecting?
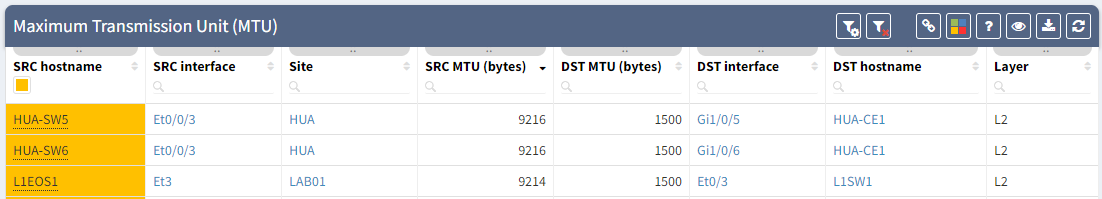
MTU can be the source of issues when the MTU is not configured consistently, for example, you have a primary path working as expected, but the backup is misconfigured. It means you will only notice the issue once the primary path fails.
It can be difficult to confirm MTU is correctly configured on all your devices: how long would it take you to collect the information for all the interfaces’ MTU, parse that data and analyze it so you know for each link how is the MTU configured on both end?
Having instant access to the links with inconsistent MTU, allows you to be proactive, so you can fix any links which could be causing issue on your network.
The second hidden issue I wanted to discuss here, has caused a major downtime in my previous experience: a BGP neighbor with no received-prefixes.
This is the situation we were in, two BGP neighbors to a service provider, but on the backup router, we were not receiving any prefixes. BGP session was still established, so no issue from our monitoring tools, everything “seemed fine”.
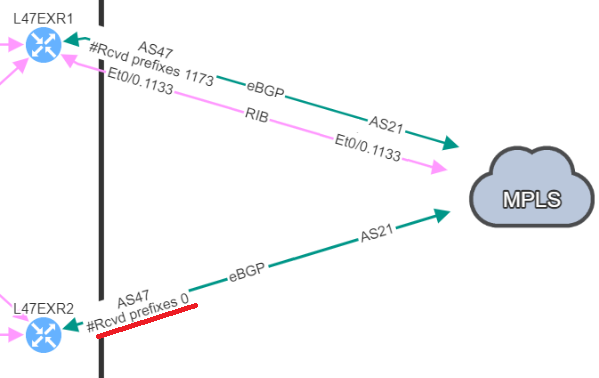
And one day, it happened: we lose our primary connection, and here starts our massive downtime. We no longer have access to this service.
We knew the resilient path had been working in the past, but what we didn’t know is that it wasn’t working anymore. How can we detect this so we can resolve similar issues before they cause downtime?
For further information on this point, you can check the following blog post: BGP resiliency and received prefixes | IP Fabric | Network Assurance
Those examples show how you could be facing an issue on your network and be totally unaware of the situation.
We want to be proactive as much as possible to avoid any downtime, but there are situations when issues happen. So, we need to be reactive and work efficiently in order to restore the service.
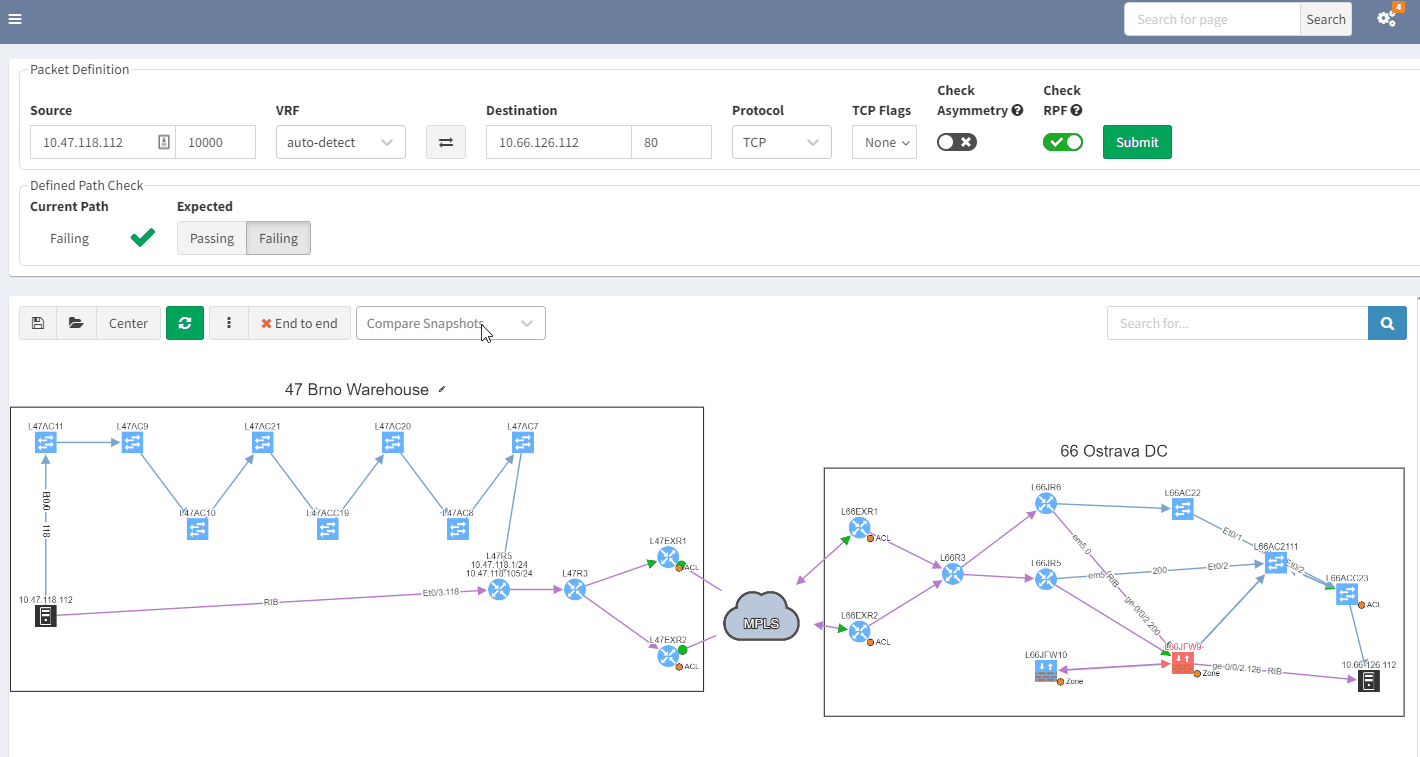
Using IP Fabric’s End-to-end path, will very quickly display all devices involved with passing traffic from a source to a destination. IP Fabric doesn’t just look at the network data, it includes firewalls in the path, so you can visualize any policies which may block the traffic.
With such a tool at disposition, it becomes easy to quickly pinpoint the source of the issue without having to connect to any devices, check the logs on different firewalls or spend time finding the latest diagram. Everything is available in one single and dynamic view:
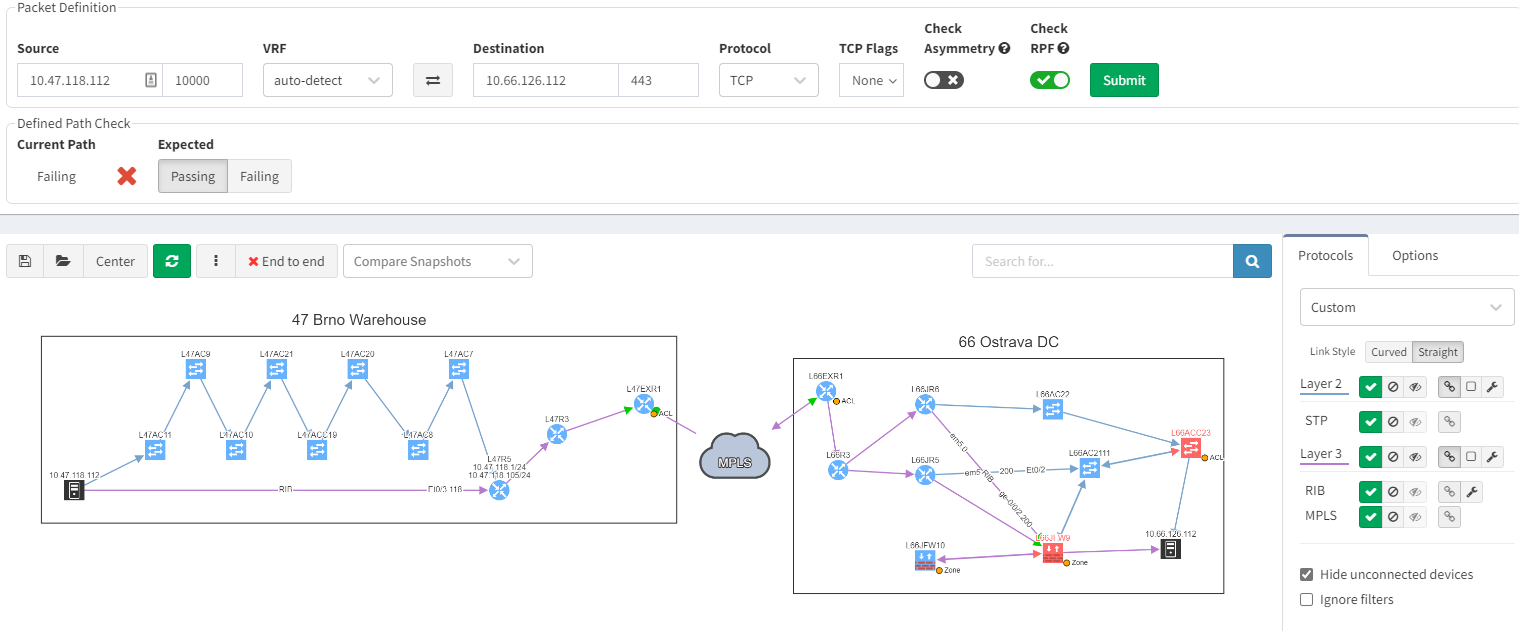
When you are troubleshooting, you often lack the understanding of how it was working before. It would be very useful to have a view of a previous topology, for example, from the day before. Then, by comparing both topologies, you can observe and quickly identify what has changed:
In the example above, you can see in the previous snapshot, there was only 1 link to the MPLS cloud, the 2nd one in red was not present, but is operational in the latest snapshot.
IP Fabric, as a network assurance platform, shines a torch on all those weaknesses and proactively inform you of potential issues existing in your network.
There is a lot more IP Fabric can help you with. To explore further, join our webinar on the 30th of June at 11am CEST: IP Fabric - FSI Webinar You can get in touch with us through www.ipfabric.io and follow our company’s LinkedIn or Blog, where more content will be emerging.
Your business relies on IT to deliver services to your customer. But what happens when there is a failure, can you afford downtime?
Whether or not you can afford it, you should ask yourself this question: how to manage network risk to maximise service availability?
In this blog post, we are going to identify some risks you may be facing today, so you can understand better how to tackle them.
It is extremely important to have the full picture of your network. You cannot correctly manage devices or infrastructures you do not know about, or only have partial information.
The inventory is often used as the source to define the list of devices you will have under maintenance. What happens if a device fails and is not under maintenance?
You will need to order a replacement, which could take days, weeks, or more to arrive before you are able to restore the service. In the best-case scenario, the service is resilient, so only resiliency is affected, but while waiting for the replacement to arrive, you would be in a situation where you cannot afford for anything to fail.
In the worst-case scenario, if the service is not resilient, the service will be unavailable until the replacement of the faulty device.
So, we understand that maintaining an accurate inventory is crucial, but it can be very challenging:
We have a very similar problem with the documentation of the network and making sure it stays up to date. Otherwise, you are at risk of not being able to solve efficiently any issue arising on your network. A partially updated diagram could be very misleading for any change preparation or troubleshooting. This could cause unnecessary downtime which can be avoided.
Obviously, you may have processes in place to ensure diagrams and relevant documentation are accurate. But we all know that this is very time consuming, and let’s be honest, there are some more exciting projects you would rather be working on.
Monitoring tools are there to alert you of an issue, but what happens if there are some anomalies which are not considered as an issue, i.e., no SNMP traps are sent, nor syslog, and you have not experienced any symptoms because the problem is only on a backup link or device.
How do you detect these inaccuracies to fix them before they become service affecting?
MTU can be the source of issues when the MTU is not configured consistently, for example, you have a primary path working as expected, but the backup is misconfigured. It means you will only notice the issue once the primary path fails.
It can be difficult to confirm MTU is correctly configured on all your devices: how long would it take you to collect the information for all the interfaces’ MTU, parse that data and analyze it so you know for each link how is the MTU configured on both end?
Having instant access to the links with inconsistent MTU, allows you to be proactive, so you can fix any links which could be causing issue on your network.
The second hidden issue I wanted to discuss here, has caused a major downtime in my previous experience: a BGP neighbor with no received-prefixes.
This is the situation we were in, two BGP neighbors to a service provider, but on the backup router, we were not receiving any prefixes. BGP session was still established, so no issue from our monitoring tools, everything “seemed fine”.
And one day, it happened: we lose our primary connection, and here starts our massive downtime. We no longer have access to this service.
We knew the resilient path had been working in the past, but what we didn’t know is that it wasn’t working anymore. How can we detect this so we can resolve similar issues before they cause downtime?
For further information on this point, you can check the following blog post: BGP resiliency and received prefixes | IP Fabric | Network Assurance
Those examples show how you could be facing an issue on your network and be totally unaware of the situation.
We want to be proactive as much as possible to avoid any downtime, but there are situations when issues happen. So, we need to be reactive and work efficiently in order to restore the service.
Using IP Fabric’s End-to-end path, will very quickly display all devices involved with passing traffic from a source to a destination. IP Fabric doesn’t just look at the network data, it includes firewalls in the path, so you can visualize any policies which may block the traffic.
With such a tool at disposition, it becomes easy to quickly pinpoint the source of the issue without having to connect to any devices, check the logs on different firewalls or spend time finding the latest diagram. Everything is available in one single and dynamic view:
When you are troubleshooting, you often lack the understanding of how it was working before. It would be very useful to have a view of a previous topology, for example, from the day before. Then, by comparing both topologies, you can observe and quickly identify what has changed:
In the example above, you can see in the previous snapshot, there was only 1 link to the MPLS cloud, the 2nd one in red was not present, but is operational in the latest snapshot.
IP Fabric, as a network assurance platform, shines a torch on all those weaknesses and proactively inform you of potential issues existing in your network.
There is a lot more IP Fabric can help you with. To explore further, join our webinar on the 30th of June at 11am CEST: IP Fabric - FSI Webinar You can get in touch with us through www.ipfabric.io and follow our company’s LinkedIn or Blog, where more content will be emerging.