For tech purchasing teams who are ready to embrace a robust network tooling ecosystem, ensuring you pick right - that is - get real value from your tools, and quickly - is step one. Whether it's driving innovation through network automation or actualizing a successful intent-based networking strategy, one thing is clear: the unique DNA of every network dictates a unique set of network tools, influenced by the company’s strategic objectives, operational constraints, and available resources.
That said, there are some core criteria you can use as a compass.
Many teams find themselves ensnared in common, yet avoidable pitfalls: sprawling toolsets that offer little return on investment, glaring functionality gaps, and restrictive vendor lock-in, or even process lock-in, where tools are dictating how you operate your network.
In this post, we’ll share four critical ways to evaluate network tools to steer clear of these traps. That's not to say every tool you need will be able to fulfill these criteria perfectly and you can't wait around for every platform or tool to be perfect; but when it comes to decision time, these criteria can help you keep the future front of mind.

Remember, a network that's secure, observable, and agile doesn't just happen. It's underpinned by strategy, enabled by a carefully selected ecosystem of tools ensuring that no functionality gap goes unfilled. Here's how to pick network tools that don't just promise, but deliver tangible value.
In IT networking, the integration of different tools can make or break the flow of operations. An open approach, where network vendors encourage and support integration and make the necessary data readily available, can inform your network operations strategy as it determines how effectively your team can share and act upon network data. When selecting tools, consider the spectrum of integration methods available.
Open and robust API programmability sits at the forefront of this spectrum, offering a future-proof solution that allows for dynamic responses to evolving network demands. An API-first tool can seamlessly share data across various platforms, enabling automation and fostering innovation within your network infrastructure.
Blog Post: IP Fabric API Programmability - Part 1 - The Basics
On the other hand, pre-built integrations can indicate a vendor's foresight and readiness to integrate with the broader ecosystem of tools you employ. These integrations can be a testament to the vendor's commitment to user-friendliness and their understanding of the network management landscape. They save time and resources, providing out-of-the-box connectivity that can accelerate deployment and facilitate immediate operational efficiency. Maybe the tooling vendor you're eyeing up doesn't have every pre-built solution today, but how do they talk about their plans for this - do they regularly collaborate with others in the space, and actively put forth impactful partnerships where they know customers will benefit?
However, there will be instances where neither API programmability nor pre-built solutions meet the unique needs of your network. This is where self-built, for-purpose integrations come into play. While they represent a tailored fit to your specific requirements, they also come with considerations of maintenance and long-term viability. It's crucial to weigh the benefits of custom-built integrations against the potential for creating future bottlenecks or legacy issues that could turn a creative solution into a hindrance.
The goal is always to enhance capabilities without compromising on adaptability and growth.
For a modern enterprise network, diversity is the norm, with a mix of vendors, domains, and technologies - all essential to meet comprehensive business needs. This complexity necessitates network tools capable of managing the entire network ecosystem, beyond the limitations of vendor-specific or domain-restricted solutions. Relying on tools confined to single vendors or network segments can fragment your network management visibility - and therefore, strategy.
To circumvent the pitfalls of vendor lock-in and ensure transparency across network domains, it's prudent to invest in tools that embrace a vendor-neutral stance and aim to support all network domains. Such tools offer the flexibility, completeness, and extensibility needed to truly future-proof your network, fostering an environment that's prepared for the technologies of tomorrow.
The aim is true end-to-end control of your network.
Related Blog Post: A Holistic Approach to Network Discovery
When selecting network management tools, it's crucial to opt for solutions that do what they promise without becoming a burden on resources. From deployment to ongoing maintenance, if your team is spending hours getting a platform to produce the results you need, and growing frustrated in the process, then the juice is not worth the squeeze.
That said, it's not only about the effort you have to put in today; what about future strategy? Will this tool support your processes should it pivot?
As demands on the network shift and grow, you’ll likely be using a combination of legacy processes and tools as well as adopting newer strategies, like NetDevOps and CI/CD pipeline-based approaches to network management.
Flexibility is key; as network demands evolve, tools should adapt, avoiding process lock-in. The goal is to choose tools that serve as a seamless extension of your data infrastructure, allowing your team to remain agile and effective, not tethered to restrictive tooling.
Of course, when you’re purchasing a tool, you want it to fulfill a particular function. Some tools are only ever going to be one thing, and that’s okay if you feel you’re getting the promised value. For other tools, however, a bit of creative foresight can reveal endless potential and become a really exciting prospect of value that compounds. These tools – if selected carefully – can become your heroes, your Swiss Army Knives of enterprise networking that are beloved by not just you, but throughout an organization.
Generally, there are tools that 1) Do not create more data silos but are built to democratize access to valuable data. 2) Encourage and assist with creative use of that network data.
Download: IP Fabric's Baseline - Operate - Innovate Framework
All to say, while all network tools should fix an immediate problem, the BEST tools also lay fertile groundwork for future innovation.
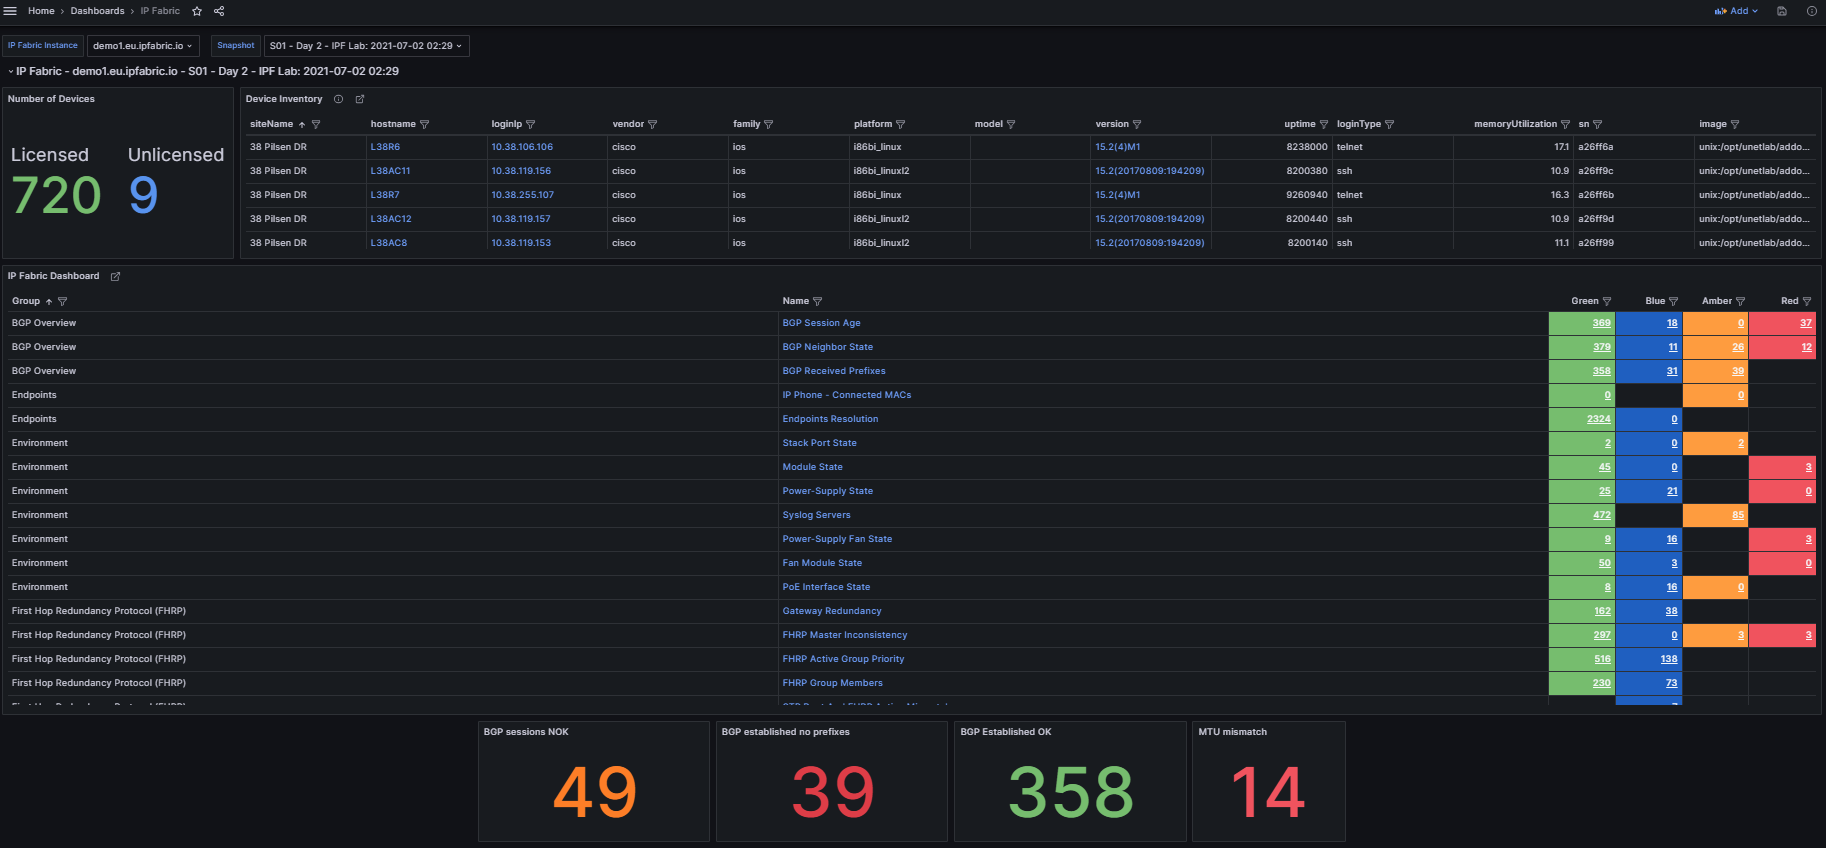
Let's demonstrate how to integrate IP Fabric directly with Grafana using an Infinity Datasource and creating a Dashboard to visualize the data. This is easily accomplished with the template file located on GitLab and provides your teams a single pane of glass to monitor your network without having to navigate to another website. Following these instructions or those located in the GitLab repo will have you up and running in approximately 5 minutes, so let's get started!


In the top left we see three variables that can be set to change the dashboard data:
IP Fabric Instance: Used for customers with two or more deployments (this can be disabled for customers with a single deployment which is documented below).Snapshot: Provides a way to switch between the loaded snapshots to update the dashboard's data.
The next section provides an overview of the number of licensed and unlicensed devices discovered in the snapshot and the Device Inventory table (limited to 5,000 devices).
hostname: Filtered hyperlink to the Inventory > Devices table.loginIp: Link to directly SSH to the device (see Telment/SSH URL Handler On MS Windows 7 And Later).version: Hyperlink to Inventory > OS Version Consistency filtered on the platform and version.
The IP Fabric Dashboard is a mirrored copy of what is seen in the GUI. This also contains links back to IP Fabric tables. Clicking the URL in the Name column will take you to the unfiltered table, however the links in the Green, Blue, Amber, and Red columns will filter that table based on the color you selected.
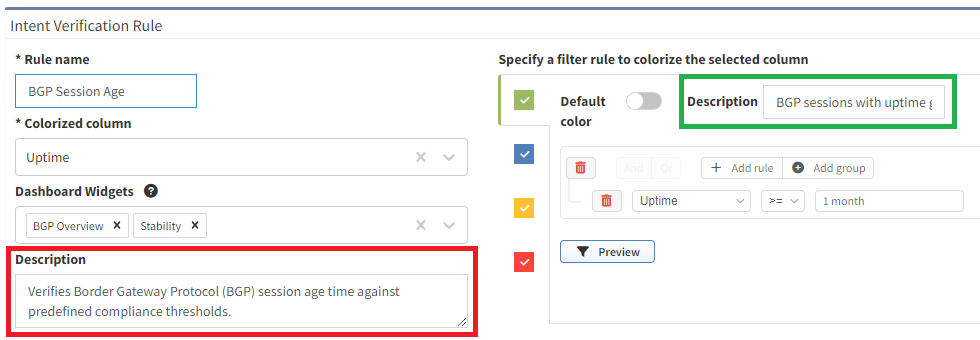
Also included are tooltips on all the hyperlinks with the description configured in IP Fabric.
Pro Tip: When creating new intent verification rules or editing the defaults, be sure to add or update the descriptions on each color to ensure your users understand what the rule is signifying. This is seen in the below picture where the highlighted green box has a descriptive message to convey the green color's purpose whereas the red box is used to describe the entire intent check.


Finally included in this template are some examples of creating custom visualizations for data your team may want to more closely monitor. These are created using table filters in the GUI and utilizing the API Description to copy those rules into Grafana. To speed up loading of the dashboard, the query is limited to return a single row of data and the value displayed is derived from the returning _meta.count field in the JSON response.
It is not recommended to display tables of data in Grafana due to the current paging limitation. Requesting large amounts of data from IP Fabric using the API without paging can degrade performance for all users.
In this section, we will set up the Infinity data source(s) for connection to the IP Fabric instance which the dashboard will use to pull the data.
In Grafana, navigate using the right hand menu to Connections > Add new connection, search for "Infinity", and select it to create the new connection.

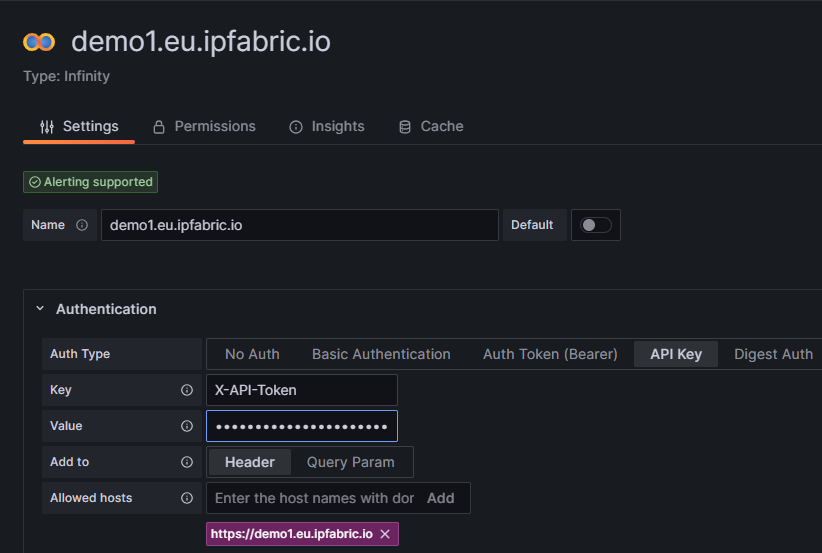
Authentication and select API Key.
Key is required to be set to X-API-Token.Value is the API token you created in the IP Fabric GUI.Allowed hosts with https:// prepending it and pressing Add (i.e. https://demo1.eu.ipfabric.io).Save & test button at the bottom of the page.Cache tab to speed up queries and Dashboard loading.TLS/SSL & Network Settings there is an option to skip TLS verification if your IP Fabric instance does not have a trusted certificate installed.This Dashboard template has been developed to support multiple IP Fabric instances and if this applies to your environment simply create a new data source following these instructions for each of your IP Fabric FQDN(s).
Now that the connection to IP Fabric has been established we can import the Dashboard. This is done by going to the Grafana Dashboards page selecting New and Import. You will need to access the grafana_model.json file from GitLab and either upload the file or copy/paste the contents in the Import via panel json.
After selecting the Load option you have the ability to change the default Dashboard Name from and the folder it will be located under prior to importing.
Once loaded it should take you to the new IP Fabric Dashboard however there is one configuration change to ensure that the dashboard selects the correct data source. Because this template was built to support multiple IP Fabric instances it is required to filter the list of Infinity data sources that are configured across the entire Grafana environment.
Dashboard settings.Variables menu select the instance variable to edit it.Show on dashboard value to Nothing which will disable the drop down to select different servers which is not needed.Instance name filter regex.
/^FQDN$/ (i.e. /^demo1.us.ipfabric.io$/)./^demo1....ipfabric.io$/ or /^demo1.us.ipfabric.io$|^demo1.eu.ipfabric.io$/).Apply.Save dashboard and Close at the top right of the page to return to the Dashboard to verify data is loaded.Also included is a query to fetch the IP Fabric apiVersion for use in all the queries the Dashboard may request. This should ensure stability after upgrading your deployment(s) to a newer version however it is always recommended to check the Release Notes for any breaking changes that may occur between versions.
A fix has been added to resolve an issue after upgrading to IP Fabric 6.3.x on August 10th, 2023. If you imported the Dashboard prior to the fix and have issues with hyperlinks after upgrading please follow the migration documentation on GitLab.
In summary using this IP Fabric Integration template can maximize your teams network monitoring visibility into your already preferred dashboard application Grafana. This template is meant to be a jumping point to provide examples of how to interact with IP Fabric using Grafana and can be further customized to your team's needs.
If you have any questions, ideas for new functionality, or need assistance with installation or configuration please reach out to your Solution Architect for assistance. I hope you found this an exciting new way to extend the capabilities of your IP Fabric deployment!
If this post has piqued your interest, and you'd like to see the integration in action, please check out #TechFabric 7 - Integrating IP Fabric with Grafana Webinar on LinkedIn!
Want to see IP Fabric in action for yourself? Try our free, self-guided demo here.
Prefer the personal touch? Reach out to us to schedule a free demo, zero obligations required!


