BGP is famously known for being the routing protocol of the internet, but not only. A lot of companies are using BGP in their internal network. One of the main reasons for that: it allows great control and flexibility with routing exchange.
As with any routing protocol and critical connectivity, we want to ensure we are resilient to failure and that the resiliency is operational. With BGP, to do so, we need to have a closer look at the received prefixes.
Let's take a classic example, where you would have two devices connected to an external party. This could be your ISP, MPLS provider…
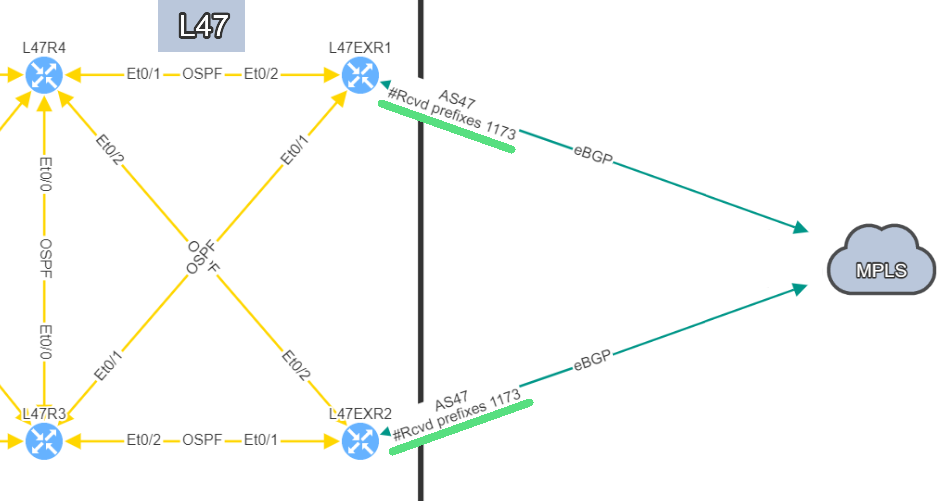
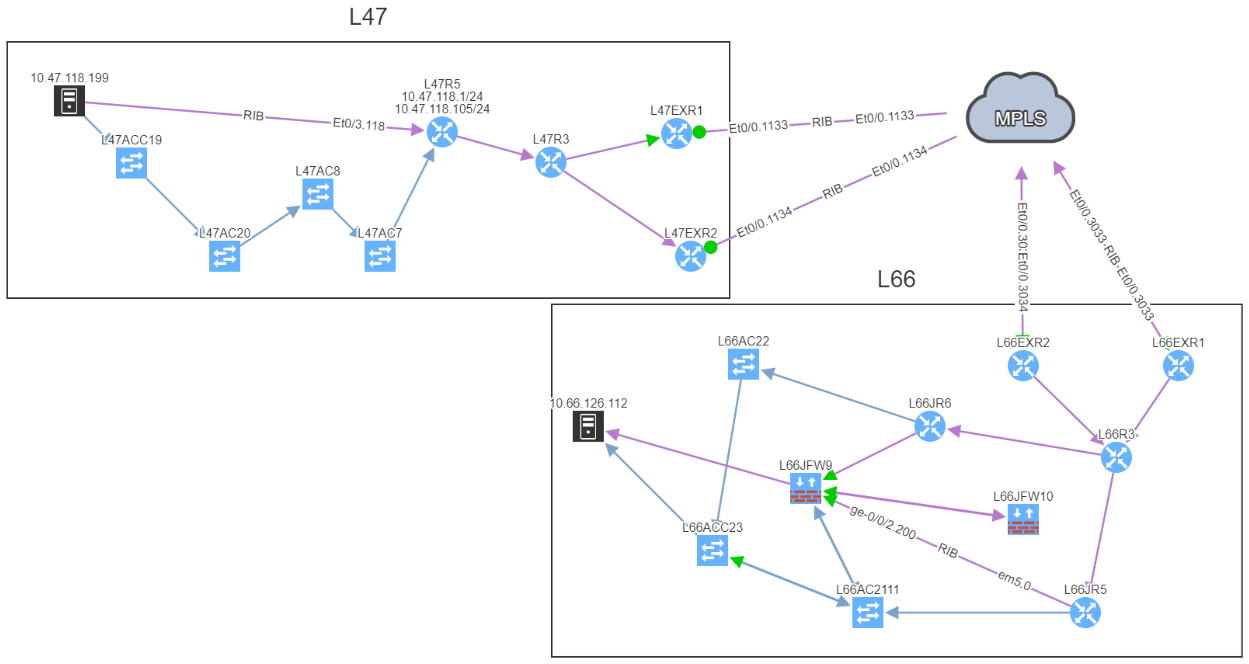
In this example, site L47, on the left, is connected to site L21 which is your MPLS cloud.
You have your two eBGP sessions established with the MPLS cloud, that's great! Now you want to ensure that you are resilient by checking the receive routes from the provider on both links. This is how you will be able to reach any of your sites connected to the MPLS cloud.
In this situation, if one link fails, you have full resiliency. You will not lose connectivity to your MPLS network and all the services hosted outside site L47.
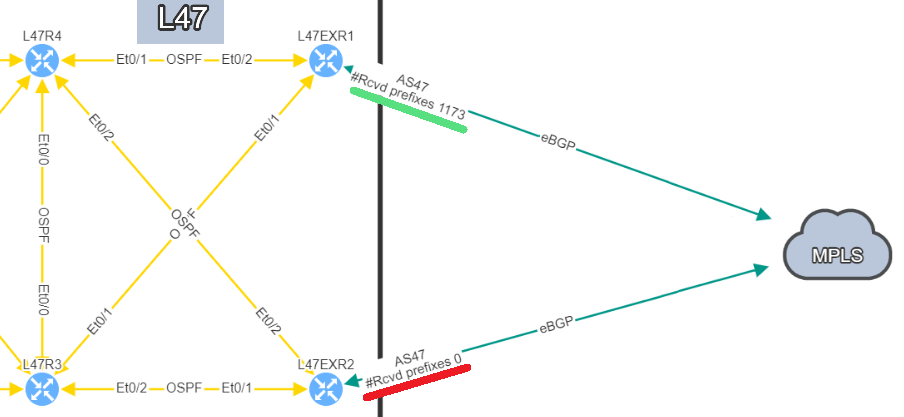
In this situation, if you lose L47EXR1 or the link between this router and site L21, your secondary link will not be able to forward any traffic. L47EXR2 is not receiving any routes.
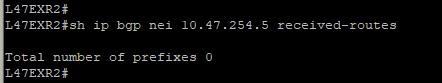
This is what you would see on your device:
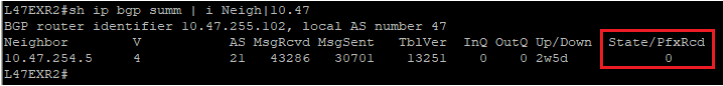
The fact that you can see State/PfxRcd showing "0" tells you the BGP session is established, otherwise, you would see the current state (Idle, Active...). Any other number would be good, unfortunately in this scenario, you are not receiving any route.
You are now in a situation where you do not have any resiliency, and your monitoring system is not alerting us on the issue.
That’s a very good question! In a situation like this one, the BGP session is not affected, which means there is no error generated by the router. The device will not send Syslog messages or SNMP traps to inform your monitoring system that you are not receiving any routes.
That's where IP Fabric can play a crucial role to identify the issue quickly before it causes any damages. There are several ways to see the problem:
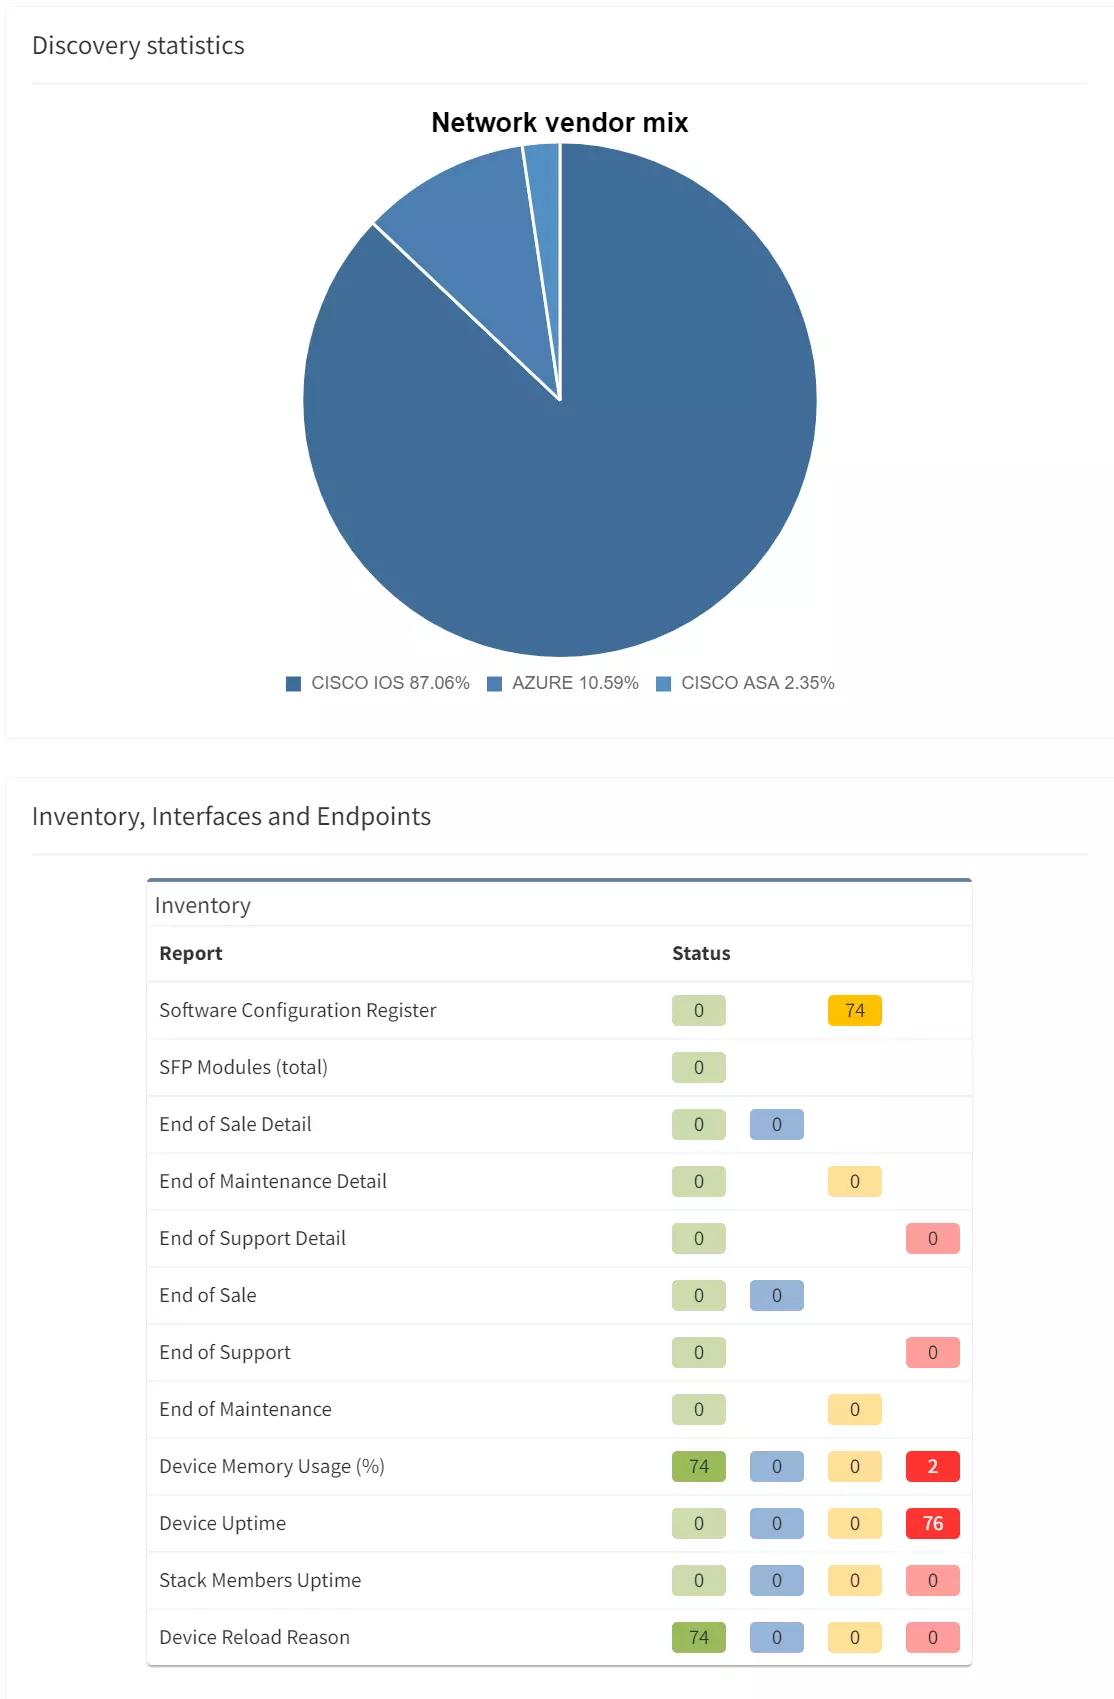
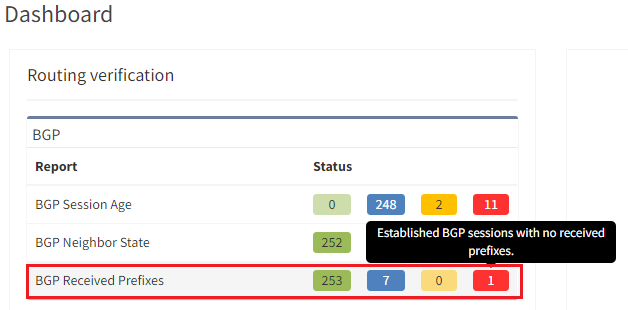
The IP Fabric dashboard provides an overview of the network analysis results, including issues and links to the detailed reports.
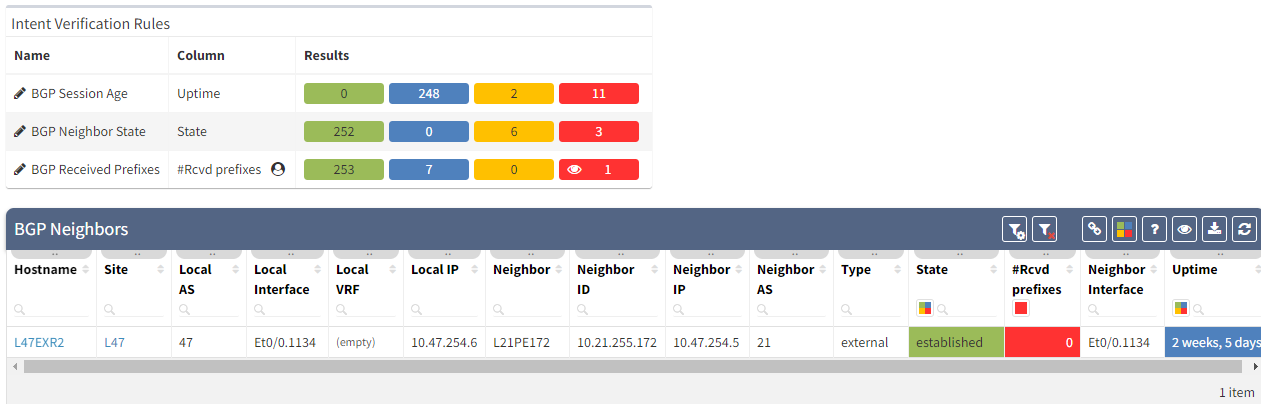
After seeing this table, you will want to check further details regarding the issue. Just click on the interesting number, and you will be redirected to the appropriate technology page and the intent verifications.
As we have seen at the beginning, you will be able to check directly on the diagram the number of received prefixes for a specific neighbor.
It's also possible to display on the diagram the verification information from all the supported technologies. In this example, we will add the BGP information on the diagram for site 47:
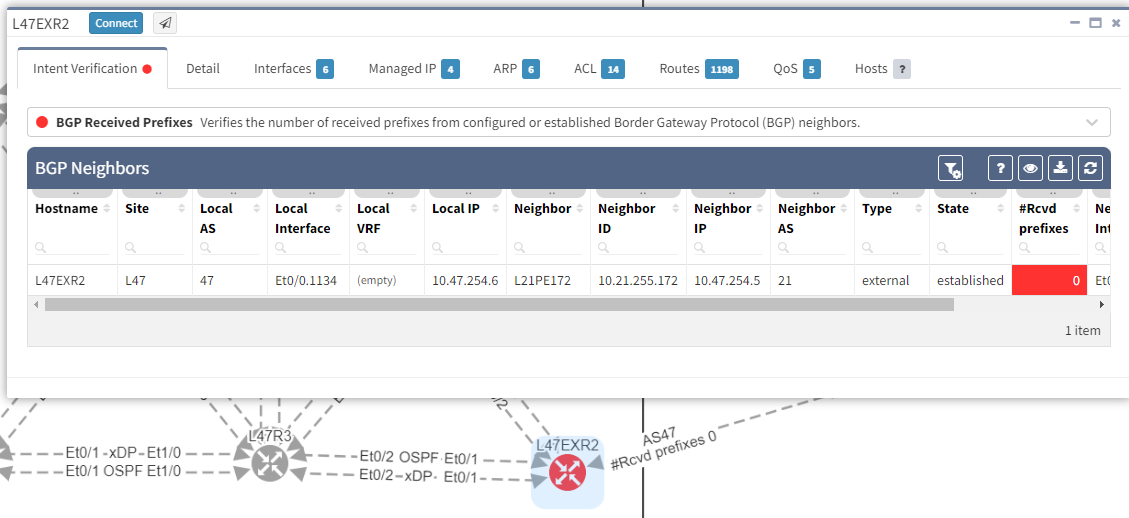
The moment we select the verification to add to the diagram, we can see L47EXR2 becomes red. If we click on the device, we will see the explanation on why it's showing red:
In addition, we can spot this issue by looking at the end-to-end path. Let's take an example where we are looking at the path from a source in site L47 to a destination in site L66, which is connected to the MPLS cloud.
In a normal situation, we would expect to see the traffic being able to use both links to reach the MPLS cloud:
If we now compare with the snapshot where we have the issue, we can clearly see that we have lost our resiliency:
You can't ensure BGP resiliency if you do not look at the received prefixes. The main issue with this situation is the fact that your monitoring system will not be able to inform you of the loss of received prefixes. The last thing you want is to face a massive outage because of one link failure and your secondary link was not operational.
I have been in that exact situation previously, and let's just say I did not enjoy writing the postmortem explaining why we did not know our redundant path wasn't working. It's not a situation you want to be in...
If you would like to find out more about IP Fabric and how it can help improve your existing infrastructure by detecting issues you are not aware of, please contact us through www.ipfabric.io! You can also follow our company’s LinkedIn or Blog, where more content will be emerging.
BGP is famously known for being the routing protocol of the internet, but not only. A lot of companies are using BGP in their internal network. One of the main reasons for that: it allows great control and flexibility with routing exchange.
As with any routing protocol and critical connectivity, we want to ensure we are resilient to failure and that the resiliency is operational. With BGP, to do so, we need to have a closer look at the received prefixes.
Let's take a classic example, where you would have two devices connected to an external party. This could be your ISP, MPLS provider…
In this example, site L47, on the left, is connected to site L21 which is your MPLS cloud.
You have your two eBGP sessions established with the MPLS cloud, that's great! Now you want to ensure that you are resilient by checking the receive routes from the provider on both links. This is how you will be able to reach any of your sites connected to the MPLS cloud.
In this situation, if one link fails, you have full resiliency. You will not lose connectivity to your MPLS network and all the services hosted outside site L47.
In this situation, if you lose L47EXR1 or the link between this router and site L21, your secondary link will not be able to forward any traffic. L47EXR2 is not receiving any routes.
This is what you would see on your device:
The fact that you can see State/PfxRcd showing "0" tells you the BGP session is established, otherwise, you would see the current state (Idle, Active...). Any other number would be good, unfortunately in this scenario, you are not receiving any route.
You are now in a situation where you do not have any resiliency, and your monitoring system is not alerting us on the issue.
That’s a very good question! In a situation like this one, the BGP session is not affected, which means there is no error generated by the router. The device will not send Syslog messages or SNMP traps to inform your monitoring system that you are not receiving any routes.
That's where IP Fabric can play a crucial role to identify the issue quickly before it causes any damages. There are several ways to see the problem:
The IP Fabric dashboard provides an overview of the network analysis results, including issues and links to the detailed reports.
After seeing this table, you will want to check further details regarding the issue. Just click on the interesting number, and you will be redirected to the appropriate technology page and the intent verifications.
As we have seen at the beginning, you will be able to check directly on the diagram the number of received prefixes for a specific neighbor.
It's also possible to display on the diagram the verification information from all the supported technologies. In this example, we will add the BGP information on the diagram for site 47:
The moment we select the verification to add to the diagram, we can see L47EXR2 becomes red. If we click on the device, we will see the explanation on why it's showing red:
In addition, we can spot this issue by looking at the end-to-end path. Let's take an example where we are looking at the path from a source in site L47 to a destination in site L66, which is connected to the MPLS cloud.
In a normal situation, we would expect to see the traffic being able to use both links to reach the MPLS cloud:
If we now compare with the snapshot where we have the issue, we can clearly see that we have lost our resiliency:
You can't ensure BGP resiliency if you do not look at the received prefixes. The main issue with this situation is the fact that your monitoring system will not be able to inform you of the loss of received prefixes. The last thing you want is to face a massive outage because of one link failure and your secondary link was not operational.
I have been in that exact situation previously, and let's just say I did not enjoy writing the postmortem explaining why we did not know our redundant path wasn't working. It's not a situation you want to be in...
If you would like to find out more about IP Fabric and how it can help improve your existing infrastructure by detecting issues you are not aware of, please contact us through www.ipfabric.io! You can also follow our company’s LinkedIn or Blog, where more content will be emerging.