Unlock the power of automated network analysis with the IP Fabric Data Report. This tool leverages IP Fabric's API to create detailed, customizable PDF reports that provide invaluable insights into your network's health and performance. Discover how this Python script can revolutionize your approach to network data comparison.
In the fast-paced world of network management, the ability to quickly and accurately assess the health of your network is paramount. One of the most effective ways to achieve this is through automated reporting. Automated reports, such as those generated by the IP Fabric Data Report Generator, help teams address frequent requirements for network data comparison between two different snapshots, such as:
By automating the process, teams can save valuable time and resources that would otherwise be spent manually collecting and analyzing data. This increases efficiency and reduces the risk of human error, ensuring that the data you base your decisions on is accurate and reliable.
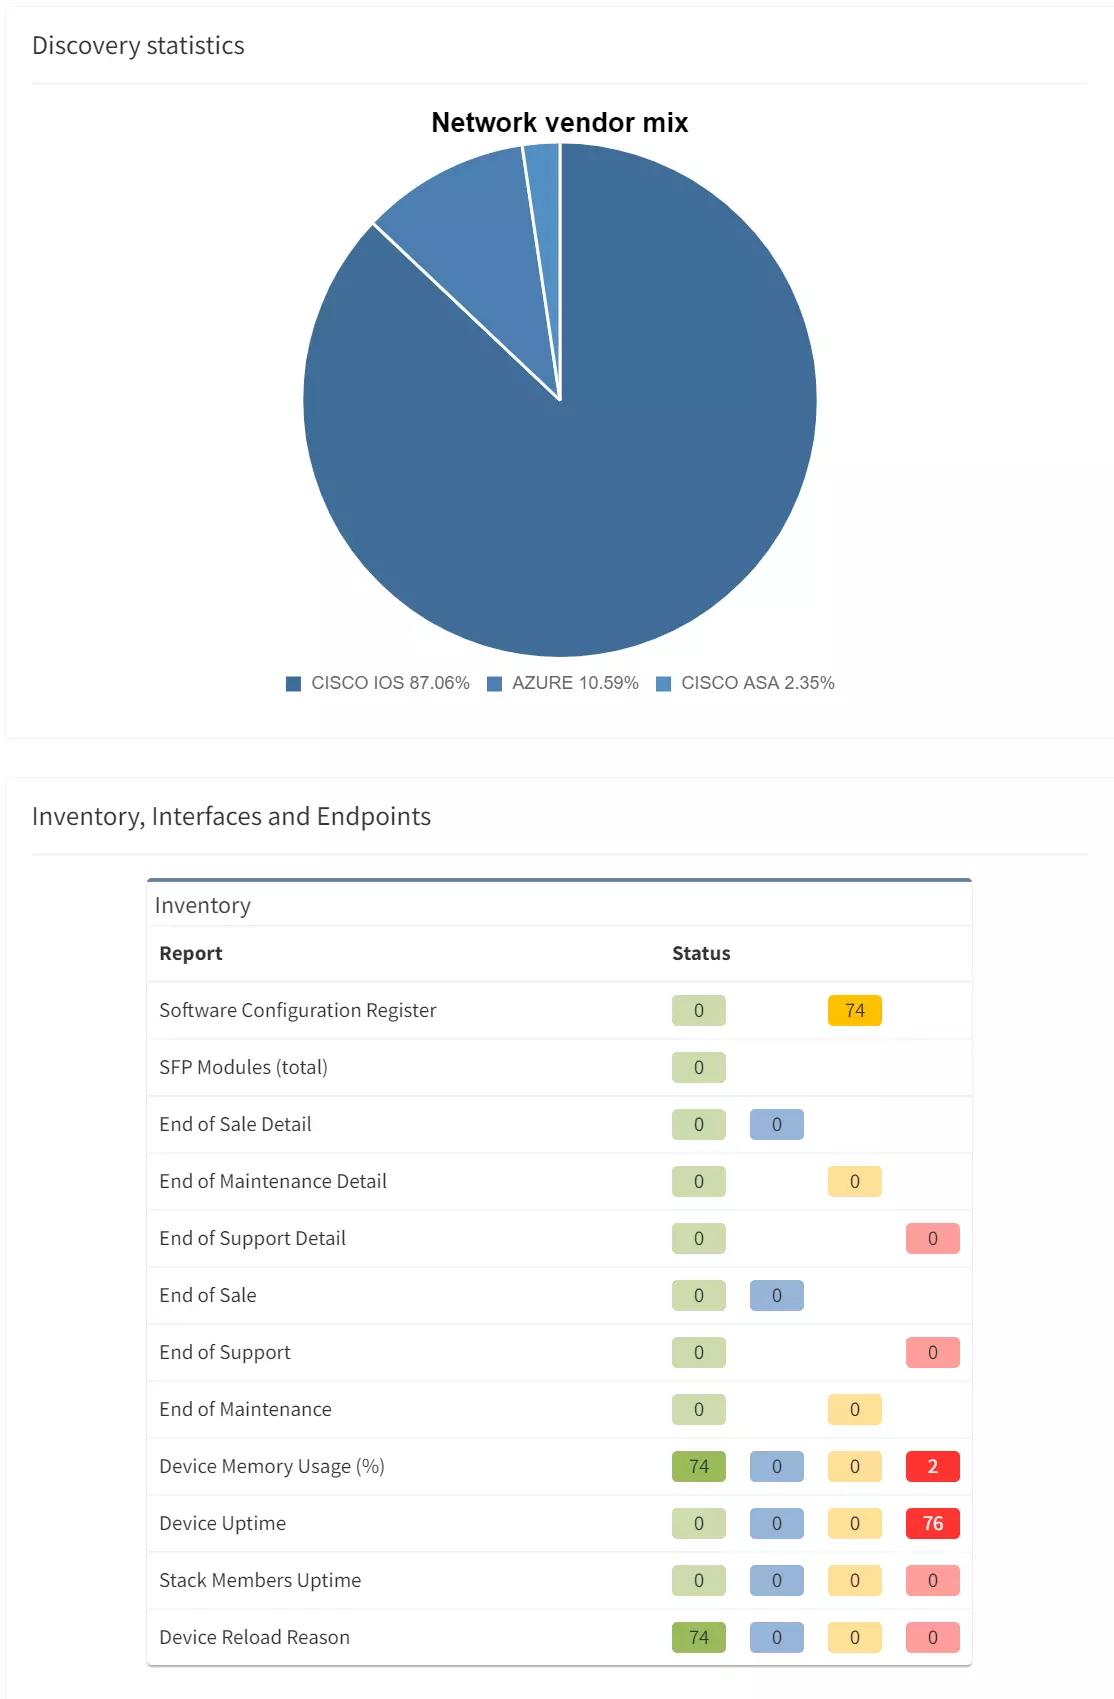
Some of the sections from the PDF are displayed below:
The IP Fabric Data Report takes this concept further by comparing data from two snapshots. This feature provides several key benefits.
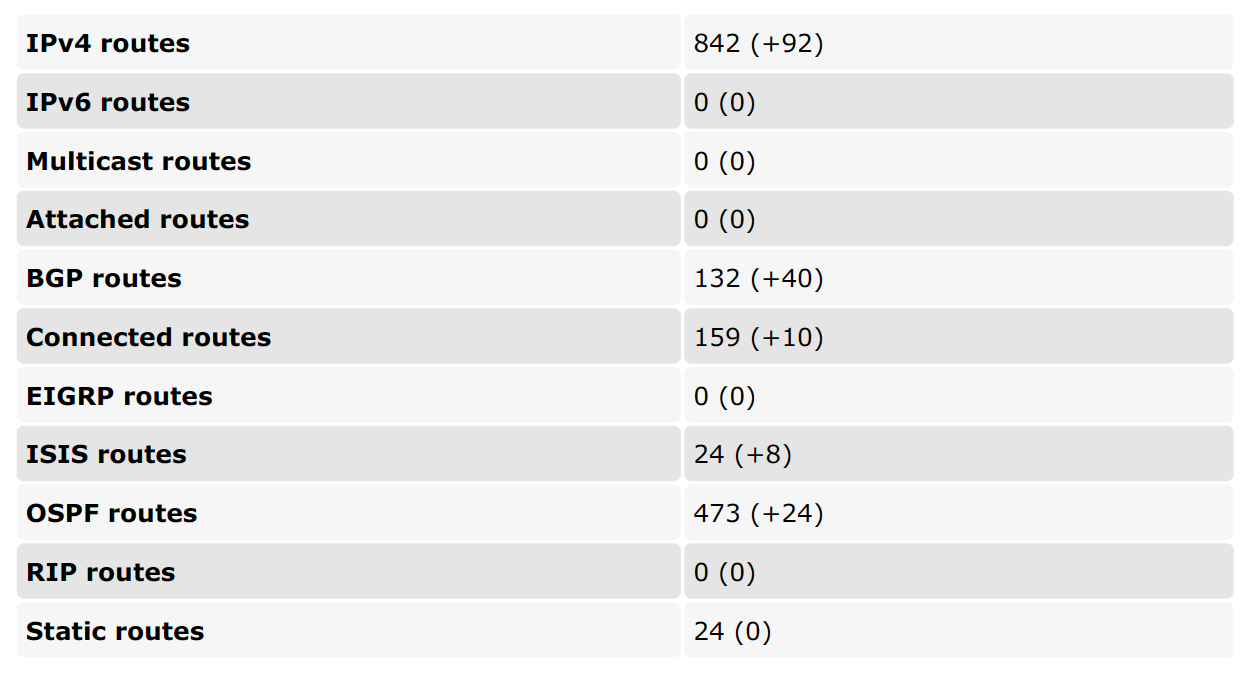
By comparing two snapshots, you can easily identify any changes in your network over time. This can help you track the progress of network improvements or identify potential issues before they have the chance to develop into serious problems.
Comparing snapshots allows you to establish benchmarks for your network's performance. This can be useful for setting performance goals and measuring the effectiveness of your network management strategies
Over time, comparing multiple snapshots can help you identify trends in your network's performance. This can provide valuable insights that can inform future network management decisions.
The IP Fabric Data Report is a Python script that uses IP Fabric's SDK to fetch data from two data sources (snapshots). It then uses Jinja2 and HTML to create a report, which is exported to PDF.
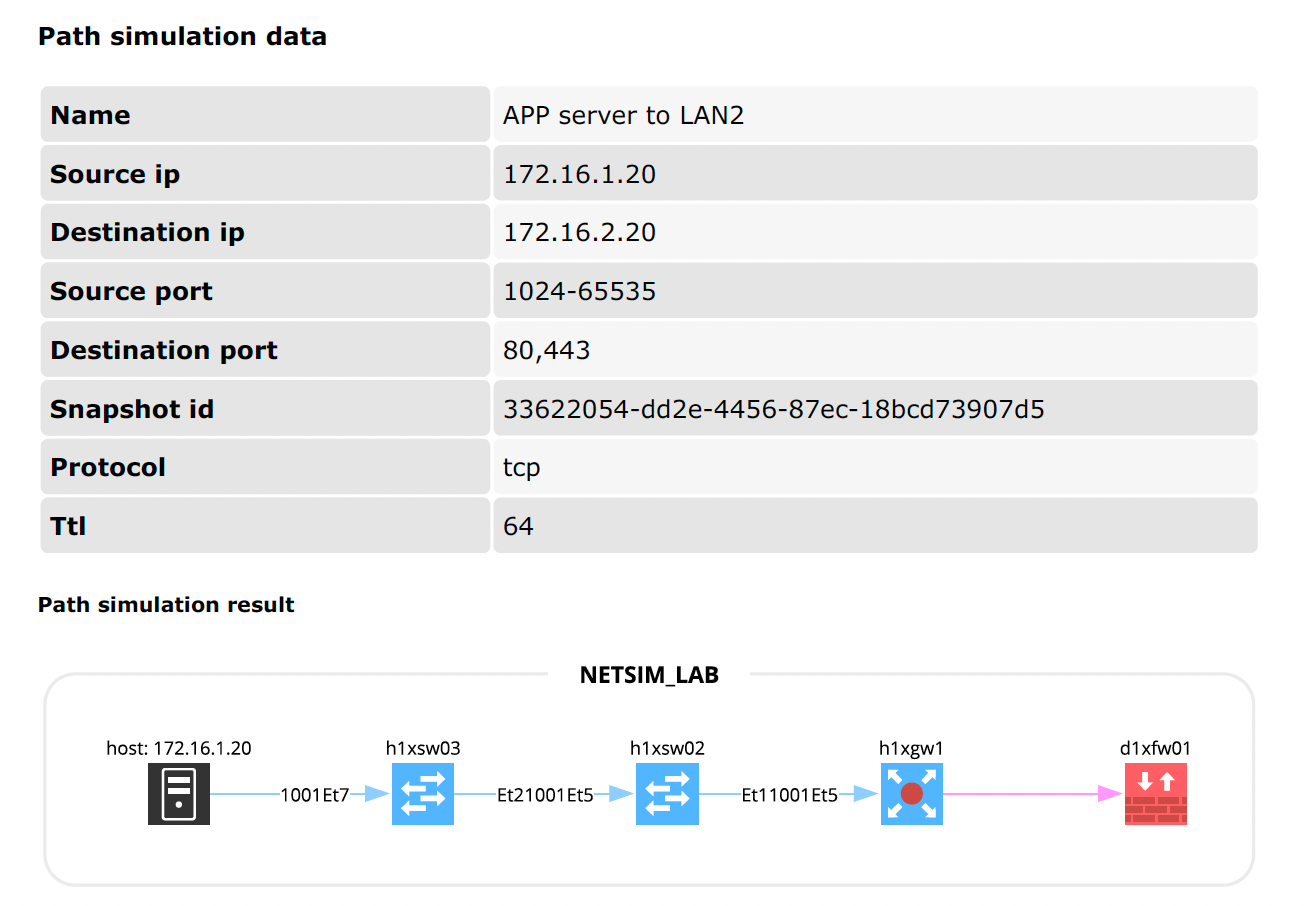
The script collects data about your network by creating an instance of the DataSource class and passing in the required parameters. It can also simulate a network path based on IP Fabric's snapshots by creating an instance of the PathSimulation class.
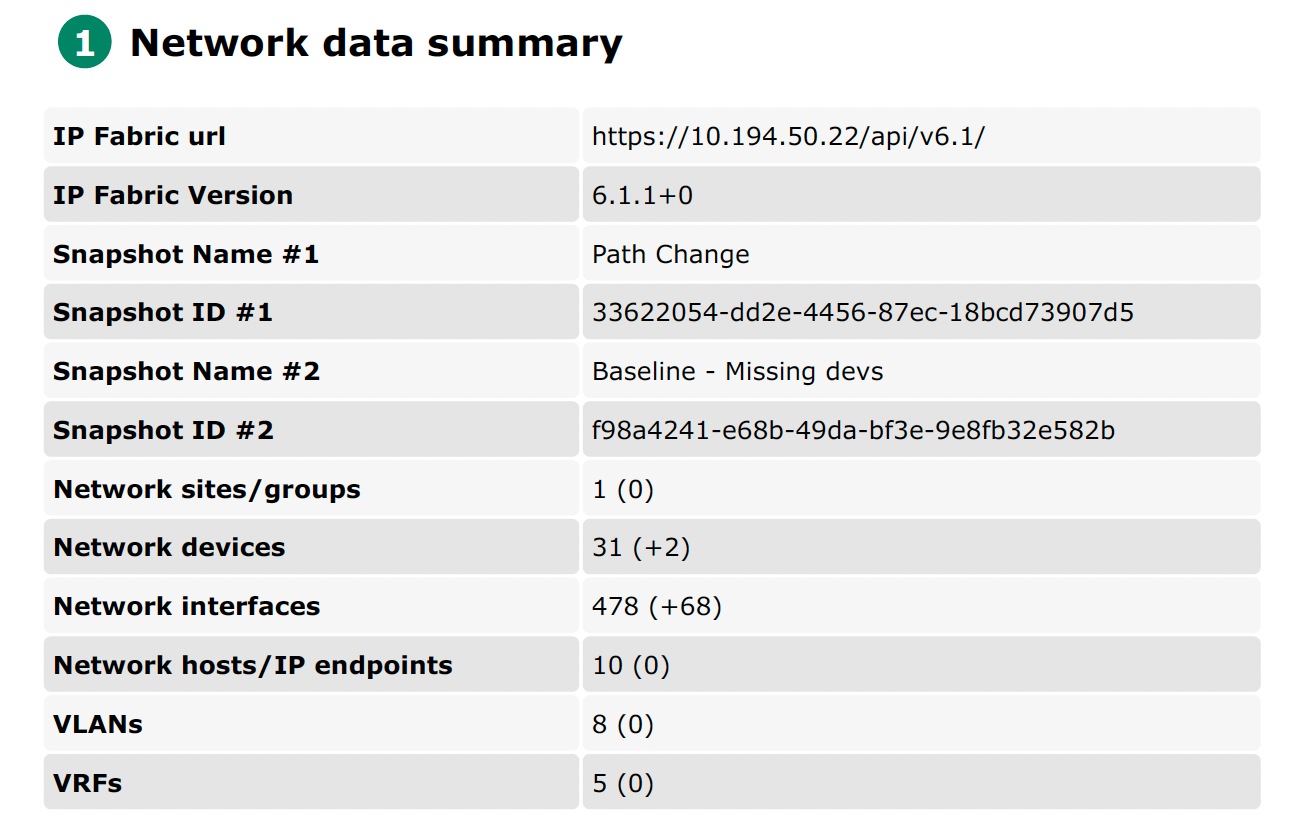
The report includes sections on:
But thanks to the ease of using IP Fabric's SDK, we can add any other items we choose to be present in the PDF report. In the example below, the SDK is used to collect some of the data:
class DataSource:
    def __init__(self, server_url, token, snapshot_id):
        self.ipf = IPFClient(server_url, token=token, snapshot_id=snapshot_id, verify=False, timeout=15)

        # Network data summary
        self.system_url = self.ipf.base_url
        self.os_version = self.ipf.os_version
        self.snapshot_id = self.ipf.snapshots[snapshot_id].snapshot_id
        self.snapshot_name = self.ipf.snapshot.name
        self.network_devices = self.ipf.inventory.devices.count()
        self.network_interfaces = self.ipf.snapshot.interface_count
        self.network_sites = self.ipf.inventory.sites.count()
self.network_hosts = self.ipf.inventory.hosts.count()One of the key strengths of the IP Fabric Data Report Generator is its capacity for customization. The script is designed to be easily modifiable to suit your specific needs. For example, you can add more data for comparison, including CVEs from the SDK or path simulation results.
By modifying the script, you can tailor the report to focus on the most relevant data for your team. This flexibility makes the IP Fabric Data Report Generator a powerful tool for any network management team.
In conclusion, the IP Fabric Data Report is a versatile tool that greatly enhances your network management capabilities. Automating the reporting process and allowing for easy customization can provide valuable insights into your network's health and performance.
Check out an example of a generated report using the IP Fabric Data Report Generator here.
If you are not yet using IP Fabric and want to see what it could do for your network team, check out our free, self-guided demo or check out our ROI calculator.
Don't forget to follow us on LinkedIn, and on our blog, where we regularly publish new content.
Unlock the power of automated network analysis with the IP Fabric Data Report. This tool leverages IP Fabric's API to create detailed, customizable PDF reports that provide invaluable insights into your network's health and performance. Discover how this Python script can revolutionize your approach to network data comparison.
In the fast-paced world of network management, the ability to quickly and accurately assess the health of your network is paramount. One of the most effective ways to achieve this is through automated reporting. Automated reports, such as those generated by the IP Fabric Data Report Generator, help teams address frequent requirements for network data comparison between two different snapshots, such as:
By automating the process, teams can save valuable time and resources that would otherwise be spent manually collecting and analyzing data. This increases efficiency and reduces the risk of human error, ensuring that the data you base your decisions on is accurate and reliable.
Some of the sections from the PDF are displayed below:
The IP Fabric Data Report takes this concept further by comparing data from two snapshots. This feature provides several key benefits.
By comparing two snapshots, you can easily identify any changes in your network over time. This can help you track the progress of network improvements or identify potential issues before they have the chance to develop into serious problems.
Comparing snapshots allows you to establish benchmarks for your network's performance. This can be useful for setting performance goals and measuring the effectiveness of your network management strategies
Over time, comparing multiple snapshots can help you identify trends in your network's performance. This can provide valuable insights that can inform future network management decisions.
The IP Fabric Data Report is a Python script that uses IP Fabric's SDK to fetch data from two data sources (snapshots). It then uses Jinja2 and HTML to create a report, which is exported to PDF.
The script collects data about your network by creating an instance of the DataSource class and passing in the required parameters. It can also simulate a network path based on IP Fabric's snapshots by creating an instance of the PathSimulation class.
The report includes sections on:
But thanks to the ease of using IP Fabric's SDK, we can add any other items we choose to be present in the PDF report. In the example below, the SDK is used to collect some of the data:
class DataSource:
    def __init__(self, server_url, token, snapshot_id):
        self.ipf = IPFClient(server_url, token=token, snapshot_id=snapshot_id, verify=False, timeout=15)

        # Network data summary
        self.system_url = self.ipf.base_url
        self.os_version = self.ipf.os_version
        self.snapshot_id = self.ipf.snapshots[snapshot_id].snapshot_id
        self.snapshot_name = self.ipf.snapshot.name
        self.network_devices = self.ipf.inventory.devices.count()
        self.network_interfaces = self.ipf.snapshot.interface_count
        self.network_sites = self.ipf.inventory.sites.count()
self.network_hosts = self.ipf.inventory.hosts.count()One of the key strengths of the IP Fabric Data Report Generator is its capacity for customization. The script is designed to be easily modifiable to suit your specific needs. For example, you can add more data for comparison, including CVEs from the SDK or path simulation results.
By modifying the script, you can tailor the report to focus on the most relevant data for your team. This flexibility makes the IP Fabric Data Report Generator a powerful tool for any network management team.
In conclusion, the IP Fabric Data Report is a versatile tool that greatly enhances your network management capabilities. Automating the reporting process and allowing for easy customization can provide valuable insights into your network's health and performance.
Check out an example of a generated report using the IP Fabric Data Report Generator here.
If you are not yet using IP Fabric and want to see what it could do for your network team, check out our free, self-guided demo or check out our ROI calculator.
Don't forget to follow us on LinkedIn, and on our blog, where we regularly publish new content.