This week we released IP Fabric version 2.2.5 which focuses on improvements of network diagram workflow, significantly improving the depth of information provided in the diagram tooltips, and improving readability of the End to End path diagrams. We’ve also added pseudo-STP links, or MAC edges, to correctly interconnect Layer 2 and Layer 3 when discovery protocol is not present between the devices. This release also adds support for GLBP protocol, support for multi-context Cisco ASA firewalls, support for discovery of ExtremeXOS devices, wireless support for HP830/850, and many other improvements and fixes as detailed in the release notes.
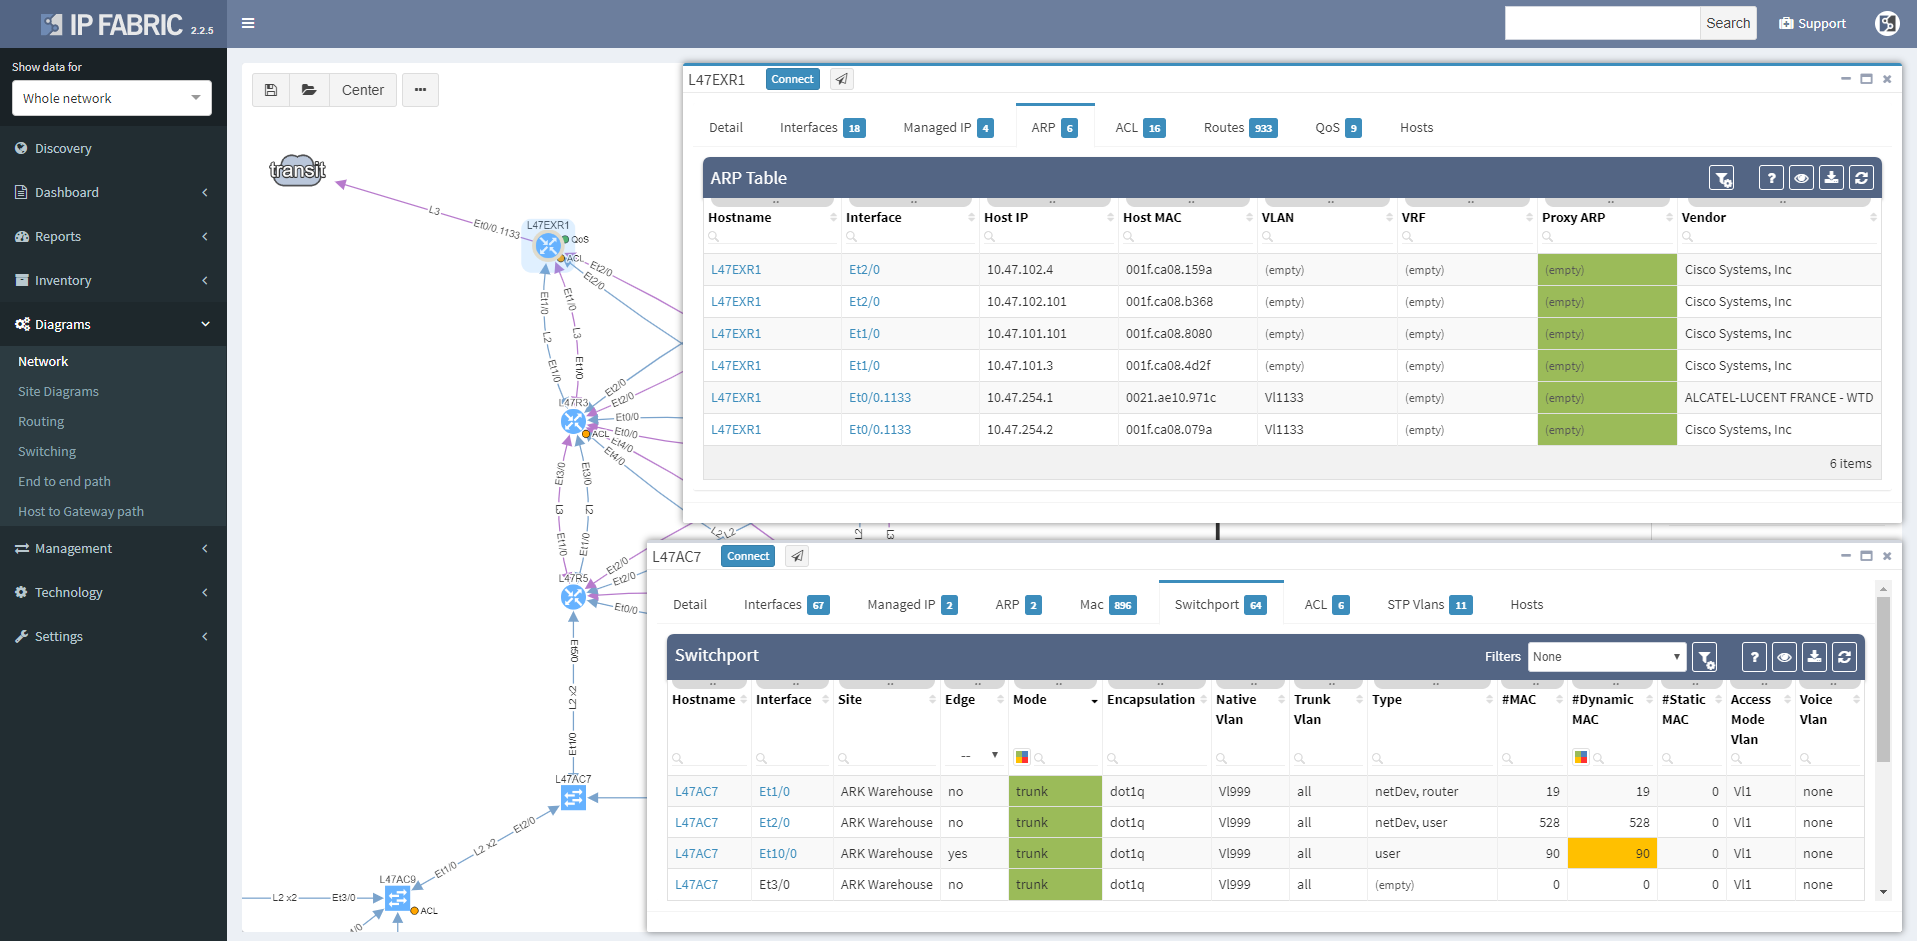
Clicking on a device or link in the network diagram now opens a detailed tooltip with information about the object. Information is contained in tabs of each window, and tabs depend on what functions the device is performing and what protocols it is running. For routers there is naturally more Layer 3 information, including ARP and active routing table entries. For switches there is much more Layer 2 detail, such as switchports and MAC address table entries.
Wireless controller tooltips contain information about APs, firewalls about zones, and so on.
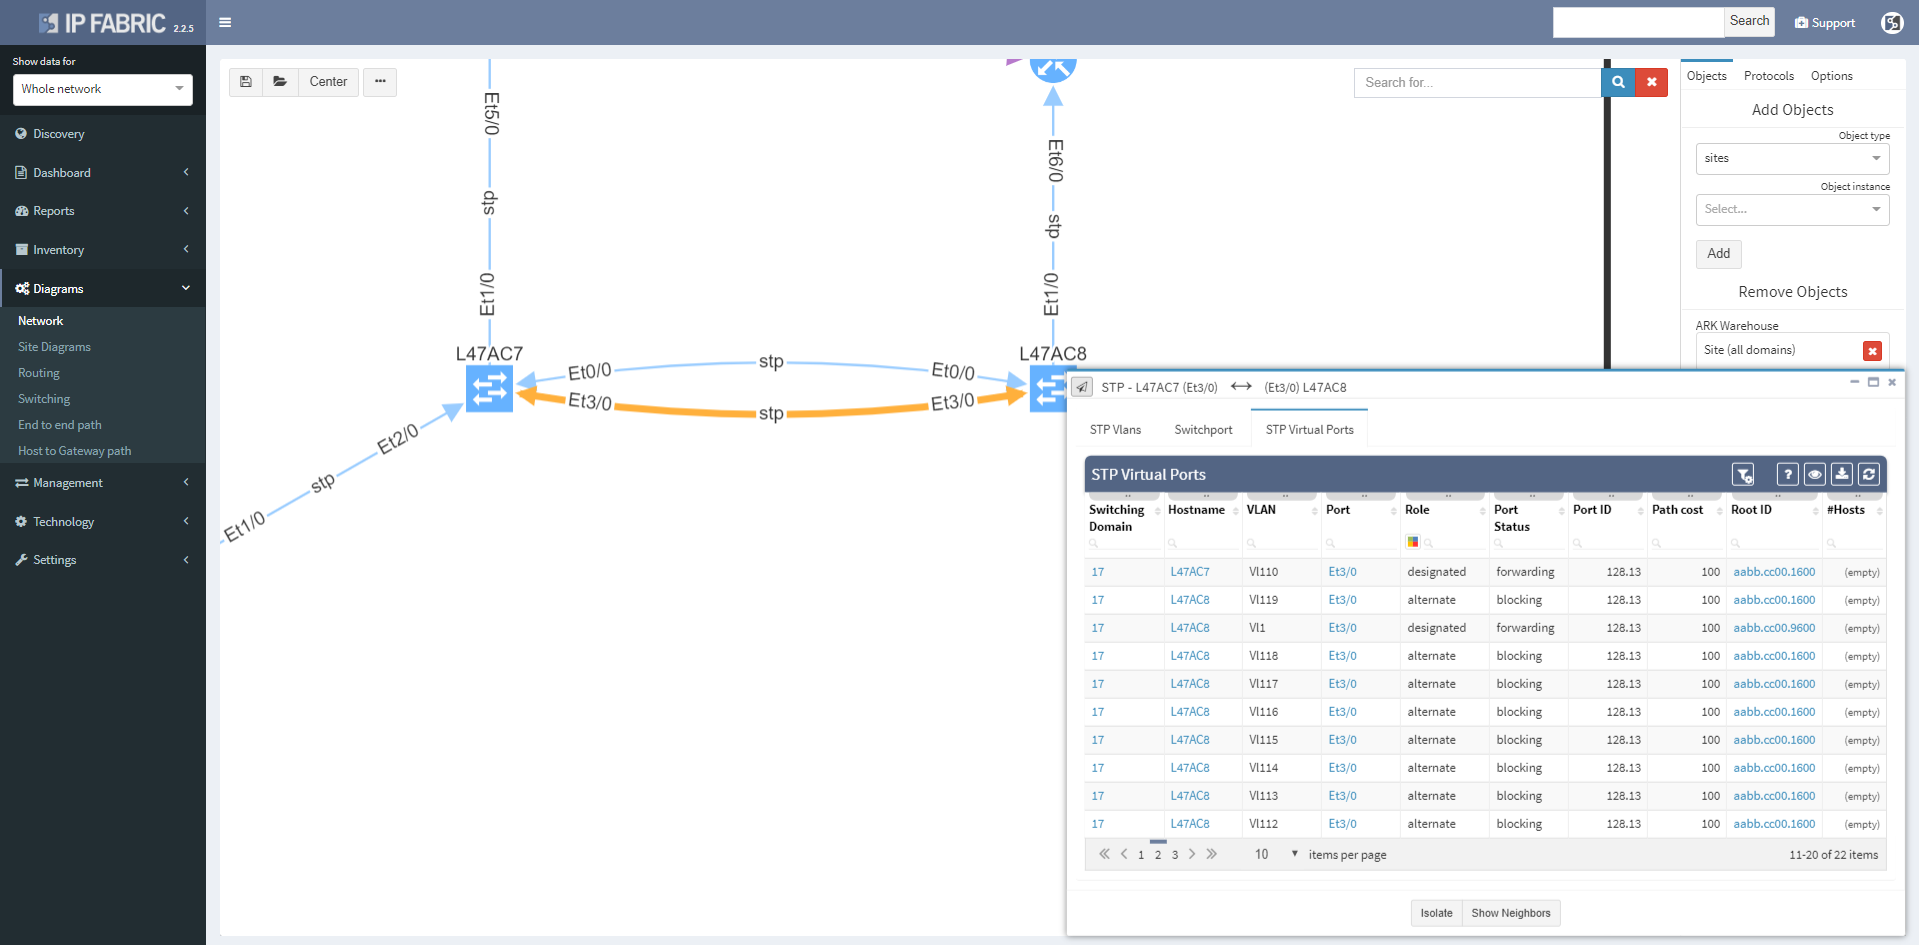
Clicking on a protocol link also opens a window with specific details relevant for the protocol, such as virtual ports and switchport details for the STP link
Or routes and for the routed links
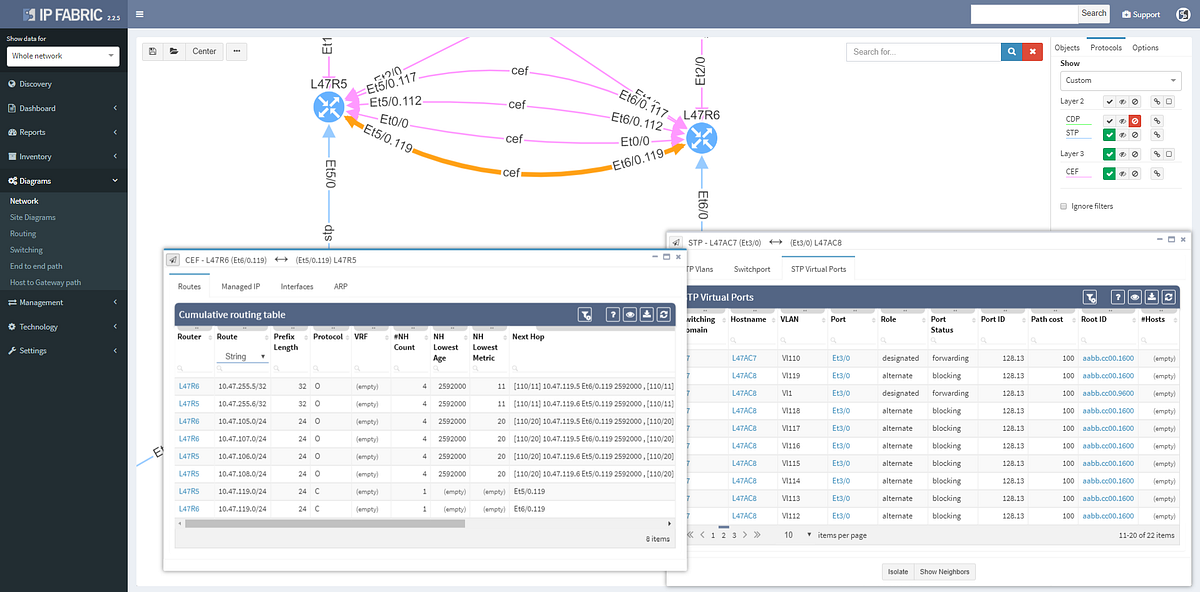
Switching tab to the Managed IP on the routed link shows active IP addresses on both sides of that link.
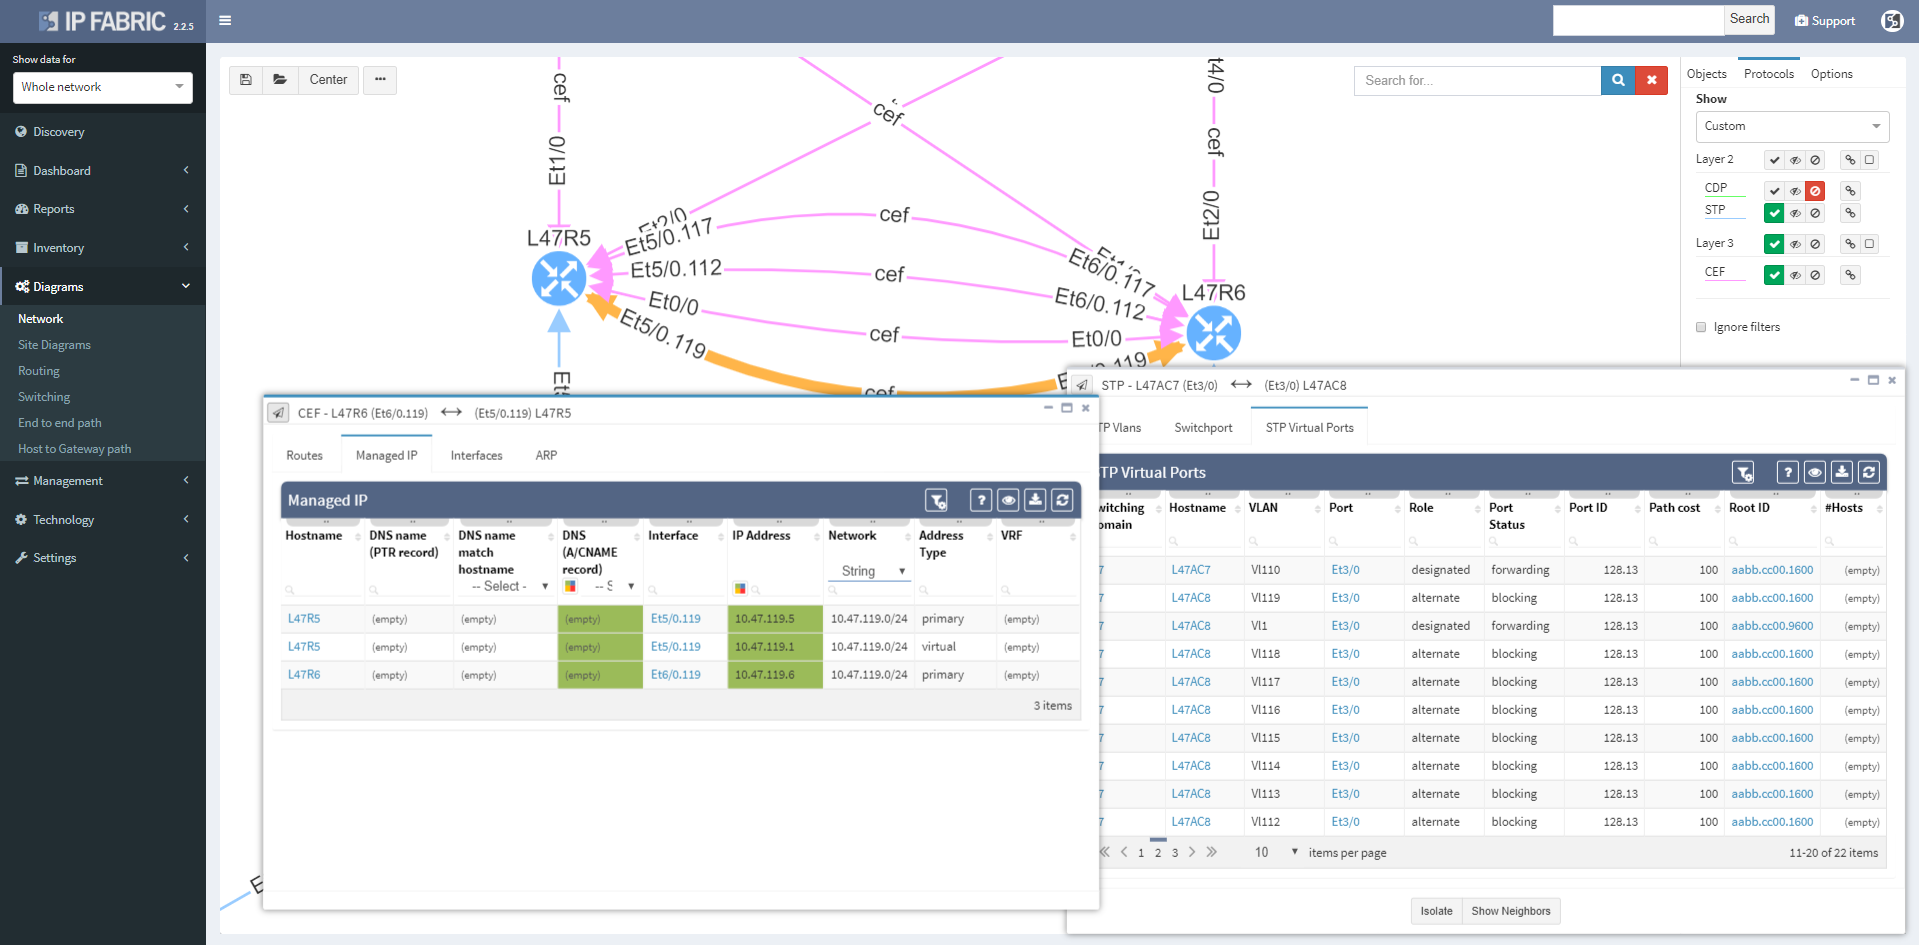
More time can now be spent in network diagrams and going through the detail without leaving the diagrams by managing tooltip windows. These can be resized, moved, or minimized as needed, and can be referred to later by clicking on the window icon in the bottom right corner of the browser window.

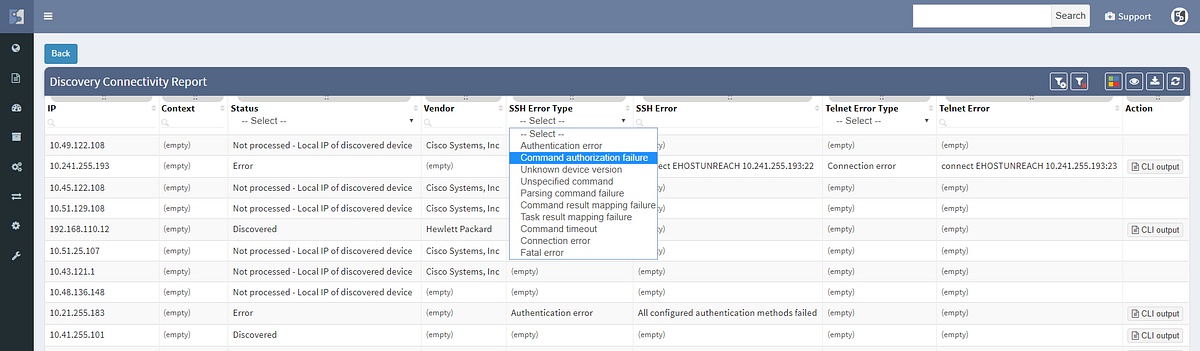
We haven’t focused exclusively on the diagrams, and the Discovery interface has been improved to include information about encountered errors during parsing of device output, grouping issues by error types and enabling to click through to specific output that caused a problem for IP Fabric. This enables to quickly spot issues such as missing authorization for a specific command, or inappropriate timeouts for very long command outputs.
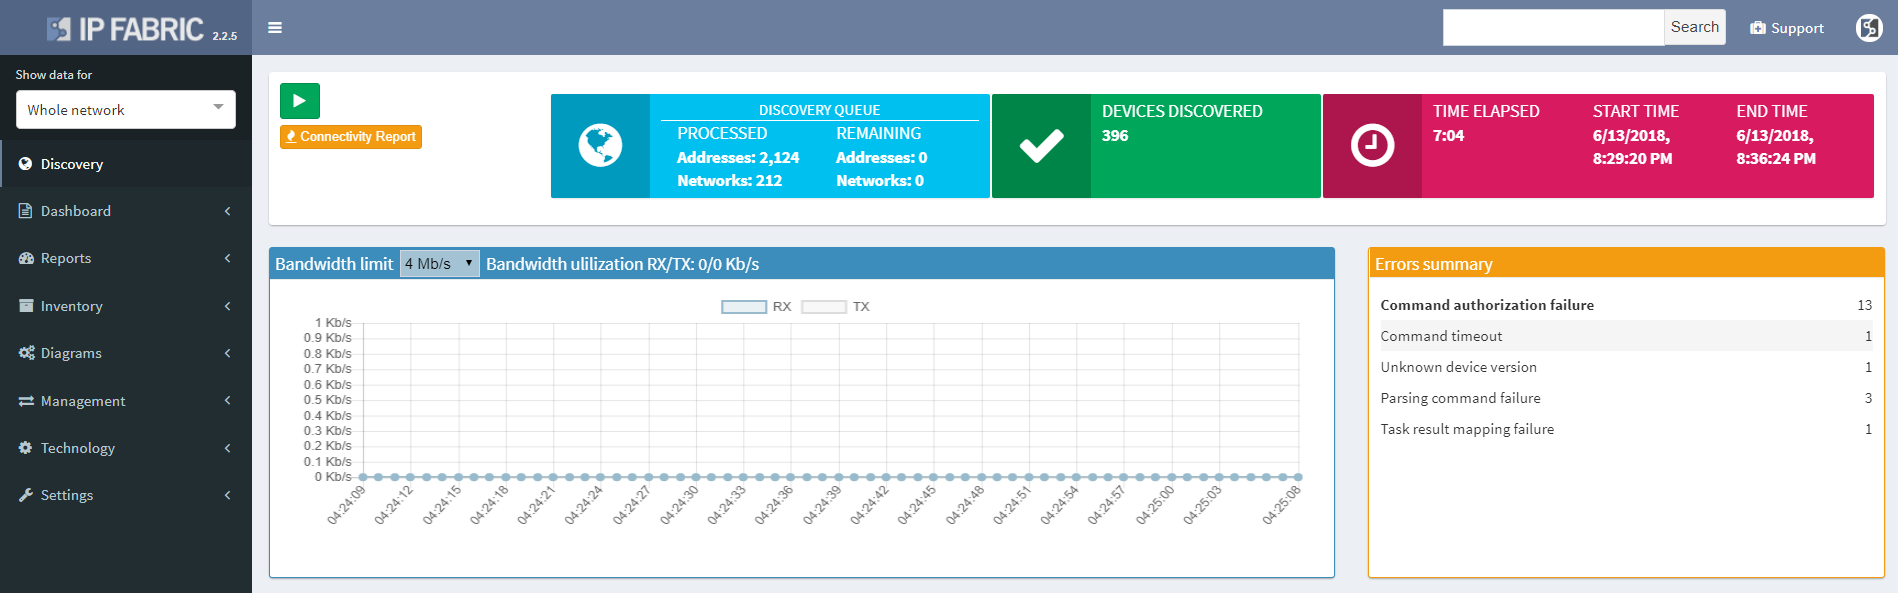
The discovery connectivity report itself has also been improved to include not only successful and failed attempts, but also skipped attempts when an IP in queue was found to be belonging to one of the discovered devices, or halted attempts when device being discovered was found to be discovered in parallel by another process (simultaneous duplicate discovery). A complete CLI output log is also available for each attempt.
If you’re interested in learning more about how IP Fabric’s platform can help you with analytics or intended network behavior reporting, contact us through our website, request a demo, follow this blog or sign up for our webinars.
This week we released IP Fabric version 2.2.5 which focuses on improvements of network diagram workflow, significantly improving the depth of information provided in the diagram tooltips, and improving readability of the End to End path diagrams. We’ve also added pseudo-STP links, or MAC edges, to correctly interconnect Layer 2 and Layer 3 when discovery protocol is not present between the devices. This release also adds support for GLBP protocol, support for multi-context Cisco ASA firewalls, support for discovery of ExtremeXOS devices, wireless support for HP830/850, and many other improvements and fixes as detailed in the release notes.
Clicking on a device or link in the network diagram now opens a detailed tooltip with information about the object. Information is contained in tabs of each window, and tabs depend on what functions the device is performing and what protocols it is running. For routers there is naturally more Layer 3 information, including ARP and active routing table entries. For switches there is much more Layer 2 detail, such as switchports and MAC address table entries.
Wireless controller tooltips contain information about APs, firewalls about zones, and so on.
Clicking on a protocol link also opens a window with specific details relevant for the protocol, such as virtual ports and switchport details for the STP link
Or routes and for the routed links
Switching tab to the Managed IP on the routed link shows active IP addresses on both sides of that link.
More time can now be spent in network diagrams and going through the detail without leaving the diagrams by managing tooltip windows. These can be resized, moved, or minimized as needed, and can be referred to later by clicking on the window icon in the bottom right corner of the browser window.
We haven’t focused exclusively on the diagrams, and the Discovery interface has been improved to include information about encountered errors during parsing of device output, grouping issues by error types and enabling to click through to specific output that caused a problem for IP Fabric. This enables to quickly spot issues such as missing authorization for a specific command, or inappropriate timeouts for very long command outputs.
The discovery connectivity report itself has also been improved to include not only successful and failed attempts, but also skipped attempts when an IP in queue was found to be belonging to one of the discovered devices, or halted attempts when device being discovered was found to be discovered in parallel by another process (simultaneous duplicate discovery). A complete CLI output log is also available for each attempt.
If you’re interested in learning more about how IP Fabric’s platform can help you with analytics or intended network behavior reporting, contact us through our website, request a demo, follow this blog or sign up for our webinars.