Wireless LAN (Local Area Network) or WLAN access points are inevitably a stable part of enterprise networks. The number of connected devices has been growing exponentially during the past years. And the forecast says that more than 20 billion devices will be connected in 2021.
There are many solutions on the market from standalone wireless routers for small businesses to worldwide deployments. Large deployments usually require wireless controllers managed centrally. The IP Fabric platform's main focus is large and complex networks. That's why the focus in this article will be on the discovery of wireless controllers and its access-points and end-users.
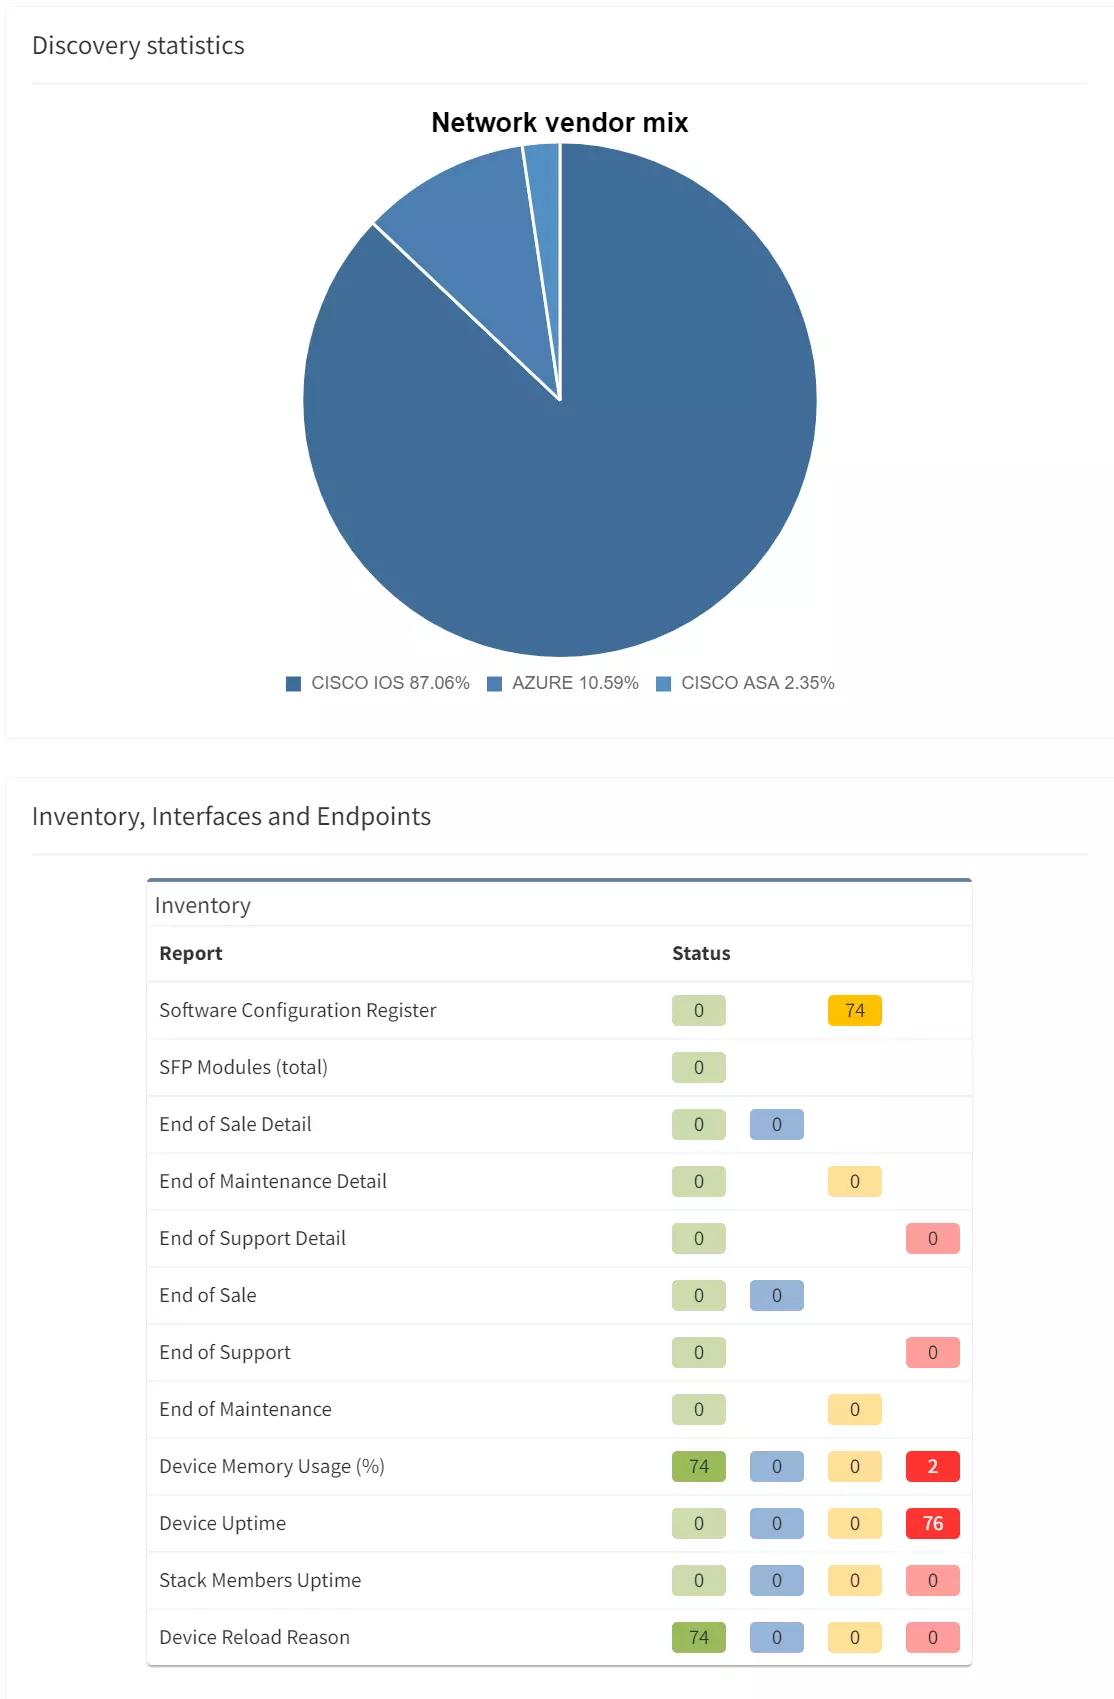
The top 3 hardware vendors based on market share are currently Cisco (with more than 40% of market share), Aruba-HPE (with about 14%), and Ubiquity (with about 7%). There's no secret that IP Fabric started with Cisco as its first vendor to support (since founders are former CCIEs). That was extended to Aruba-HPE later on and there hasn't been any client of IP Fabric that would require to cover another vendor than those two.
The standard process of implementing wireless networks with controllers of any vendor usually includes using their proprietary software to manage the hardware.
In the case of Cisco WLAN, it was previously Cisco Prime (which is still widely popular), and it's shifting to Cisco DNA. It allows the administrators to combine the management of routers, switches, and firewalls with the wireless world.
Similarly, the Aruba-HPE with Aruba Central is capable of managing a wide range of infrastructure products, even supporting different vendors.
However, the friction points may appear when trying to connect many different worlds together and try to unify. With the IP Fabric platform, we can easily read all data from Cisco or Aruba-HPE wireless controllers and add it to your standard network model. The ability to combine multiple sources from different vendors makes the data in IP Fabric a perfect fit for automation. Let's have a look at what data can be collected and represented.
The IP Fabric collects data only from wireless controllers. That is very convenient for its customers because the license model excludes the access-points (APs) from the license count. Here are the main 4 sections that are provided:
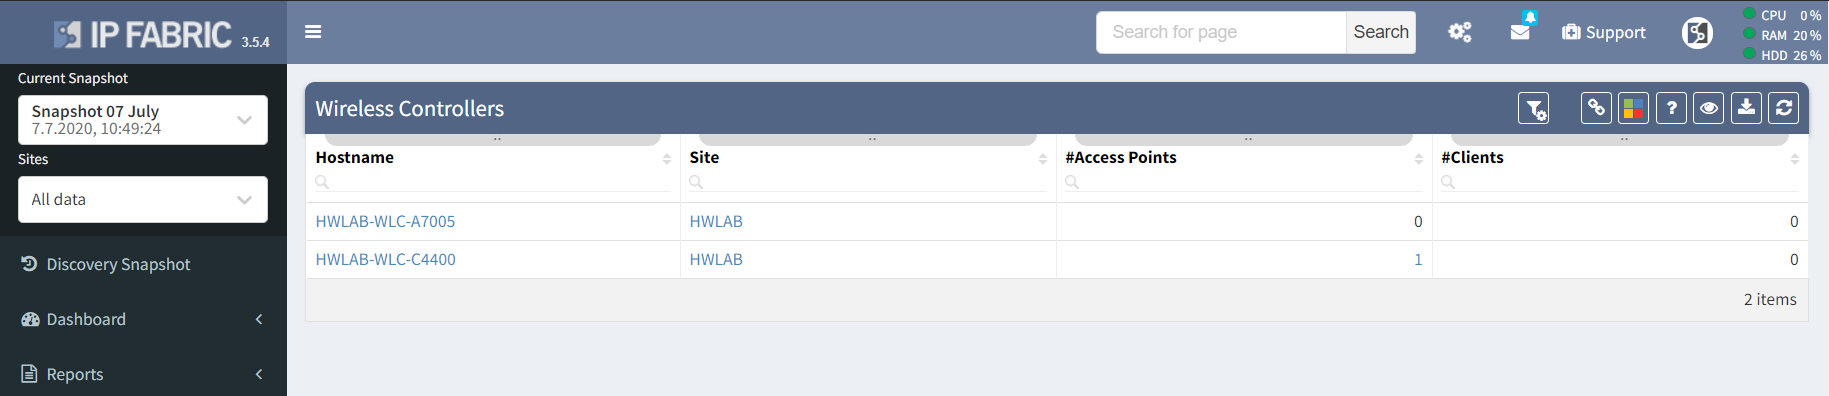
Overview of the Wireless Controllers in the network, showing the number of Access Points registered to each controller, and the total number of clients associated with the registered APs. Further investigation would be suitable for the following results.
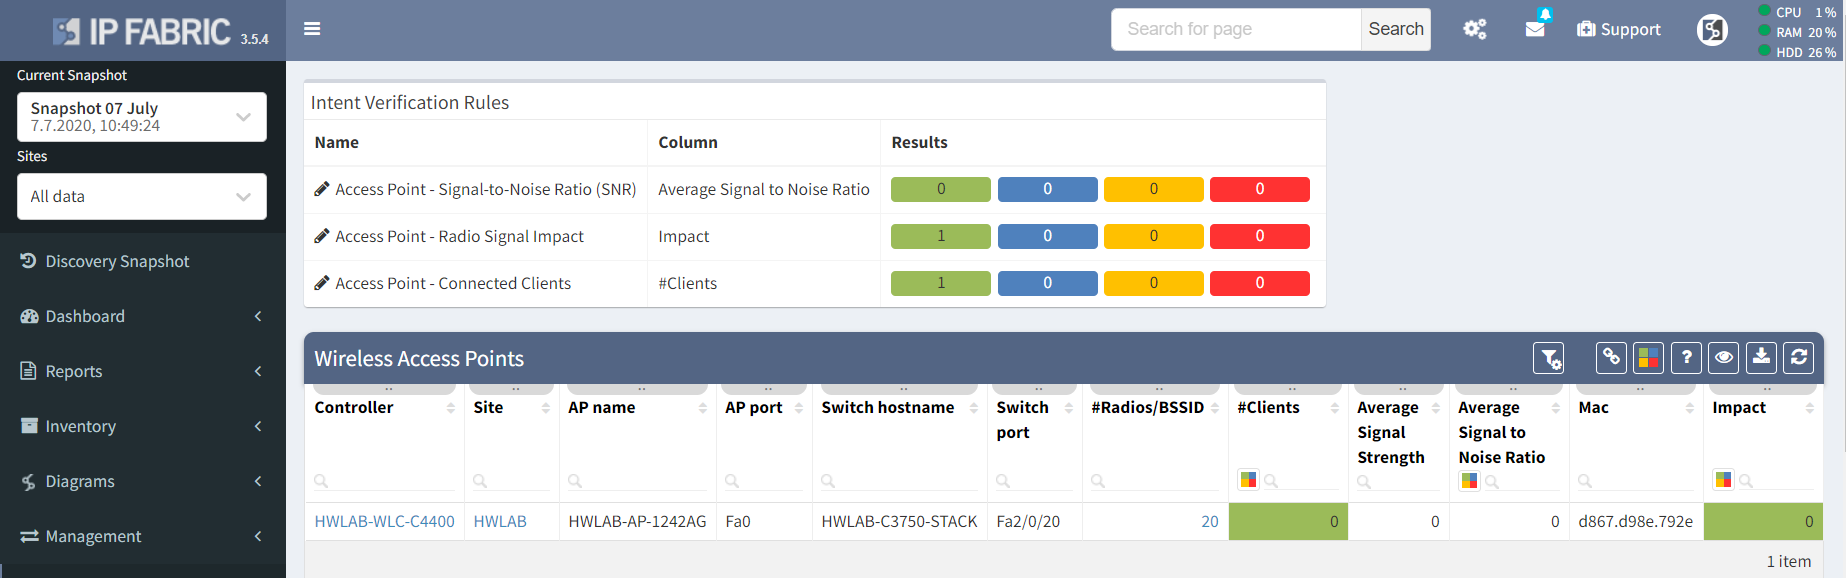
Details of all of the Wireless Access Points in the network, including the number of clients associated with each APs.
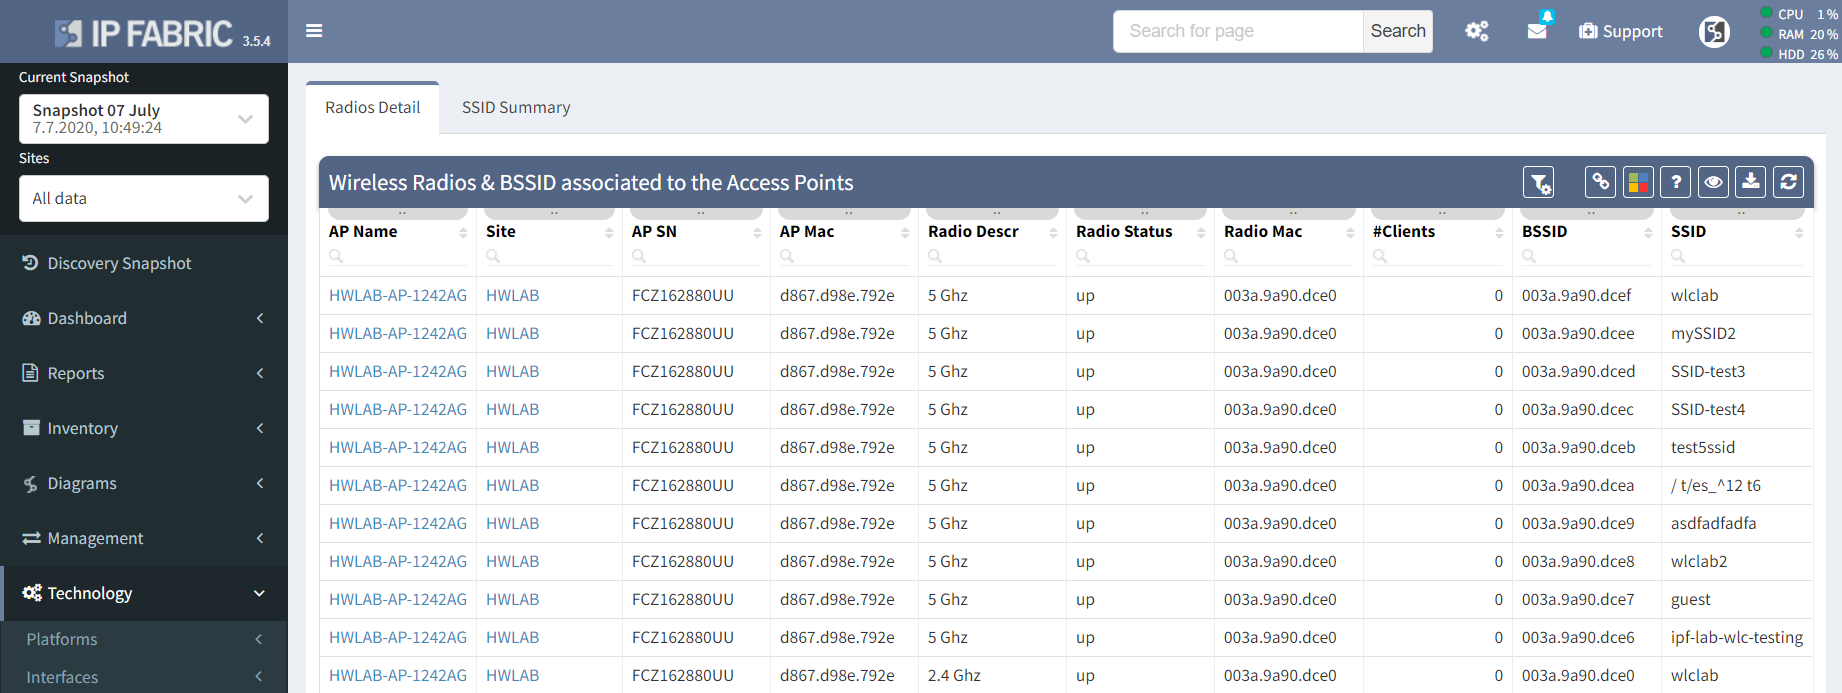
This table covers BSSID mapping to each Radio circuit on each wireless Access Point in the Network. Many APs today employ multiple Radio circuits to cover multiple frequency ranges. SSID ASCII identifiers are included in the table as well to ease the mapping.
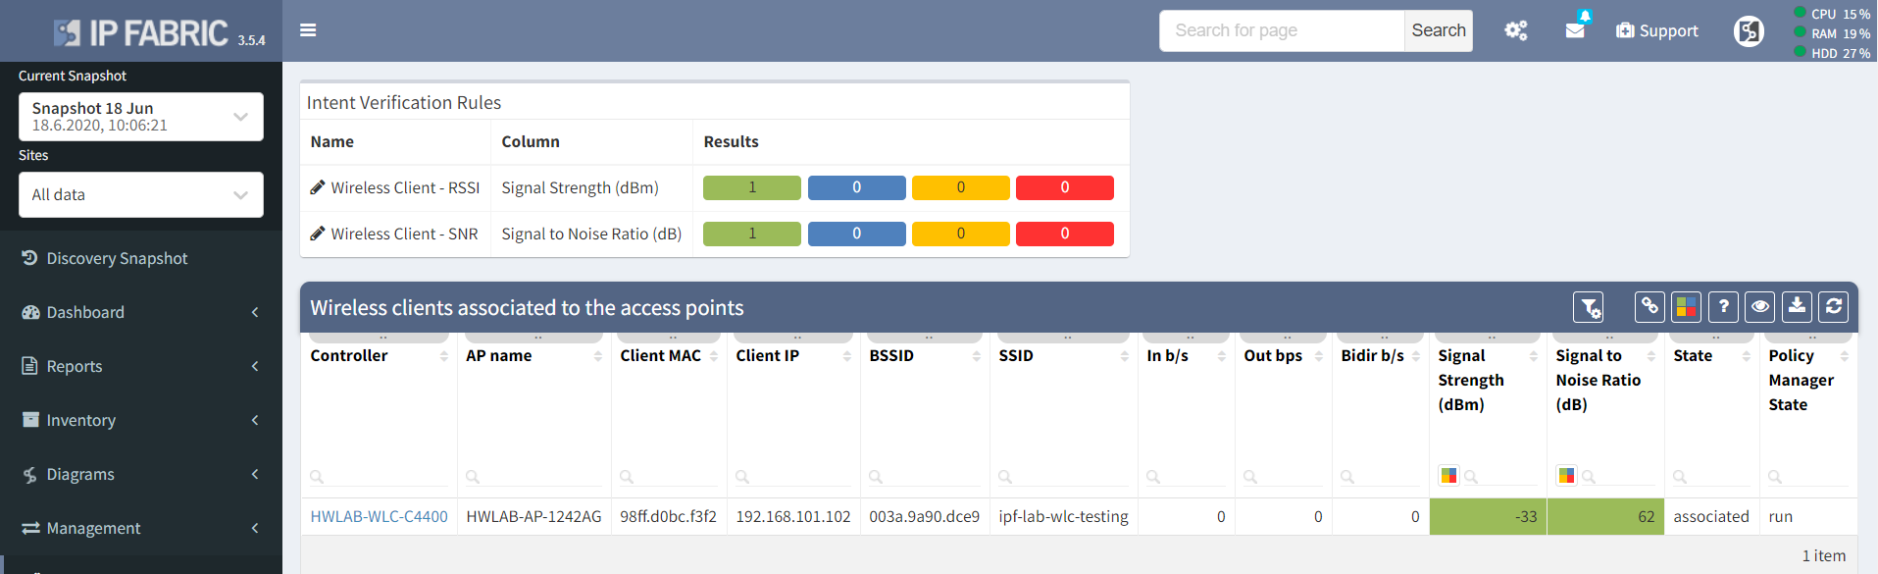
Details of all of the wireless clients associated with the Access Points.
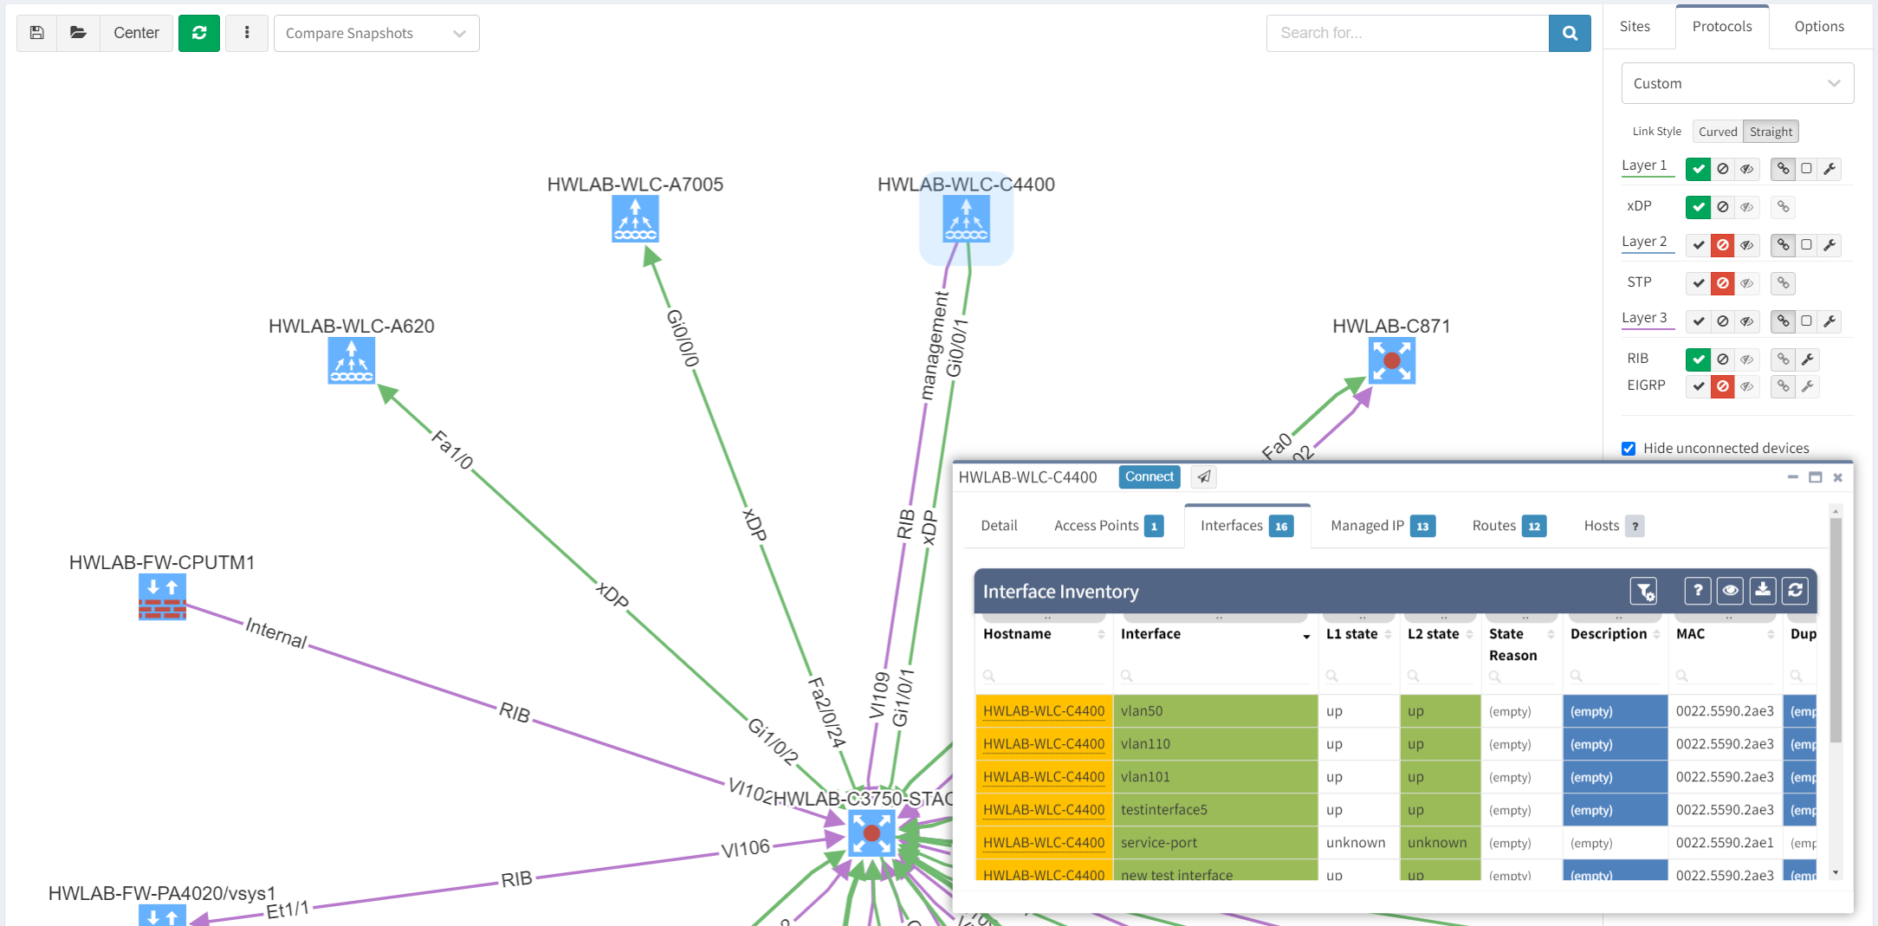
Working with engineering data in IP Fabric's technology tables or acquiring data via IP Fabric's API is one thing. But another one is to have complete topology map representation of the wireless network in diagrams including surrounding infrastructure and protocols.
The following network diagrams display connected wireless controllers to the core layer 3 device with a focus on some of its detail.
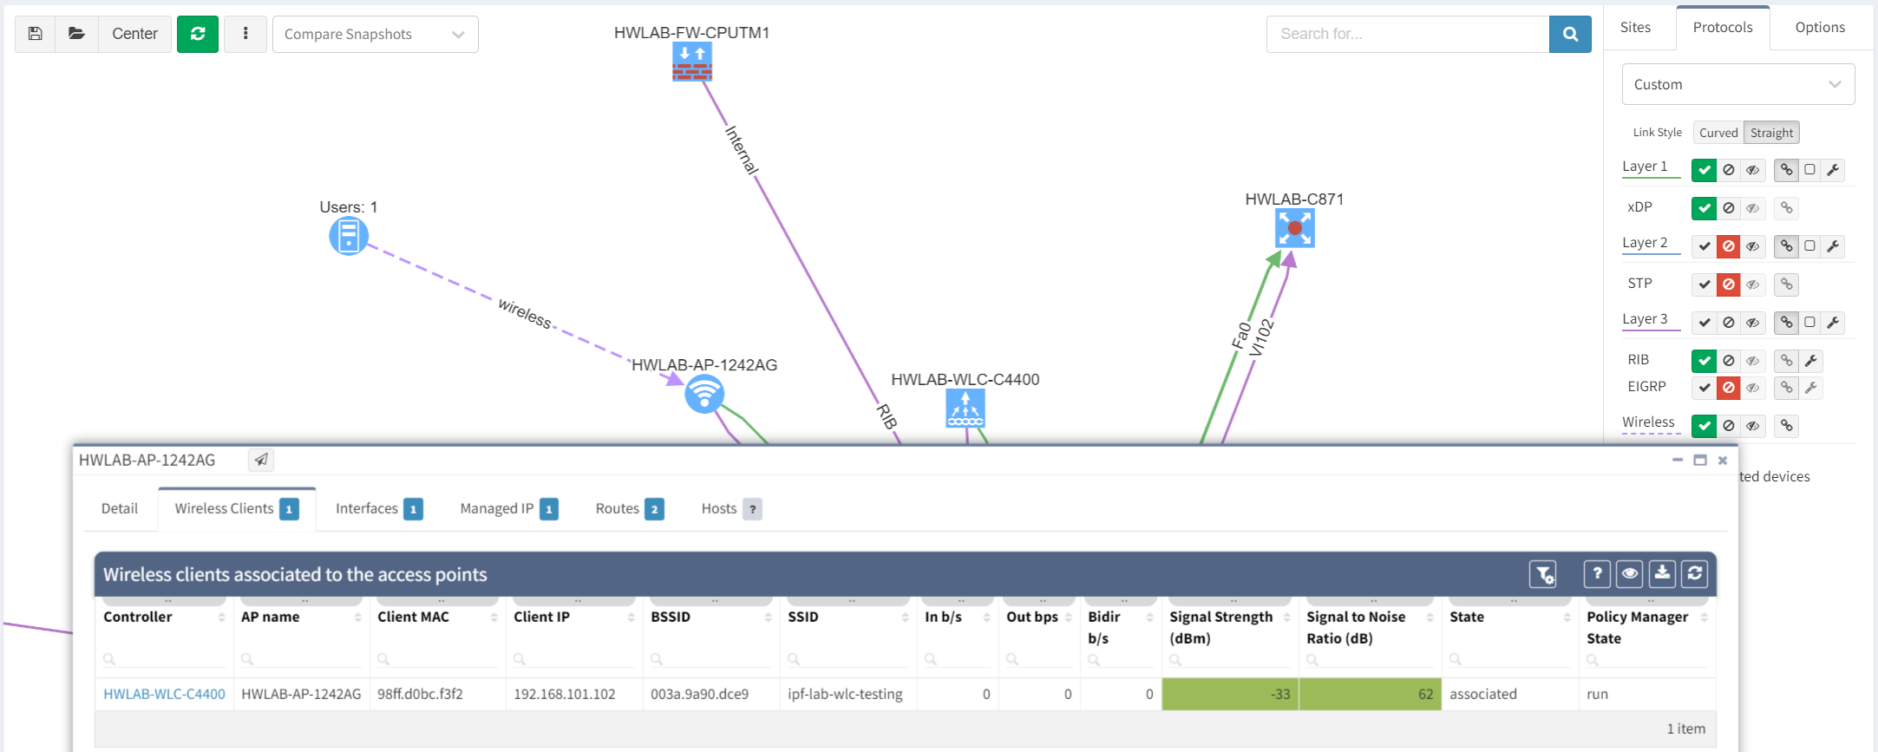
Similarly, we can provide more details with a focus on connected WLAN Access Points and connected users as well.
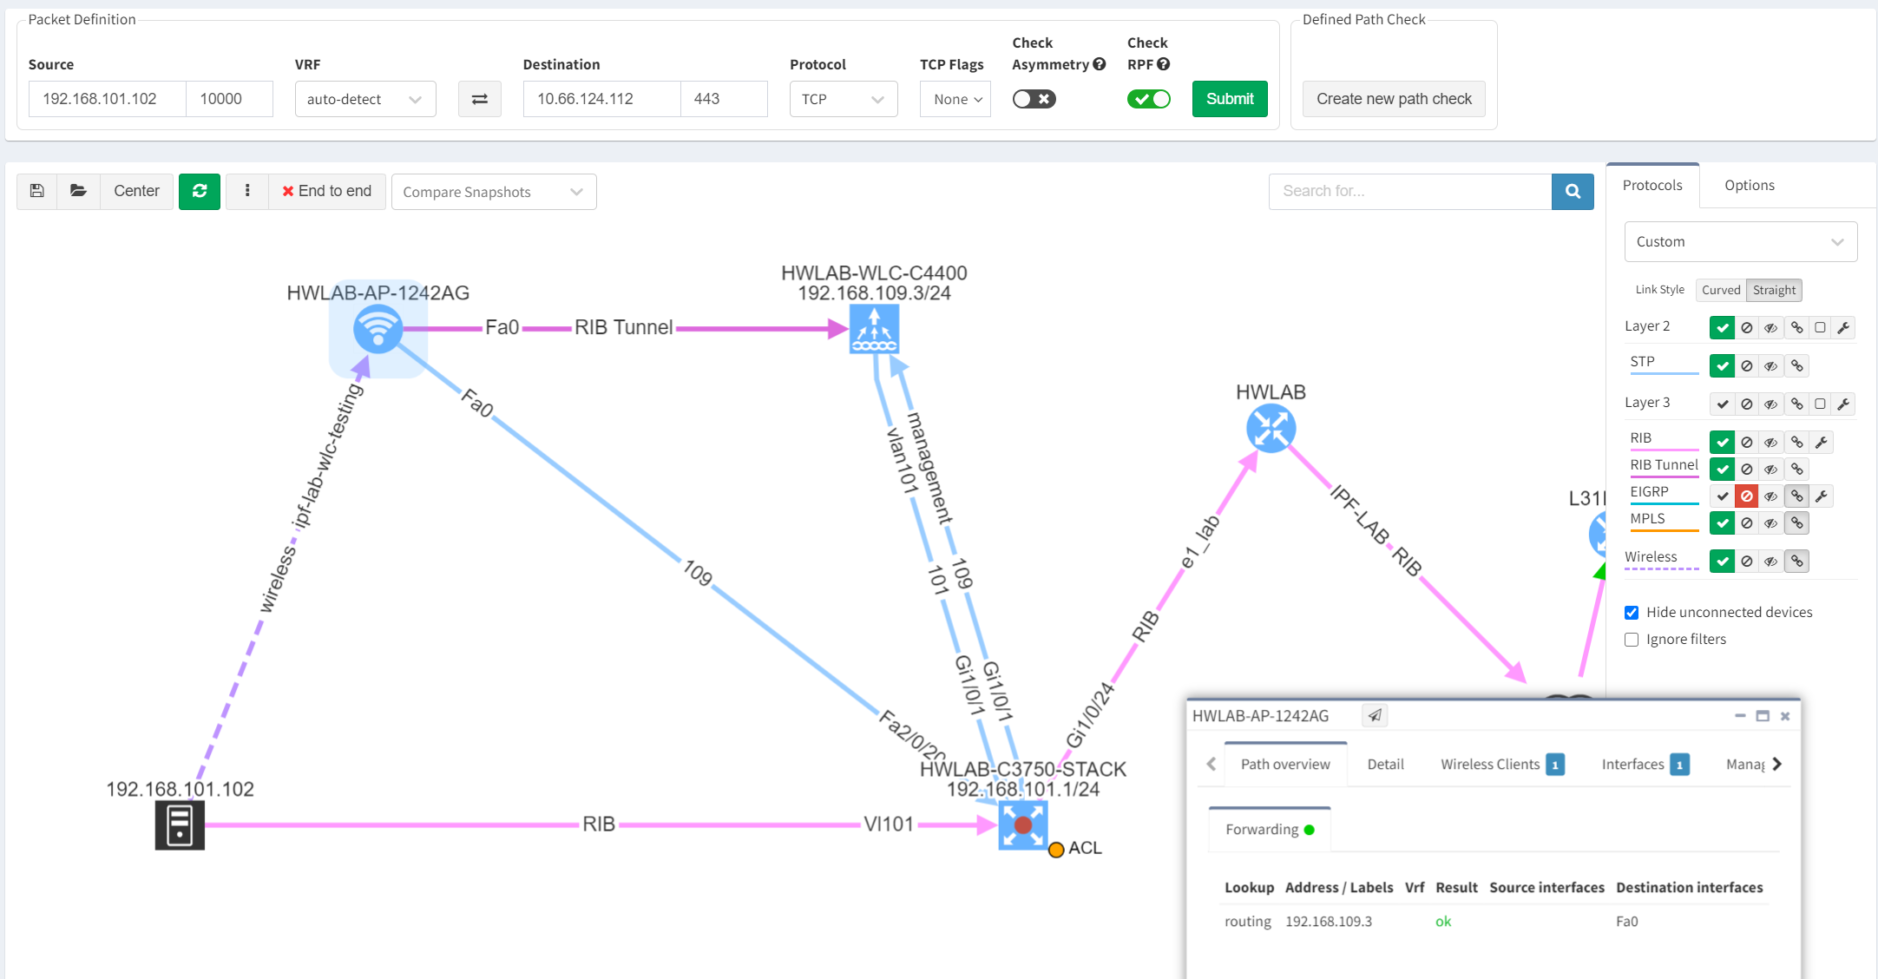
What makes the platform unique, however, is the end to end path simulation feature that supports wireless clients as well. On the left side of the screenshot is the user with IP address 192.168.101.102 that is trying to communicate with 10.66.124.112. The simulation is built based on routing & switching logic and data collected from all devices that participate. All individual layers or technologies are represented by the legend on the right.
In short, wireless networks have become a stable part of any complex network infrastructure. Any tool that goes beyond the standard management systems' capacity and has low or close to none administrative overhead should be welcomed.
To sum up, all features that have been demonstrated in this article are fully automated. Starting with discovery, data collection, topology maps, or end-to-end path simulation. Is it worth testing? Definitely! 🙂
If you have found this article helpful, please follow our company’s LinkedIn or Blog, where there will be more content emerging. Furthermore, if you would like to test our platform to evaluate how it can assist you in managing your network more effectively, please let us know through www.ipfabric.io.
Wireless LAN (Local Area Network) or WLAN access points are inevitably a stable part of enterprise networks. The number of connected devices has been growing exponentially during the past years. And the forecast says that more than 20 billion devices will be connected in 2021.
There are many solutions on the market from standalone wireless routers for small businesses to worldwide deployments. Large deployments usually require wireless controllers managed centrally. The IP Fabric platform's main focus is large and complex networks. That's why the focus in this article will be on the discovery of wireless controllers and its access-points and end-users.
The top 3 hardware vendors based on market share are currently Cisco (with more than 40% of market share), Aruba-HPE (with about 14%), and Ubiquity (with about 7%). There's no secret that IP Fabric started with Cisco as its first vendor to support (since founders are former CCIEs). That was extended to Aruba-HPE later on and there hasn't been any client of IP Fabric that would require to cover another vendor than those two.
The standard process of implementing wireless networks with controllers of any vendor usually includes using their proprietary software to manage the hardware.
In the case of Cisco WLAN, it was previously Cisco Prime (which is still widely popular), and it's shifting to Cisco DNA. It allows the administrators to combine the management of routers, switches, and firewalls with the wireless world.
Similarly, the Aruba-HPE with Aruba Central is capable of managing a wide range of infrastructure products, even supporting different vendors.
However, the friction points may appear when trying to connect many different worlds together and try to unify. With the IP Fabric platform, we can easily read all data from Cisco or Aruba-HPE wireless controllers and add it to your standard network model. The ability to combine multiple sources from different vendors makes the data in IP Fabric a perfect fit for automation. Let's have a look at what data can be collected and represented.
The IP Fabric collects data only from wireless controllers. That is very convenient for its customers because the license model excludes the access-points (APs) from the license count. Here are the main 4 sections that are provided:
Overview of the Wireless Controllers in the network, showing the number of Access Points registered to each controller, and the total number of clients associated with the registered APs. Further investigation would be suitable for the following results.
Details of all of the Wireless Access Points in the network, including the number of clients associated with each APs.
This table covers BSSID mapping to each Radio circuit on each wireless Access Point in the Network. Many APs today employ multiple Radio circuits to cover multiple frequency ranges. SSID ASCII identifiers are included in the table as well to ease the mapping.
Details of all of the wireless clients associated with the Access Points.
Working with engineering data in IP Fabric's technology tables or acquiring data via IP Fabric's API is one thing. But another one is to have complete topology map representation of the wireless network in diagrams including surrounding infrastructure and protocols.
The following network diagrams display connected wireless controllers to the core layer 3 device with a focus on some of its detail.
Similarly, we can provide more details with a focus on connected WLAN Access Points and connected users as well.
What makes the platform unique, however, is the end to end path simulation feature that supports wireless clients as well. On the left side of the screenshot is the user with IP address 192.168.101.102 that is trying to communicate with 10.66.124.112. The simulation is built based on routing & switching logic and data collected from all devices that participate. All individual layers or technologies are represented by the legend on the right.
In short, wireless networks have become a stable part of any complex network infrastructure. Any tool that goes beyond the standard management systems' capacity and has low or close to none administrative overhead should be welcomed.
To sum up, all features that have been demonstrated in this article are fully automated. Starting with discovery, data collection, topology maps, or end-to-end path simulation. Is it worth testing? Definitely! 🙂
If you have found this article helpful, please follow our company’s LinkedIn or Blog, where there will be more content emerging. Furthermore, if you would like to test our platform to evaluate how it can assist you in managing your network more effectively, please let us know through www.ipfabric.io.