PCI Compliance is evolving. The payment card industry will see a new update to PCI DSS (Payment Card Industry Data Security Standard) enforced at the end of this month, with version 4.0 of the industry-wide regulations being applied from March 31st, 2024. We've shared how network assurance can assist in the PCI compliance processes before:

We've discussed the 12 requirements PCI DSS compliance before, but as a quick overview, this regulation requires all businesses that process payment card data must adhere to the following:
From March 31st, these requirements become stricter in the interest of treating data security as a continuous business activity, with more frequent testing, strengthened security, and streamlined compliance reporting. Additionally, more flexibility has also been introduced, with the acknowledgment and support of alternate methods of securing payment data, as long as security objectives are reached.
The full list of over 50 adjustments can be read in the PCI Council's Summary of Changes.
Key themes emerging from the buzz around developing PCI DSS compliance standards are proactively taking measures to prevent, detect, and resolve security incidences, and continuous assessment is part of this proactive spirit.
The PCI Security Standards Council states that "doing the work" for PCI Compliance means documenting everything and avoiding recurring cycles of short-term compliance in favor of continuous practices.
When it comes to your IT network estate, automated assurance can help provide this continuous understanding of your end-to-end network state by automating your security audits, or providing daily network analysis reports for the teams that need them. Comprehensive and accurate historical understanding and documentation of your entire complex network estate will be part of a successful PCI-compliant organization.
For more detail on how IP Fabric can help, read our prior 4-part series on PCI compliance for your network linked above.
Want to try IP Fabric right now? Here's a self-guided, free online demo to see what automated network assurance is all about.
For tech purchasing teams who are ready to embrace a robust network tooling ecosystem, ensuring you pick right - that is - get real value from your tools, and quickly - is step one. Whether it's driving innovation through network automation or actualizing a successful intent-based networking strategy, one thing is clear: the unique DNA of every network dictates a unique set of network tools, influenced by the company’s strategic objectives, operational constraints, and available resources.
That said, there are some core criteria you can use as a compass.
Many teams find themselves ensnared in common, yet avoidable pitfalls: sprawling toolsets that offer little return on investment, glaring functionality gaps, and restrictive vendor lock-in, or even process lock-in, where tools are dictating how you operate your network.
In this post, we’ll share four critical ways to evaluate network tools to steer clear of these traps. That's not to say every tool you need will be able to fulfill these criteria perfectly and you can't wait around for every platform or tool to be perfect; but when it comes to decision time, these criteria can help you keep the future front of mind.

Remember, a network that's secure, observable, and agile doesn't just happen. It's underpinned by strategy, enabled by a carefully selected ecosystem of tools ensuring that no functionality gap goes unfilled. Here's how to pick network tools that don't just promise, but deliver tangible value.
In IT networking, the integration of different tools can make or break the flow of operations. An open approach, where network vendors encourage and support integration and make the necessary data readily available, can inform your network operations strategy as it determines how effectively your team can share and act upon network data. When selecting tools, consider the spectrum of integration methods available.
Open and robust API programmability sits at the forefront of this spectrum, offering a future-proof solution that allows for dynamic responses to evolving network demands. An API-first tool can seamlessly share data across various platforms, enabling automation and fostering innovation within your network infrastructure.
Blog Post: IP Fabric API Programmability - Part 1 - The Basics
On the other hand, pre-built integrations can indicate a vendor's foresight and readiness to integrate with the broader ecosystem of tools you employ. These integrations can be a testament to the vendor's commitment to user-friendliness and their understanding of the network management landscape. They save time and resources, providing out-of-the-box connectivity that can accelerate deployment and facilitate immediate operational efficiency. Maybe the tooling vendor you're eyeing up doesn't have every pre-built solution today, but how do they talk about their plans for this - do they regularly collaborate with others in the space, and actively put forth impactful partnerships where they know customers will benefit?
However, there will be instances where neither API programmability nor pre-built solutions meet the unique needs of your network. This is where self-built, for-purpose integrations come into play. While they represent a tailored fit to your specific requirements, they also come with considerations of maintenance and long-term viability. It's crucial to weigh the benefits of custom-built integrations against the potential for creating future bottlenecks or legacy issues that could turn a creative solution into a hindrance.
The goal is always to enhance capabilities without compromising on adaptability and growth.
For a modern enterprise network, diversity is the norm, with a mix of vendors, domains, and technologies - all essential to meet comprehensive business needs. This complexity necessitates network tools capable of managing the entire network ecosystem, beyond the limitations of vendor-specific or domain-restricted solutions. Relying on tools confined to single vendors or network segments can fragment your network management visibility - and therefore, strategy.
To circumvent the pitfalls of vendor lock-in and ensure transparency across network domains, it's prudent to invest in tools that embrace a vendor-neutral stance and aim to support all network domains. Such tools offer the flexibility, completeness, and extensibility needed to truly future-proof your network, fostering an environment that's prepared for the technologies of tomorrow.
The aim is true end-to-end control of your network.
Related Blog Post: A Holistic Approach to Network Discovery
When selecting network management tools, it's crucial to opt for solutions that do what they promise without becoming a burden on resources. From deployment to ongoing maintenance, if your team is spending hours getting a platform to produce the results you need, and growing frustrated in the process, then the juice is not worth the squeeze.
That said, it's not only about the effort you have to put in today; what about future strategy? Will this tool support your processes should it pivot?
As demands on the network shift and grow, you’ll likely be using a combination of legacy processes and tools as well as adopting newer strategies, like NetDevOps and CI/CD pipeline-based approaches to network management.
Flexibility is key; as network demands evolve, tools should adapt, avoiding process lock-in. The goal is to choose tools that serve as a seamless extension of your data infrastructure, allowing your team to remain agile and effective, not tethered to restrictive tooling.
Of course, when you’re purchasing a tool, you want it to fulfill a particular function. Some tools are only ever going to be one thing, and that’s okay if you feel you’re getting the promised value. For other tools, however, a bit of creative foresight can reveal endless potential and become a really exciting prospect of value that compounds. These tools – if selected carefully – can become your heroes, your Swiss Army Knives of enterprise networking that are beloved by not just you, but throughout an organization.
Generally, there are tools that 1) Do not create more data silos but are built to democratize access to valuable data. 2) Encourage and assist with creative use of that network data.
Download: IP Fabric's Baseline - Operate - Innovate Framework
All to say, while all network tools should fix an immediate problem, the BEST tools also lay fertile groundwork for future innovation.
Before getting into the details, there are a few necessary background details that need to be understood.
NetBox is the leading solution for modeling and documenting modern networks. By combining the traditional disciplines of IP address management (IPAM) and datacenter infrastructure management (DCIM) with powerful APIs and extensions, NetBox provides the ideal "source of truth" to power network automation. Read on to discover why thousands of organizations worldwide put NetBox at the heart of their infrastructure.
See: https://docs.netbox.dev/en/stable/
Secondly, what is a NetBox plugin?
Plugins are packaged Django apps that can be installed alongside NetBox to provide custom functionality not present in the core application. Plugins can introduce their own models and views, but cannot interfere with existing components. A NetBox user may opt to install plugins provided by the community or build his or her own.
See: https://docs.netbox.dev/en/stable/plugins/
Network documentation and the use of tools like IP Fabric and NetBox are essential components of successful automation initiatives. Properly documenting the network provides invaluable visibility, allowing network administrators to understand device configurations and connections, troubleshoot issues, plan upgrades, and enhance security. Moreover, tools like IP Fabric and NetBox offer structured data that automation scripts rely on, enabling tasks such as configuration management, provisioning, and optimization. This combination of documentation and automation not only reduces manual errors but also accelerates processes, ultimately leading to more efficient and reliable network management.
Many of our valued customers have embraced NetBox as a tool for holding source-of-truth information on their journey towards network automation. What sets IP Fabric apart is its ability to gather an extensive array of network data, making it a perfect companion to NetBox. There are two primary scenarios where synchronizing data from IP Fabric into NetBox proves invaluable. The first scenario is when customers are starting fresh with a NetBox deployment. They're new to the tool and want to enrich it with comprehensive information from their network, which IP Fabric readily provides. The second scenario arises when customers already have an established NetBox instance. In this case, they seek to validate its accuracy against the real network through IP Fabric.
In line with our commitment to enhancing our user experience, we're thrilled to introduce the IP Fabric NetBox Plugin. This innovative plugin is designed to streamline and simplify the process of synchronizing vital network information from IP Fabric directly into NetBox, ensuring that your NetBox instance remains up-to-date and reflective of your actual network infrastructure.
We've made the plugin documentation readily accessible through our public documentation, please see this for installation instructions. With this plugin, users can seamlessly synchronize the following NetBox models:
The NetBox Plugin allows for the configuration of multiple instances of IP Fabric as sources within NetBox. This functionality enables our customers with multiple IP Fabric instances to seamlessly synchronize data, regardless of its source.
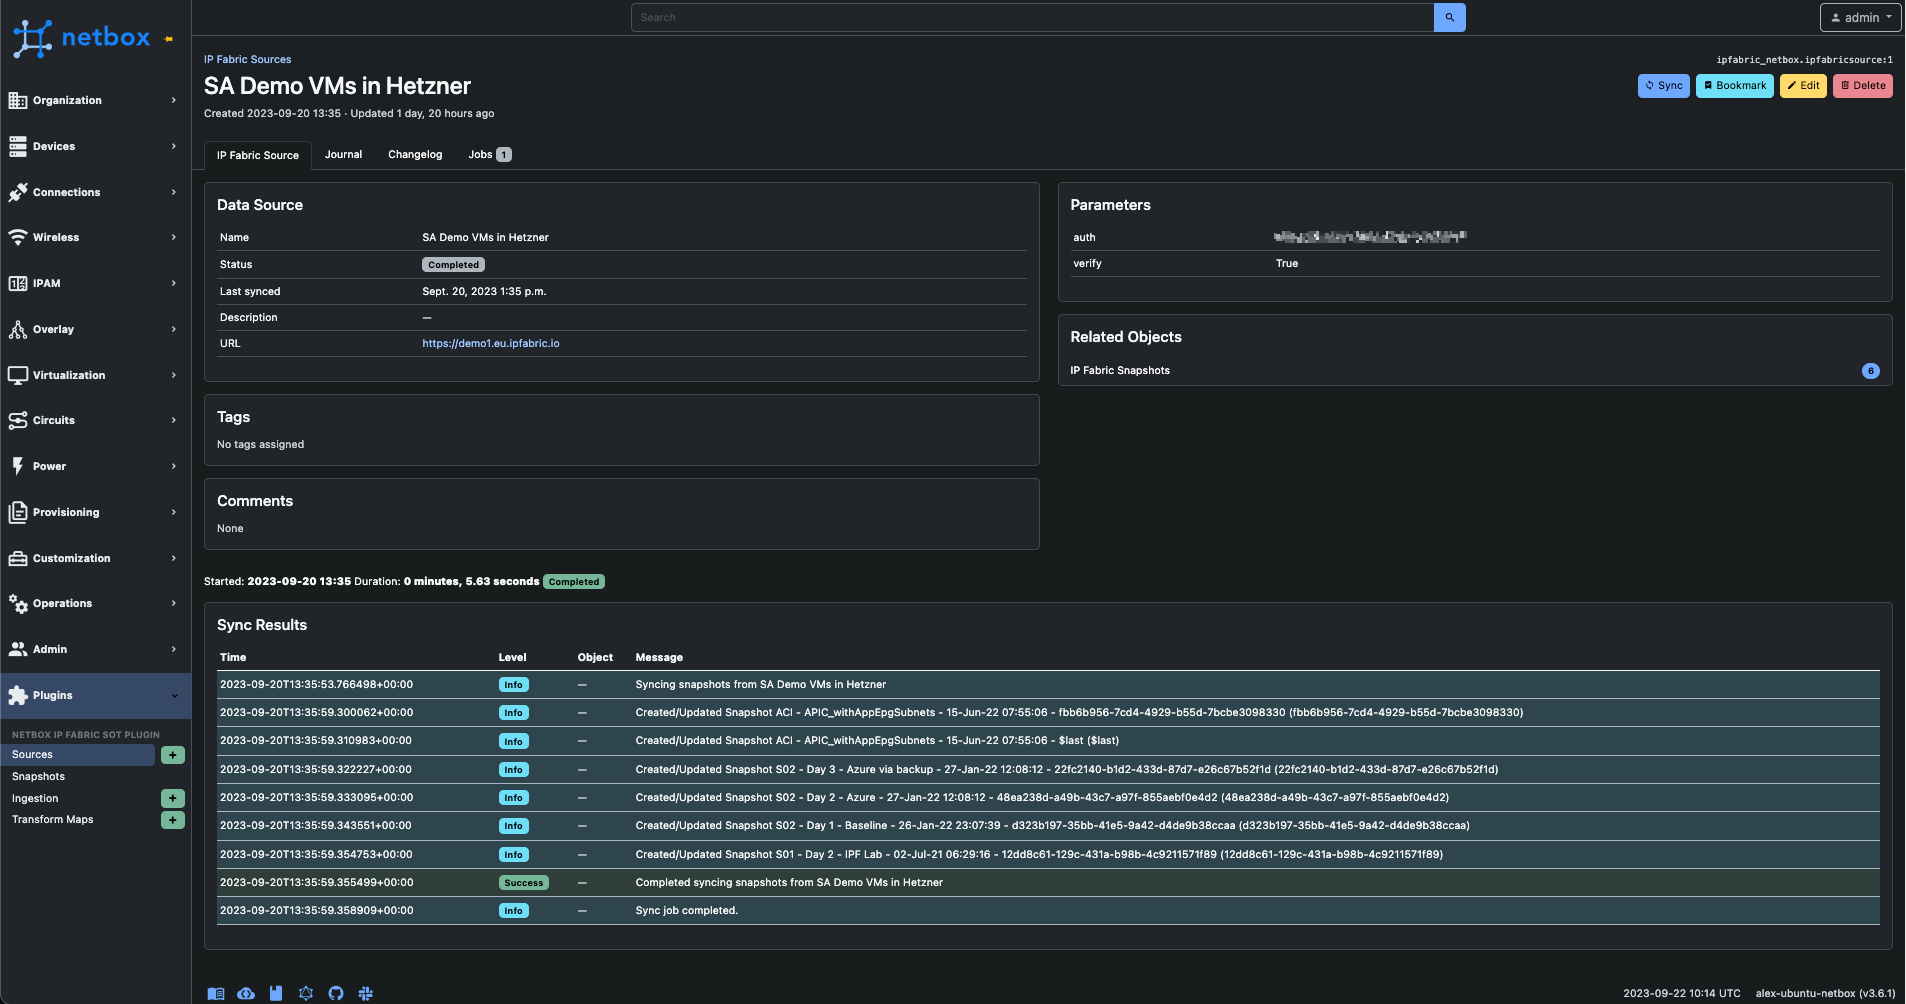
Dividing the process of ingesting snapshot information and network data into two distinct components empowers users to synchronize details about the snapshot IP Fabric, all without the need for real-time connectivity to the IP Fabric API. This approach allows for the seamless presentation of information within NetBox.
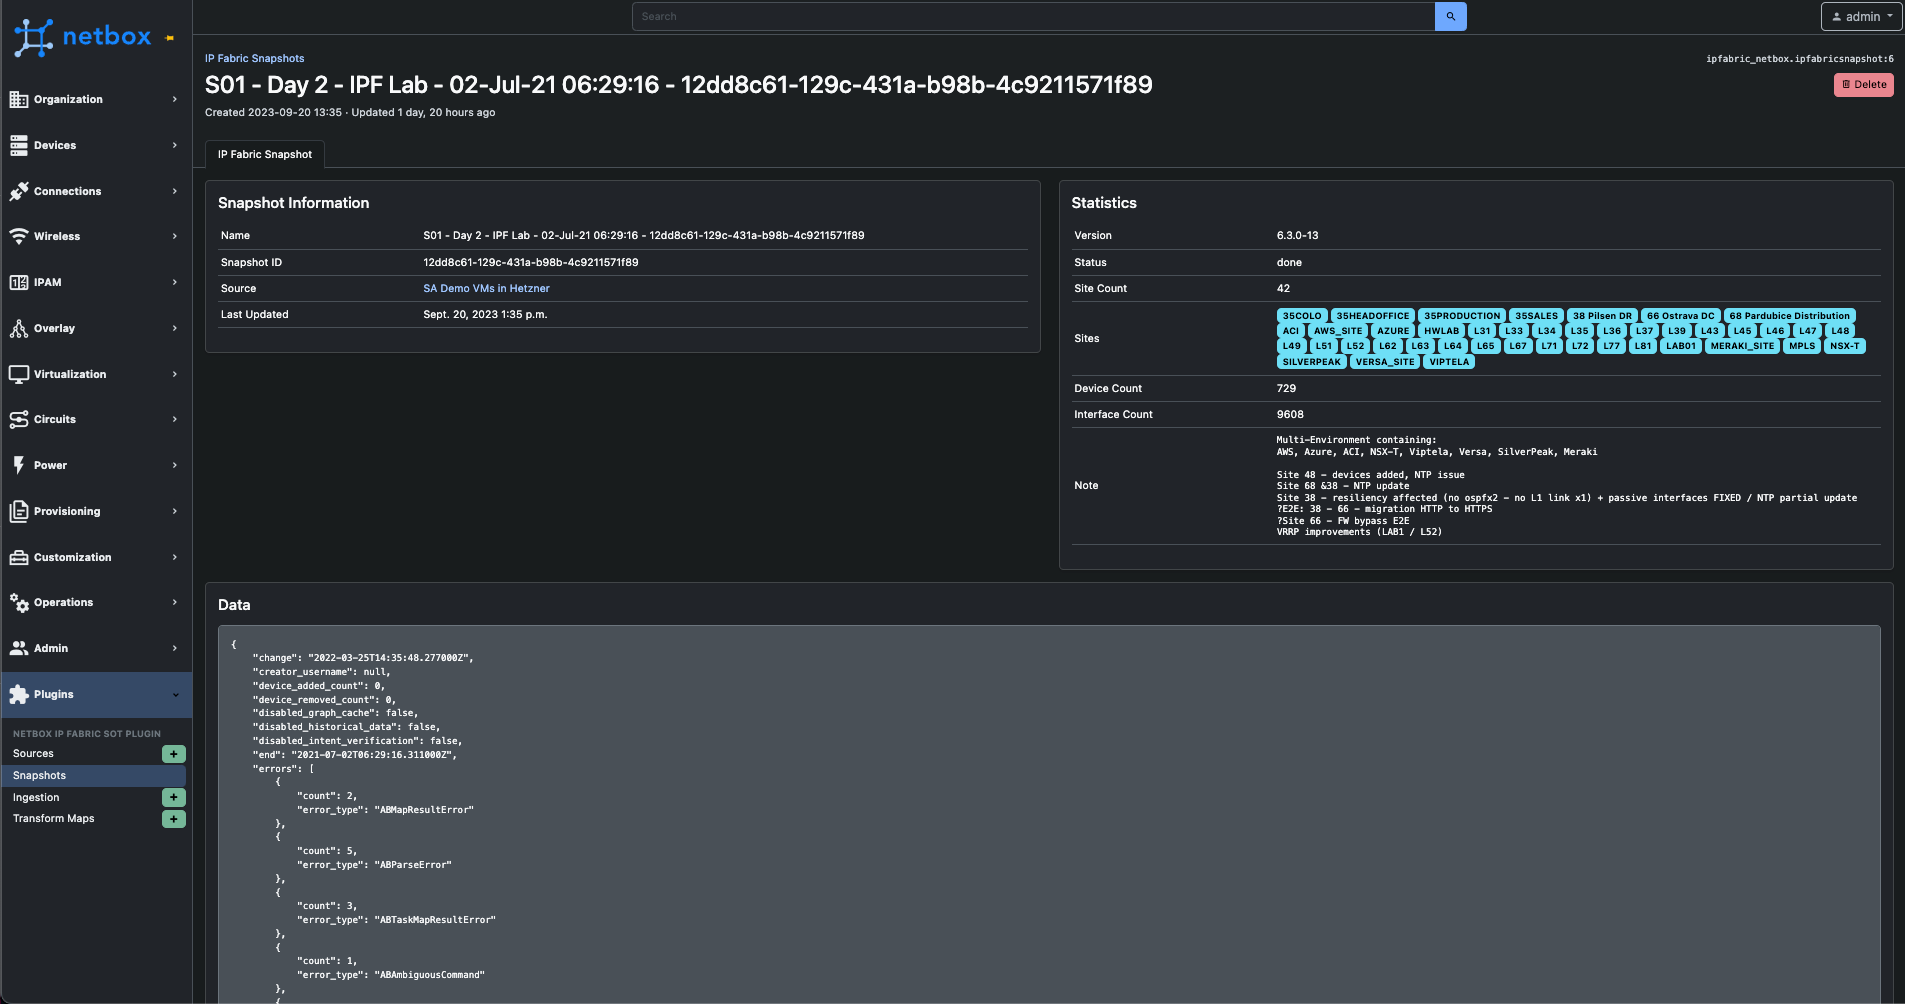
After synchronizing snapshots, an ingestion job can be configured.
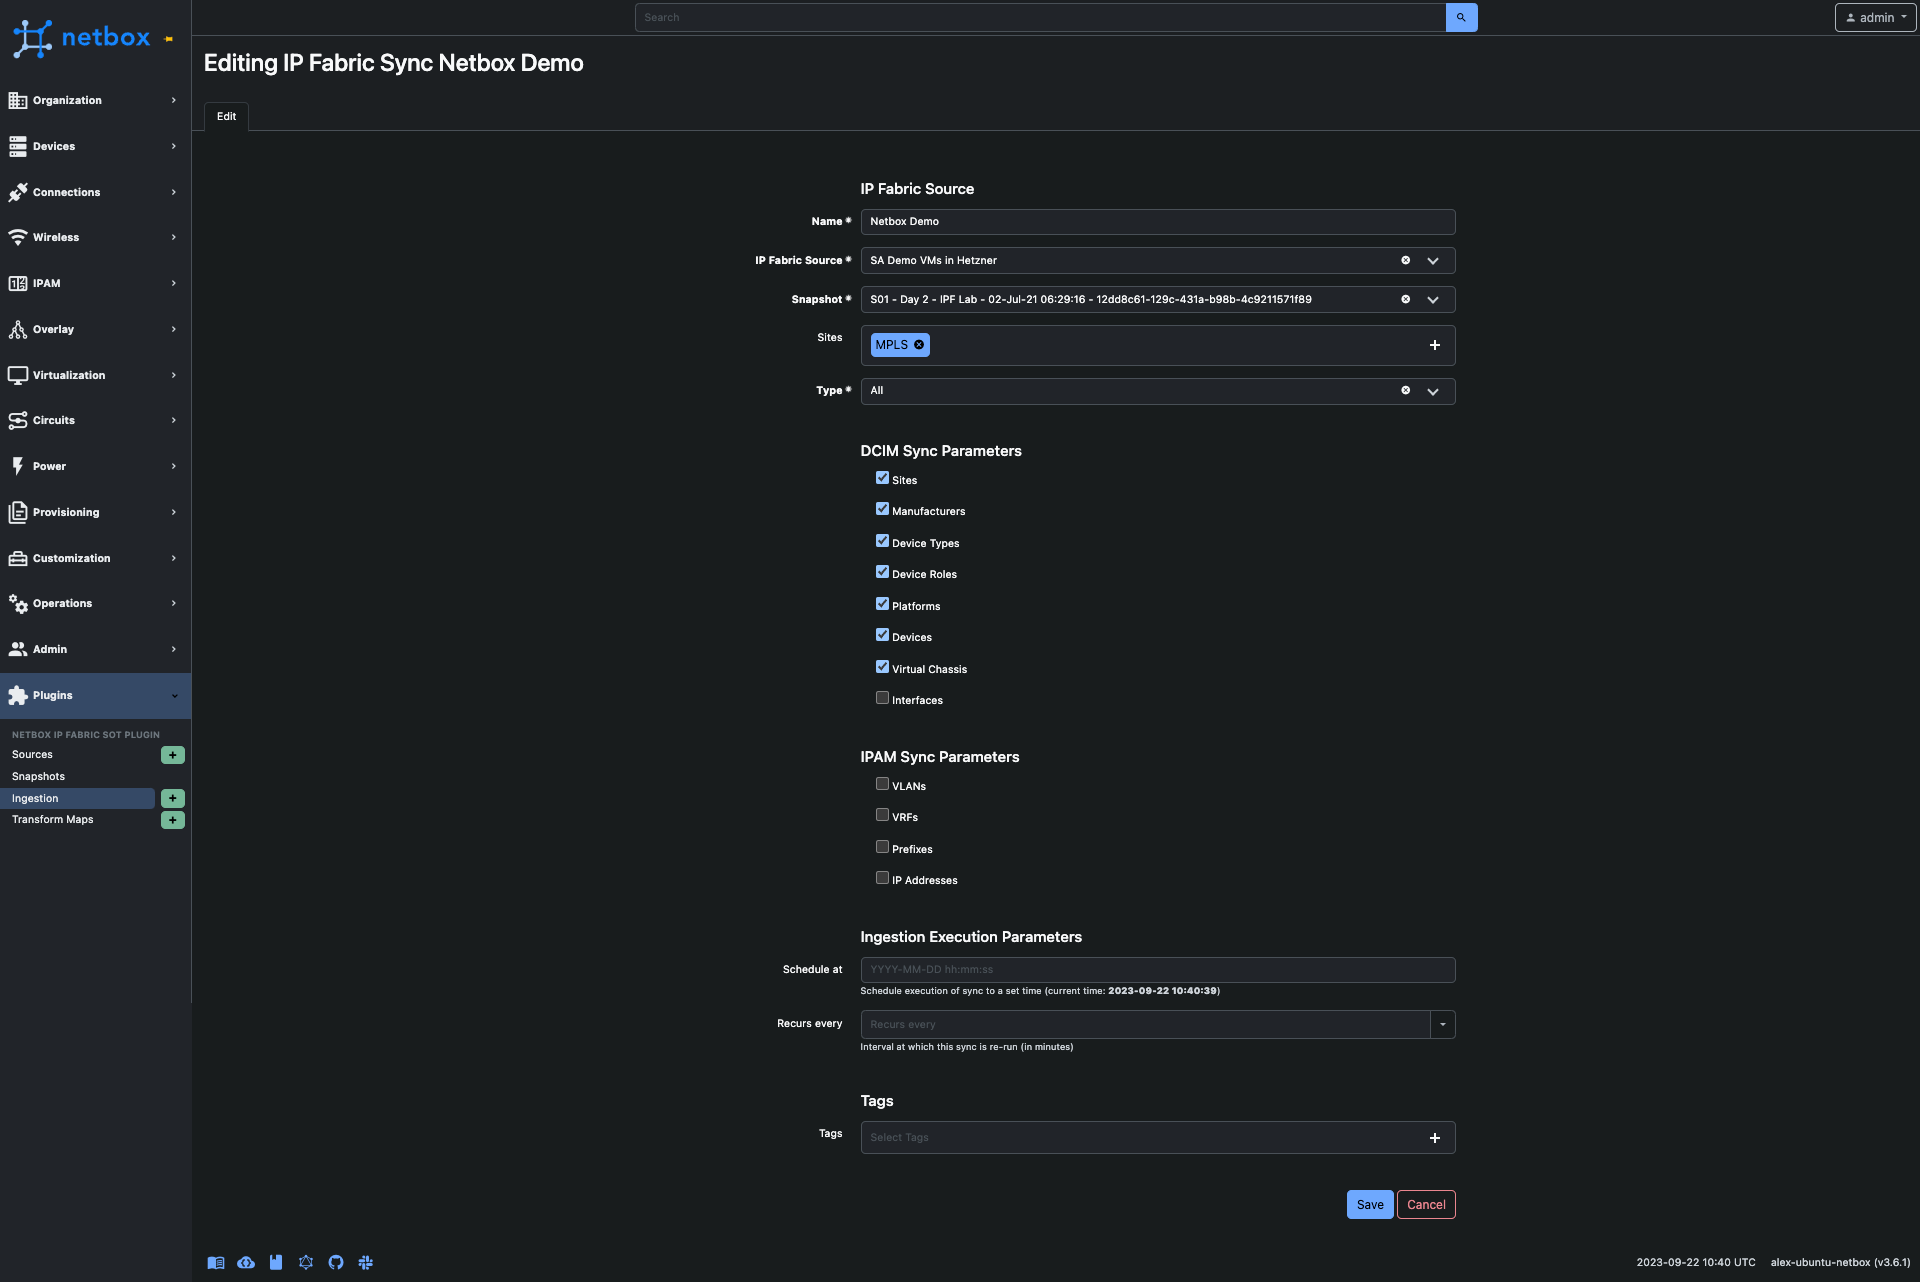
This defines the network information our customers wish to synchronize into NetBox. They can specify the snapshot from which to ingest data, as well as the sites to include. Additionally, customers have the flexibility to choose the models they want to import into NetBox. When selected, the plugin can either update existing models or create new ones in NetBox. When deselected, the plugin will only perform a 'get' operation for the model. Furthermore, customers can schedule these ingestions for future dates or set them to repeat at specific intervals. Any tag associated with an ingestion job will be added to the new models.
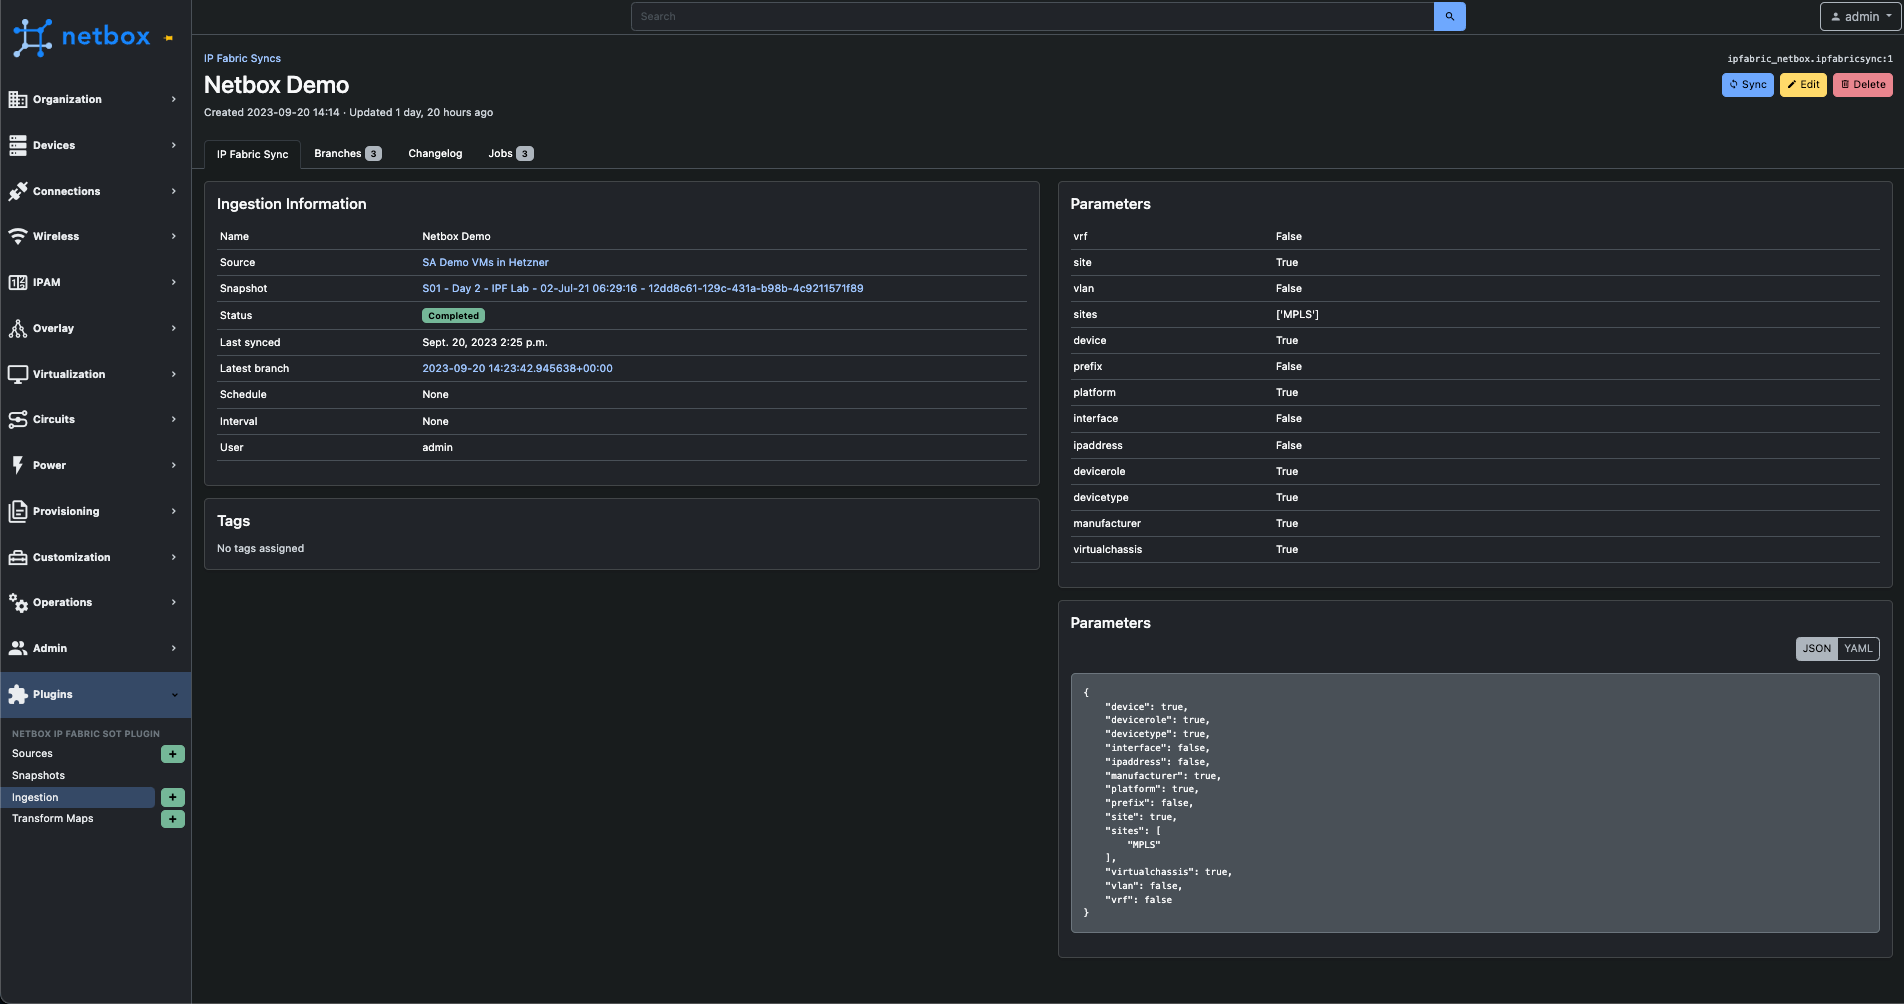
Creating an ingestion job does not imply automatic data synchronization. Instead, the job must be initiated either through a predefined schedule or manually via the 'Sync' button on the ingestion page.
It's important to emphasize that any data ingestion into NetBox does not automatically overwrite existing data. We utilize a feature within NetBox that enables the plugin to propose changes in a branch, akin to how GIT operates. For further details, please refer to the official NetBox documentation.
After initiating a synchronization job, a branch is created where the progress and details of the process can be observed.
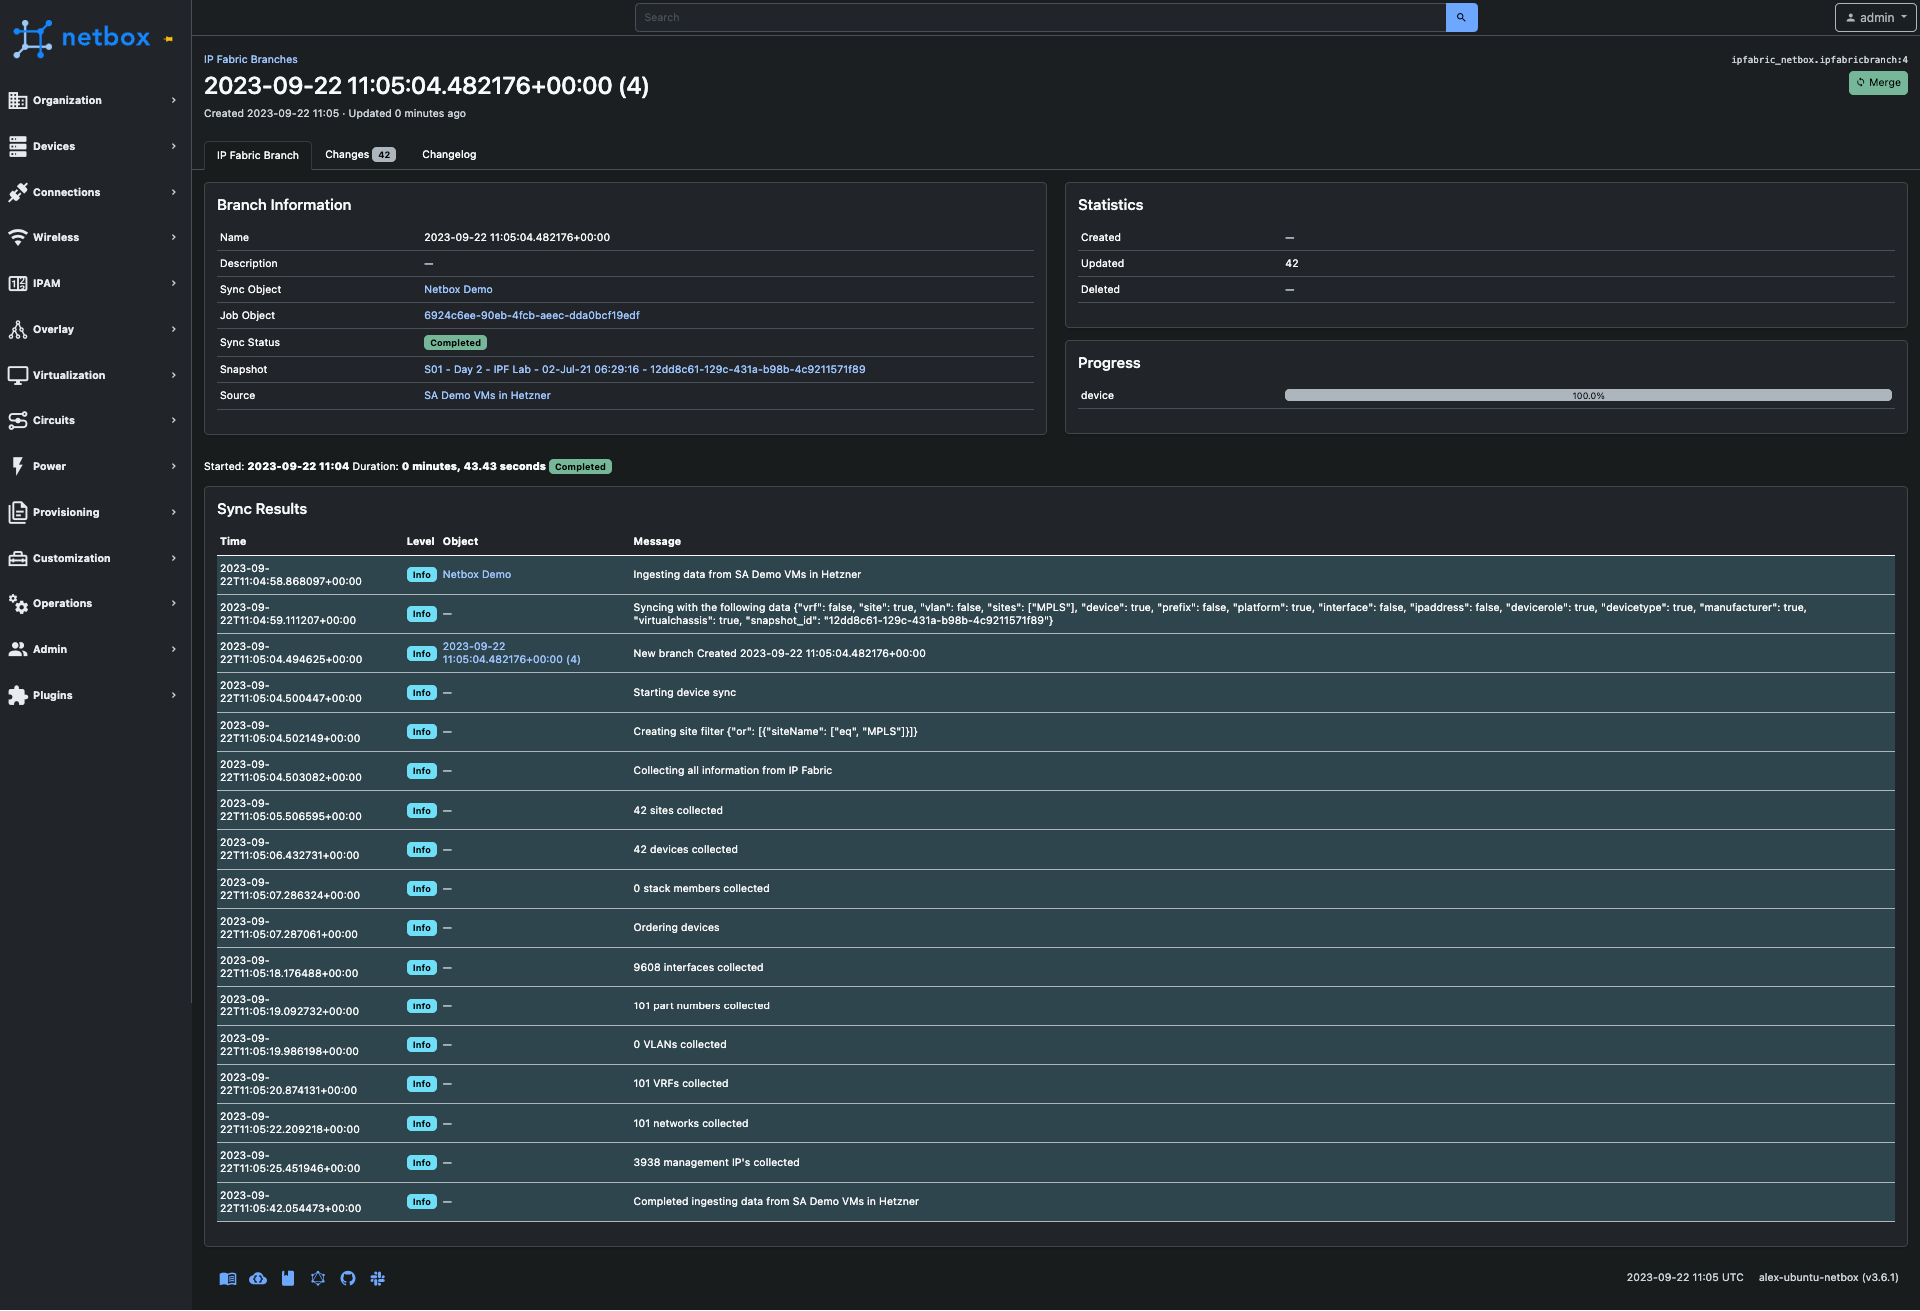
The 'Changes' tab provides information about the modifications that would be applied to the NetBox database if this branch were to be merged.
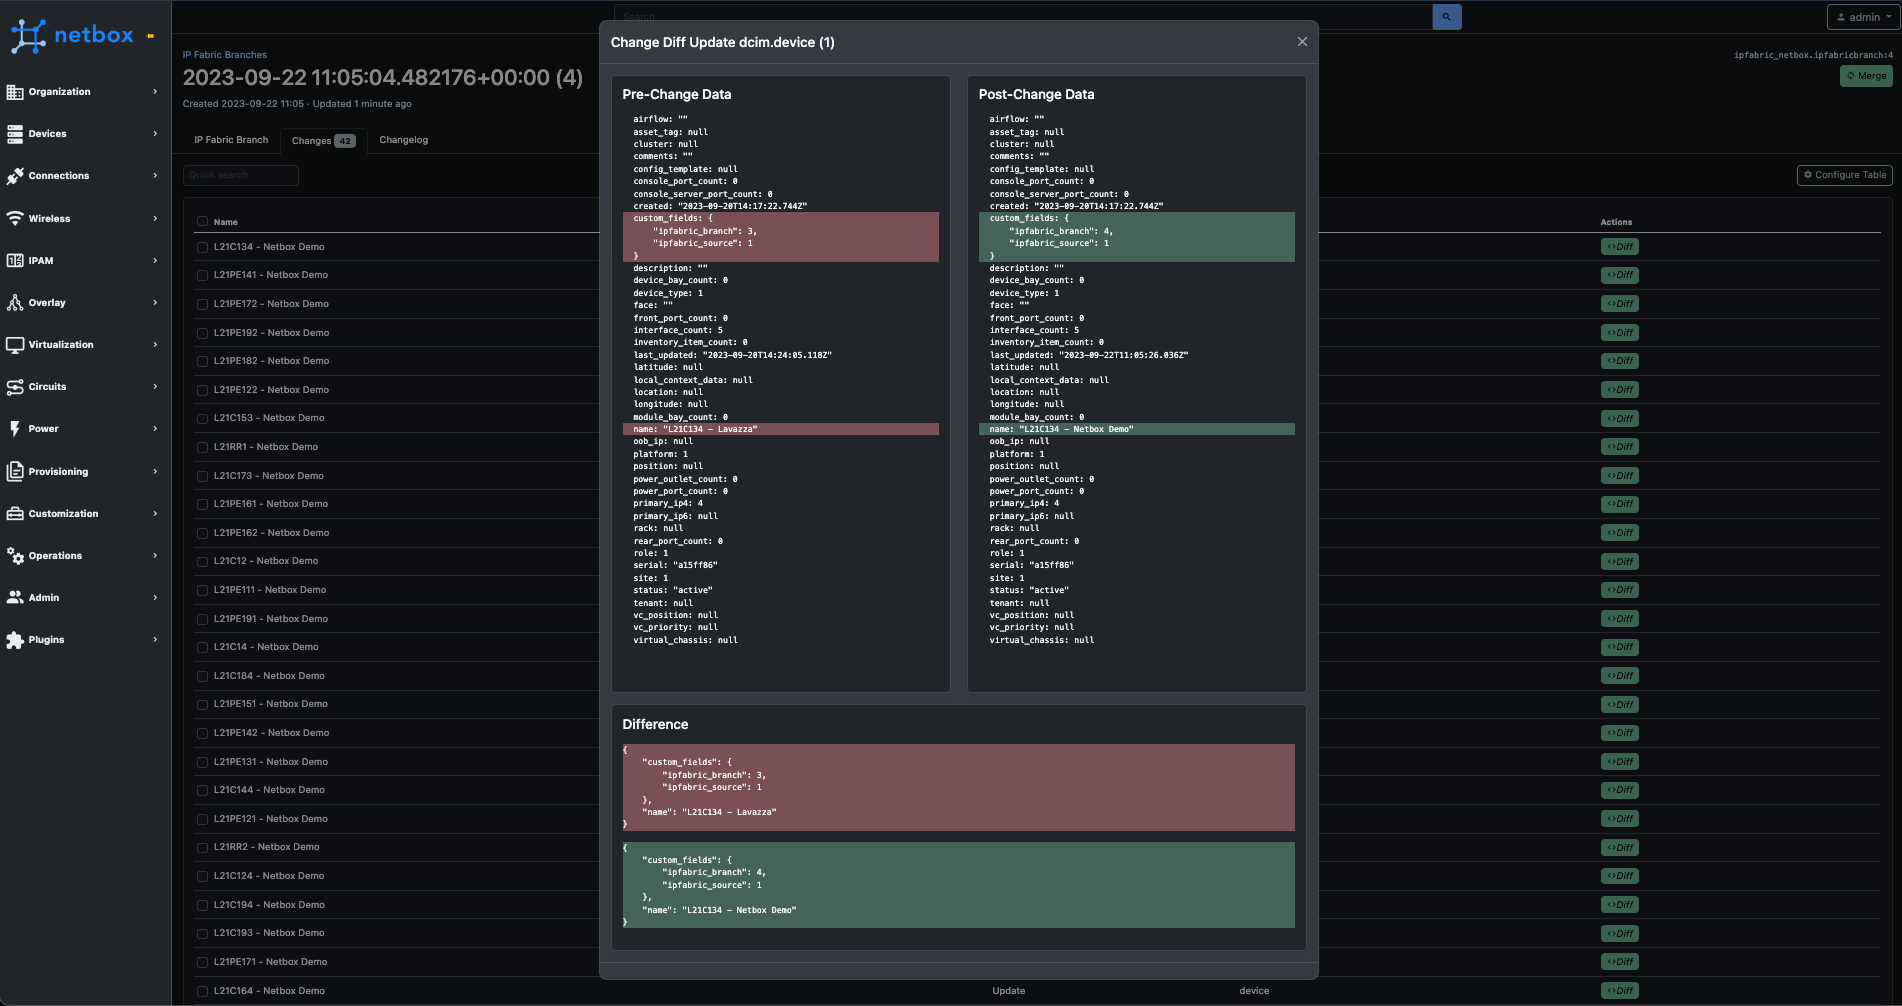
Pretty cool right? I think so. It's important to highlight a key part of the process that makes this work and that is transform maps.
What are transform maps? Transform maps are like a carefully crafted recipe. This recipe serves as a guide, orchestrating the process of extracting data from IP Fabric and delicately depositing it into the appropriate “containers” represented by Django models within NetBox. Its primary objective is to guarantee precise and efficient organization of the data, meticulously tailored to meet your network management requirements. In essence, it acts as a bridge, harmonizing disparate data formats and structures, ensuring a seamless integration of your network data with your NetBox database.
The concept of transform maps is not new; it has been widely employed in various tools for transforming data from one format to another, a practice commonly referred to as ETL (Extract, Transform, Load). This concept draws substantial inspiration from ServiceNow and their implementation of Transform Maps.
During our plugin testing phase with customers, the feedback was overwhelmingly positive. However, a few recurring questions and comments arose, such as, "Can we input data into this specific NetBox field?" or "We don't use NetBox in that manner." These inquiries were primarily linked to the plugin's fixed field structure for various data elements.
The introduction of transform maps proved to be a game-changer. They provided a solution that eliminated the need for custom development for each customer. With transform maps, customers gained the ability to modify our default transform maps to manipulate and designate different data destinations as per their requirements. This newfound flexibility has proven to be a significant advantage, catering to a wider range of customer needs and preferences.
Example with structured data:
The data below is an example of the data used to create a site in Netbox.
{
        "siteName": "Site 1",
        "devicesCount": 173,
        "usersCount": 7075,
        "stpDCount": 10,
        "switchesCount": 165,
        "vlanCount": 113,
        "rDCount": 2,
        "routersCount": 12,
        "networksCount": 77
}
The transform map assumes a crucial role in aligning the IP Fabric site table with NetBox's Site model. This synchronization is achieved through the association of transform fields with the transform map. These fields serve as vital connectors, establishing mappings between keys in the dictionary and specific fields within NetBox's database model.
Each transform field possesses two fundamental attributes: a source field (corresponding to a key in the IP Fabric dictionary) and a target field (representing a NetBox model field). These fields sync harmoniously, making it easy to transfer and map data during the ingestion process.
For situations requiring more intricate transformations, the system offers enhanced flexibility. Users can opt to supply a Jinja template, thereby enabling additional functionalities such as slugifying the name of a site or executing supplementary model lookups. This capability empowers the tailoring of the data transformation process to address specific, advanced requirements as necessary.
The following template would result in the siteName being site-1.
{{ object.siteName | slugify }}For more of a detailed explanation on how transform maps work please see our documentation.
If you're an IP Fabric customer using NetBox and haven't been contacted by your solution architect, we encourage you to reach out and express your interest in exploring the NetBox plugin. Should you encounter any challenges or have questions, please don't hesitate to communicate them either directly to your solution architect team or through Gitlab Issues. Your feedback and engagement are valued, and we're here to assist you in making the most of IP Fabric and the NetBox plugin.
It's quite easy for network professionals to understand the benefits of automating network operations, such as reducing manual errors and saving time, which provides tactical wins that quickly improve day-to-day operations. Yes, there is still distrust of automated processes, but with more discussion around how to properly de-risk and assure network automation (see, Jeremy Schulman's recent NANOG presentation), the switched-on network engineer of today understands the potential of automation and the importance of exploring and implementing it properly. Or at least, should be curious about what automation could do for them and their team and want to try it out in their network environment.
However, frustratingly, convincing leadership to invest in network automation can be challenging. They may be too removed from operations to properly see the business benefits, too risk averse, or stuck in a mindset that begets stagnation. As Itential's Kristen Rachels recently pointed out, the "biggest inhibitors to maximizing the business benefit of automation were not technical, they were cultural and organizational."
Individual-led automation efforts can be risky without proper buy-in, resulting in inefficiencies, errors, security risks, and team conflicts due to incomplete or inconsistent automation processes. Enterprises must prioritize network automation as a strategic business initiative that deserves the necessary resources and attention to ensure success.
And the fun part? If you're the one who understands this need, it’s on your shoulders to convince leadership that this should be a business priority, and not performed in isolated pockets. Advocating for the best solution can be uncomfortable when an organization is comfortable with the old way of solving problems. To overcome this, framing network automation as a business strategy is key. While a network team frustrated by out-of-date or incomplete documentation sounds like your problem, a user-impacting network outage because of a lack of insight into the network is everyone's problem.
One of the most compelling arguments for automation, of course, is its impact on the bottom line. Significantly reducing manual errors and repetitive tasks, and increasing operational efficiency and productivity translates into substantial time and cost savings for your organization. Network engineers can focus on higher-value tasks, while automation takes care of routine operations. Automation prevents enterprises from misusing their most valuable resource - top talent - on repeatable tasks.
Additionally, automation minimizes the risk of human errors that can result in network outages or downtime, which can result in expensive lost revenue and customer dissatisfaction. On the higher end, the cost of downtime can hit $9000 per minute. When presenting a business case for automation to your boss, emphasize the tangible cost savings and increased productivity that automation can bring to your organization.
In today's ever-evolving threat landscape, network security should be a top priority for organizations. Automation can play a pivotal role in enhancing network security. By automating security processes such as patch management, configuration audits, and threat detection, you can ensure consistent security policies across your network and reduce the risk of human error. Automation also enables rapid response to security incidents, allowing for quicker detection and remediation of security threats. With automated security processes in place, you can strengthen your network's defenses and reduce the risk of security breaches, which can have severe financial, reputational, and legal consequences for your organization. Highlight how automation can bolster your organization's security posture when making a business case for automation to your boss.
Network assurance is a key part of this, and anyone looking into methods of automating their network security should take note of how network assurance can help prevent cybercrime.

Business is fast-paced, and organizations need networks that are agile and scalable to keep up with changing requirements. Automation can help achieve this agility and scalability. By automating network provisioning, configuration management, and deployment of new services, you can accelerate network changes and ensure consistency across your network infrastructure. This allows your organization to respond quickly to changing business needs, such as adding new branches, deploying new applications, or scaling up network capacity.
Automation also enables network engineers to test and validate changes in a controlled environment, reducing the risk of network disruptions. Emphasize the importance of agility and scalability in the modern business landscape and how automation can enable your organization to stay ahead of the competition when presenting a business case for automation to your boss.
S&P Global saw the value of this when faced with a huge merger - here, Guruprasad Ramamoorthy, Global Head of Network Architecture, Engineering, and Operations, explains how automated network diagramming and modeling helped: "We were able to quickly model the behavior that we needed to build a day 1 experience for our employees across companies working on a large and complex merger."
The bottom line
Reduce labor costs associated with firewall management by enabling engineers to work on more strategic tasks. Streamline the change management process, reducing the need for costly downtime during firewall rule updates which can result in increased productivity and revenue generation.
The secure edge
Minimize the risk of human errors resulting in misconfigurations or security vulnerabilities. Ensures the consistent enforcement of rules. Enables rapid response to emerging threats (e.g. malicious IP addresses or suspicious traffic patterns).
The agile future
When new network services are provisioned, firewall rules can be applied consistently and rapidly, regardless of environment (on-prem, cloud) or location.
The bottom line
Network engineers are highly skilled individuals who don’t generally enjoy the tedious task of updating network documentation. Their skills could be better used on strategic tasks.
New team members can understand the network quickly and bring value faster.
The secure edge
Manually updating documentation opens up an organization to a higher rate of human error and continuously out-of-date documentation. This can be dangerous when decisions need to be made quickly; teams relying on incorrect documentation may inadvertently introduce vulnerabilities into the network.
The agile future
In order to grow, or pivot a network management strategy, knowledge of the network must be accurate and easily shared. New team members need up-to-date and accurate documentation to ramp up confidently. A fully documented network makes mergers, acquisitions, migrations, and additions far simpler.
The bottom line
Key metrics like fault isolation time and Mean Time to Resolution will be lowered.
Not only does this mean less likelihood of expensive outages, but also more time for strategic tasks.
The secure edge
Incidents compromising security are solved faster. Fewer vulnerabilities in the first place thanks to consistency in security policy applications and automated updates.
The agile future
Proactive troubleshooting also means fewer network outages and more predictable business continuity as your organization grows and changes.
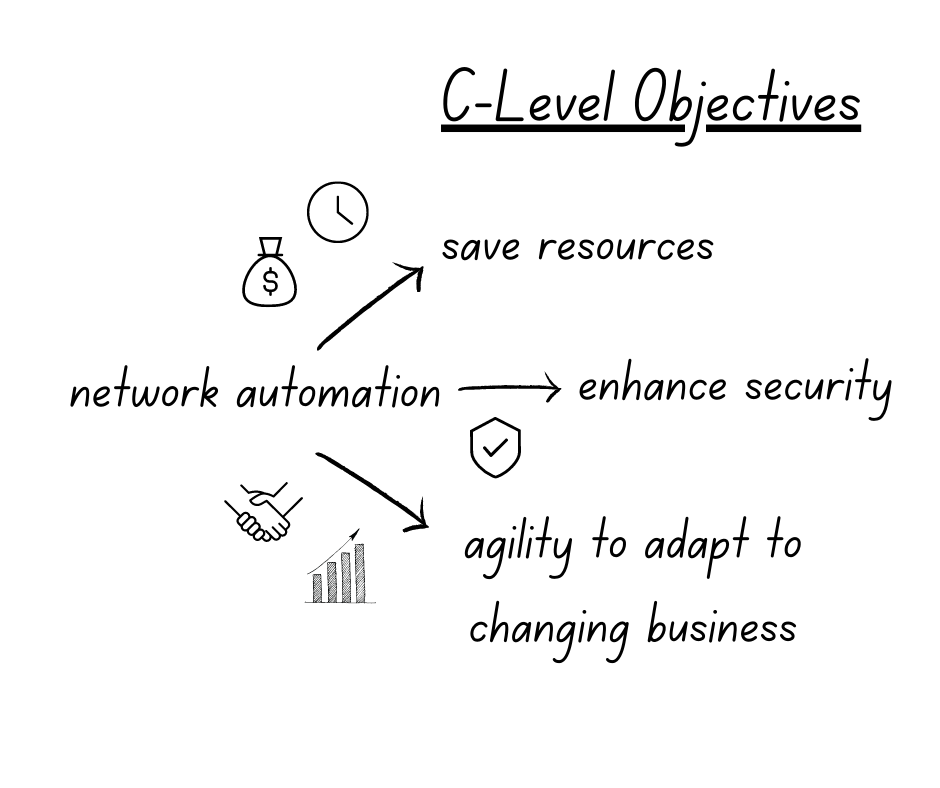
These are just simple examples to demonstrate how, through keeping (1) budget, (2) security, and (3) agility top of mind, you can succinctly create a compelling case for some simple automation wins that can help change the mindset of slow adopters.
An automated network assurance platform is key in providing the confidence that automation is having the desired effect. Want to try IP Fabric? Here's our free, self-guided demo. Or you can reach out to us to schedule a free tailored demo for a personalized look at network assurance to solve your specific challenges.
For all the tools and tricks the 2023 network engineer has up their sleeve, the modern enterprise meets them with a new challenge. Some are brand-new problems introduced by new technologies, and some are classic struggles exacerbated by the relentless pace of enterprise operations and innovation. Both mean constantly increasing demands on the network that underpins the success of your business. And of course, pressure on the network means pressure on network engineers, who must balance these business demands with a network that is secure, resilient, and agile.
The result is a living ecosystem, and just like a dense rainforest where the flap of a butterfly's wings might mean tomorrow's thunderstorm, your network is continuously subject to ever-changing influences and pressures. As these pressures stack up, so do the expectations that the network operates smoothly at all times - the network is, after all, business-critical. The network engineer of 2023 is something like a nature guide, protecting, learning, and guiding users through the network safely; anticipating changes and mitigating threats; maintaining balance for a successful circle of life.

In understanding how to navigate this on an organizational level – with the right tools, the right data shared between teams, and adherence to a stated network intent – we must trace how business demands translate to technical network complexity.
Only then can we ensure that the David Attenboroughs, Steve Irwins, and Eliza Thornberrys of enterprise networking have the tools they need to meet the challenge (ahem - pick your fighter!).
In our globalized economy, enterprises today are typically distributed, spanning multiple locations and supporting more devices, applications, and unpredictable users than ever before.
Different locations or business units may have different policies and regulations (bring-your-own-device, IoT, remote work) and the network team must account for all of it.
Enterprises are readying for this in general, with a recent survey revealing that with regard to “supporting a digital-ready workplace and hybrid work environment, 84% of all firms said they would invest in “future of work” initiatives.”
However, they may not yet understand just how central the network will be to their success here, as networking and associate infrastructures are ranked as low spending priorities.
It is essential that enterprises understand how investing in their network infrastructure will affect their business from every angle, including top priorities like cybersecurity.
Highly large, distributed networks mean the following for the engineers who manage them:
*IP Fabric helped solve this issue for Dr. Max - see how we did it.

Whatever platform or services an end user engages with, today they expect the same connectivity as if they were plugged into the wall on location. SaaS applications, hybrid IT environments, remote accessibility – the expectation is seamless and continuous connectivity. Managing this interconnectivity on an enterprise scale is not easy.
72% of organizations treat home offices as corporate endpoints that require network visibility and management using centralized enterprise solutions. (Enterprise Strategy Group, April 2023)
As more industries employ technology that relies on the network to function, meeting these connectivity expectations is not only a business initiative but essential for the provision of critical services like healthcare, education, and financial services for all.
This continuous network availability means that engineering teams need:
We’ve already mentioned Cloud connectivity, but the growing prevalence of cloud, hybrid, or multi-cloud networks also introduces a knowledge and skills gap in enterprises that increases complexity. Smooth team collaboration is essential for enterprises to operate at pace, and these gaps require a normalized, end-to-end understanding of the network for engineering teams regardless of the environment.
IDC predicts that “By 2025, to ensure data and workflow integrations spanning distributed clouds and edge environments, 50% of enterprises will deploy multi-cloud networking.”
For teams to navigate the modern multidomain network successfully, they need:
A single-vendor shop is becoming more of a rarity as enterprises have more options to kit out their network with specialized tooling. Though this spreads some risk and allows for more specific tool selection, it does add complexity to network management, with vendor-specific knowledge required to manage, maintain, and troubleshoot the network.
Recent EMA research cited four main pain points for multivendor SD-WANs: consistent security, skills gaps, costs, and poor cloud access. All of this stems from vendor variation in how network devices are operated and behave.
To have a useful network baseline, this heterogenous data:
With this in place, teams can successfully navigate or even mitigate the aforementioned pain points.
The growing number and sophistication of cybersecurity threats loom over enterprises, making cybersecurity a top priority. Securing the network involves deploying firewalls (from different vendors, next-generation firewalls), intrusion detection and prevention systems, encryption mechanisms, authentication protocols, and more.
Managing both internal security policies and ensuring compliance with industry regulations makes securing the enterprise network a complicated game and with all the previously mentioned moving parts, not a game that ever really ends.
To effectively secure a modern enterprise network, you need:
So, with all of these stated needs that are starting to seem non-negotiable for networking teams, how does a business provide the tools necessary to keep the network, and therefore business, running smoothly?
Step one is to understand your environment, from end to end. You cannot control what you do not first know; if your network is a rainforest, then network assurance is the GPS, aerial photography, and high-beam headlights all in one. Get exploring with our self-guided demo or reach out for a demo catered to your particular rainforest.
Let's demonstrate how to integrate IP Fabric directly with Grafana using an Infinity Datasource and creating a Dashboard to visualize the data. This is easily accomplished with the template file located on GitLab and provides your teams a single pane of glass to monitor your network without having to navigate to another website. Following these instructions or those located in the GitLab repo will have you up and running in approximately 5 minutes, so let's get started!


In the top left we see three variables that can be set to change the dashboard data:
IP Fabric Instance: Used for customers with two or more deployments (this can be disabled for customers with a single deployment which is documented below).Snapshot: Provides a way to switch between the loaded snapshots to update the dashboard's data.
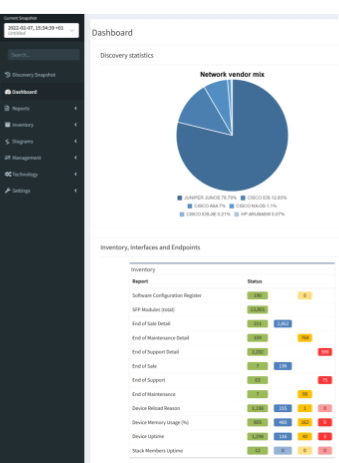
The next section provides an overview of the number of licensed and unlicensed devices discovered in the snapshot and the Device Inventory table (limited to 5,000 devices).
hostname: Filtered hyperlink to the Inventory > Devices table.loginIp: Link to directly SSH to the device (see Telment/SSH URL Handler On MS Windows 7 And Later).version: Hyperlink to Inventory > OS Version Consistency filtered on the platform and version.
The IP Fabric Dashboard is a mirrored copy of what is seen in the GUI. This also contains links back to IP Fabric tables. Clicking the URL in the Name column will take you to the unfiltered table, however the links in the Green, Blue, Amber, and Red columns will filter that table based on the color you selected.
Also included are tooltips on all the hyperlinks with the description configured in IP Fabric.
Pro Tip: When creating new intent verification rules or editing the defaults, be sure to add or update the descriptions on each color to ensure your users understand what the rule is signifying. This is seen in the below picture where the highlighted green box has a descriptive message to convey the green color's purpose whereas the red box is used to describe the entire intent check.


Finally included in this template are some examples of creating custom visualizations for data your team may want to more closely monitor. These are created using table filters in the GUI and utilizing the API Description to copy those rules into Grafana. To speed up loading of the dashboard, the query is limited to return a single row of data and the value displayed is derived from the returning _meta.count field in the JSON response.
It is not recommended to display tables of data in Grafana due to the current paging limitation. Requesting large amounts of data from IP Fabric using the API without paging can degrade performance for all users.
In this section, we will set up the Infinity data source(s) for connection to the IP Fabric instance which the dashboard will use to pull the data.
In Grafana, navigate using the right hand menu to Connections > Add new connection, search for "Infinity", and select it to create the new connection.

Authentication and select API Key.
Key is required to be set to X-API-Token.Value is the API token you created in the IP Fabric GUI.Allowed hosts with https:// prepending it and pressing Add (i.e. https://demo1.eu.ipfabric.io).Save & test button at the bottom of the page.Cache tab to speed up queries and Dashboard loading.TLS/SSL & Network Settings there is an option to skip TLS verification if your IP Fabric instance does not have a trusted certificate installed.This Dashboard template has been developed to support multiple IP Fabric instances and if this applies to your environment simply create a new data source following these instructions for each of your IP Fabric FQDN(s).
Now that the connection to IP Fabric has been established we can import the Dashboard. This is done by going to the Grafana Dashboards page selecting New and Import. You will need to access the grafana_model.json file from GitLab and either upload the file or copy/paste the contents in the Import via panel json.
After selecting the Load option you have the ability to change the default Dashboard Name from and the folder it will be located under prior to importing.
Once loaded it should take you to the new IP Fabric Dashboard however there is one configuration change to ensure that the dashboard selects the correct data source. Because this template was built to support multiple IP Fabric instances it is required to filter the list of Infinity data sources that are configured across the entire Grafana environment.
Dashboard settings.Variables menu select the instance variable to edit it.Show on dashboard value to Nothing which will disable the drop down to select different servers which is not needed.Instance name filter regex.
/^FQDN$/ (i.e. /^demo1.us.ipfabric.io$/)./^demo1....ipfabric.io$/ or /^demo1.us.ipfabric.io$|^demo1.eu.ipfabric.io$/).Apply.Save dashboard and Close at the top right of the page to return to the Dashboard to verify data is loaded.Also included is a query to fetch the IP Fabric apiVersion for use in all the queries the Dashboard may request. This should ensure stability after upgrading your deployment(s) to a newer version however it is always recommended to check the Release Notes for any breaking changes that may occur between versions.
A fix has been added to resolve an issue after upgrading to IP Fabric 6.3.x on August 10th, 2023. If you imported the Dashboard prior to the fix and have issues with hyperlinks after upgrading please follow the migration documentation on GitLab.
In summary using this IP Fabric Integration template can maximize your teams network monitoring visibility into your already preferred dashboard application Grafana. This template is meant to be a jumping point to provide examples of how to interact with IP Fabric using Grafana and can be further customized to your team's needs.
If you have any questions, ideas for new functionality, or need assistance with installation or configuration please reach out to your Solution Architect for assistance. I hope you found this an exciting new way to extend the capabilities of your IP Fabric deployment!
If this post has piqued your interest, and you'd like to see the integration in action, please check out #TechFabric 7 - Integrating IP Fabric with Grafana Webinar on LinkedIn!
Want to see IP Fabric in action for yourself? Try our free, self-guided demo here.
Prefer the personal touch? Reach out to us to schedule a free demo, zero obligations required!
It’s clear we’re not putting the Artificial Intelligence toothpaste back in the tube. The last year has only seen an acceleration of AI concepts and experiments becoming applicable to enterprise workflows. If it’s improving outcomes and profitability, why not push forward, right? Uh… right? Well, this is not the place to argue for that philosophy and its potential realities. However, we can certainly speak on the complexity that AI/ML driven process adds to the network that underpins these applications and services. Network automation, artificial intelligence...with every amazing step forward, a new thread of complexity to weave into the fabric of enterprise networking. Somewhere, right now, a network engineer is grappling with the additional demands these processes place on an already massively complex system. Let's explore what's making their day more difficult.
Note: Most of the challenges discussed here apply across industries, but it’s helpful to frame these issues practically, hence the industry-based lens. Understanding the problem in its true context is the first step toward finding solutions.
We’ll start with where improving outcomes is most personal - our health. Hospitals, clinics, and other medical facilities have been jolted into embracing technologies they were more conservative about pre-pandemic. The strain on healthcare systems and growing patient needs and expectations spurred this embracing of technology-based solutions to medical problems.

Democratizing care access via more and better telehealth services, automated patient imaging and diagnostics, remote patient monitoring, robot-assisted surgery, automated drug administration, patient record updates… it’s clear that done right, these initiatives can take pressure off historically overworked doctors, nurses, radiologists, and technicians and improve healthcare outcomes. “Done right” is key, I’m sure you’ll argue, when you’re the one attached to an IV and a computer is selecting your medication and dosage.
So, what lies beneath these health-tech marvels? Here are just three points to consider:
Our frameworks for learning are fundamentally changing with the mainstream use of AI technologies. It can start with simply automating repetitive tasks – grading, scheduling, planning - to free up time for educators. However, it also transforms the way students learn and what they learn. AI can create personalized learning paths and curriculums based on student preference or ability, speed up tailored feedback, and use historical data to track progress and determine knowledge and skills gaps more accurately. Generating educational content has become faster thanks to AI, and access to education has improved with AI-powered translation. Chatbots available 24/7 means students can ask questions whenever they need to, and get valuable answers.

What does this mean for network engineers managing networks for universities, schools, and Edutech companies?
Though somewhat stymied by heavy regulation, Finance/Fintech enterprises have long sought to harness the power of AI to wade through data and make better predictions, optimize processes, improve customer experience, and enhance services.
There is a global move toward mobile-first banking, and it's key that banks rise to the occasion in terms of customer experience; AI can personalize and enhance these experiences with chatbots, customized product recommendations, and improvements based on customer analytics. AI is also used for better fraud detection and prevention, alerting teams to anomalies in transaction patterns quickly, and ultimately protecting the business.

So, what do these wonderful advancements mean for teams operating the IT networks that allow these financial institutions to run?
Artificial intelligence and machine learning are too powerful to leave any industry completely untouched. In just these three examples, the emerging patterns are clear. Enterprises need to understand the impact of AI/ML on their IT networks; the business-critical backbone of their operation. If we expect engineering teams to maintain resilience and performance to support the future-focused enterprise, they need tooling that is up to the challenge.
AI with network assurance as a measure to continuously validate network state is a tool network teams can use to meet this challenge. To see how IP Fabric can offer end-to-end enterprise network visibility without making your life more complicated, try a self-guided demo today or request a tailored demo from our team.
Investment by One Peak, Senovo, and Presto Ventures will advance the ubiquity of network assurance, helping organizations to reduce network complexity, assure network automation, and improve network security
NEW YORK, 29th JUNE 2023 – IP Fabric, the market leader in automated network assurance, today announced that it has closed a $25m Series B funding round led by One Peak with the participation of Senovo and Presto Ventures. This will fuel IP Fabric’s mission of making network assurance ubiquitous so that people, businesses, and governments can operate without the exponential risk of network failures or outages.
IP Fabric is a pioneer in network assurance, helping organizations to overcome network complexity, assure network automation, and improve network security. Network assurance is becoming critical for managing private network infrastructure which combined globally is vastly larger than the Internet and forms the backbone of the modern economy. This infrastructure is now the foundation for every part of modern life, from our airports and factories to public utilities and financial systems.
However, rising complexity is making it much harder for humans to understand and manage networks. This makes network automation risky – automation without assurance will lead to unpredictability if organizations cannot see whether automation has had the intended effect, and that it hasn’t negatively impacted the rest of the network. Rising complexity also makes it impossible for organizations to identify and eliminate network vulnerabilities, creating multiple blind spots for attackers to potentially exploit. These challenges have created a perfect storm that is putting network resilience at risk.
“Without network assurance, we are leaving network resilience to chance,” comments Pavel Bykov, CEO, IP Fabric. “We've seen how network outages can cause businesses and critical infrastructure to grind to a halt, but amidst rising complexity and the need to ensure control in the face of rising cyber threats while adhering to regulatory compliance, enterprises lack the means to assure operations for their entire network end-to-end. IP Fabric delivers the network assurance needed to operate without the exponential risk of network failure or outages while enabling innovation through standardized access to network control data. Organizations must act now because building operational control without a validated baseline provided by network assurance will lead to gaps and unknown unknowns which ultimately cause outages and security incidents that impact people, businesses, critical infrastructure, and governments.”

IP Fabric is an API-first platform that rapidly discovers, models and visualizes complex networks down to the wire, giving end-to-end visibility and control over an organizations’ entire network infrastructure. IP Fabric was recognized as a Gartner Cool Vendor in Network Automation and came 8th in the Deloitte Technology Fast 50 with a CAGR of 160% over the past 4 years. Today, IP Fabric works with over a hundred enterprise customers globally, including Air France, Major League Baseball, Red Hat, HCL Technologies, Avast and Blackberry.
“Enterprise networks are becoming increasingly complex, which makes the requirement to discover, model and visualize large networks a priority,” comments Humbert de Liedekerke, Co-founder and Managing Partner of One Peak. This is especially important, when, as Gartner has reported, only 26% of network leaders maintain accurate network data, massively hindering the effectiveness of automation initiatives for 74% of enterprises. Automation must be assured, secure and able to operate effectively in complex network environments. Enterprises can’t risk automating in the dark – networks are too important for guesswork that could expose vulnerabilities or cause outages. This is why IP Fabric’s unique ability to help enterprises understand, automate, and secure complex networks is so critical to enable the future of network automation.”
Prior seed and Series A investment rounds were conducted with Senovo, Presto Ventures, and Credo Ventures.
IP Fabric is a powerful Intent-Based Networking technology enabling modern enterprise network operations. A vendor-neutral, API-first automated network assurance platform, IP Fabric discovers, verifies, visualizes, and documents large-scale networks holistically, reducing costs and resources while improving security and efficiency. Ensure smooth migration and transformation projects while simplifying network planning, testing, and troubleshooting. Eliminate business-impacting inefficiencies and continuously verify policy compliance with a standardized, consumable view of your multi-domain network, end to end. Accelerate and refine programmability, automation, and network analytics with accessible, accurate, and contextualized network data at your fingertips. IP Fabric helps organizations including Air France, Major League Baseball, Red Hat, HCL Technologies, Avast, and Blackberry overcome complexity, implement effective network automation, and improve network security. For more information, visit www.ipfabric.io
One Peak is a leading growth equity firm investing in technology companies in the scale-up phase. One Peak provides growth capital, operating expertise, and access to its extensive network to exceptional entrepreneurs, with a view to help transform innovative and rapidly growing businesses into lasting, category-defining leaders. In addition to IP Fabric, One Peak's investments include Ardoq, Cymulate, Deepki, DocPlanner, Keepit, Lucca, Neo4j, Orgvue, Pandadoc, Spryker, and many more. To learn more, visit www.onepeak.tech
Senovo is an early-stage venture capital firm based in Munich and Berlin that partners with exceptional founders building global B2B SaaS category leaders from Europe. As a European first-mover, the fund invests since 2013 into a new generation of B2B software startups that enable the digitalization of medium and large enterprises. Their focus is primarily on supporting teams working in the areas of process optimization, industry 4.0 and data-enabled solutions. Senovo joins the journey after a company has first revenues in a late Seed or Series A round. Their team of SaaS specialists seek meaningful eye-level relationships and regularly publish their learnings and thought leadership at www.medium.com/senovovc. For more information, visit: www.senovo.vc
Presto Ventures is a Prague-based investment firm focused on early-stage B2B software startups and online marketplaces led by founders from the CEE region. With over 50 portfolio companies and counting, Presto Ventures stands out as one of the region's most dynamic venture capital firms. In 2022 alone, they successfully closed 24 new deals. Backed by entrepreneurs, family offices, and exited startup founders, Presto serves as a vital link that connects the flourishing CEE tech ecosystem with major Western markets. Besides IP Fabric, Presto's notable investments include Cloudtalk, Ready Player Me, Woltair, Oddin, Sharry, Yieldigo, Omofox, Inventoro, Finmap, Okredo, and Zypl.ai. For more information, visit: www.prestoventures.com
So, you may know why network observability is becoming increasingly important for enterprises, but what could it look like within a large enterprise toolscape?
Could it be one tool, or is it a strategic combination? How are these tools integrated, and what could enhance an effective network observability practice? While the exact answer will differ across organizations, what's certain is that no matter what your observability platform looks like, it will benefit from automated network assurance data.
Whether you're trying to move beyond monitoring, or you already have a more mature observability practice in place, assurance is the final puzzle piece that injects trust and validation into network operations.

What you need to know in order to have a successful observability practice may seem subjective - but there are some elements that we posit are non-negotiable, with the knowledge of how central the network is to the success of modern enterprises.
A primary cornerstone of observability should be an understanding of the actual, observed, true state of the network, at a particular point in time. This knowledge is vital for observability, as you cannot continuously observe what you don't know exists.
Proper discovery, inventory-taking, and collection of device state data, as well as mapping this out in topologies and visualizing the data, is almost impossible to achieve manually in dynamic enterprise networks, as the result would continuously be out of date.
Regular snapshots of the network give operators a means for comparison from one point in time to another, a way to answer "what's in my network" and "what's changed?"
We've mentioned before that observability is less about the network on a device level (we can leave that for monitoring) and far more about the end user. With this front of mind, easy access to how an application behaves through your network from endpoint to endpoint is invaluable.
Without end-to-end visibility, troubleshooting requires network teams to spend valuable time on repetitive tasks, while said issue could be affecting the end user.
With this in place, teams can act proactively, lowering mean time to resolution thanks to an observable network.
Read: End-to-end path simulation with API
To easily leverage network data in a useful manner for observability, it must be normalized across vendors and environments and made consumable in technology tables, or rich and flexible network models.
It's not uncommon for teams to find a way to access the network data they need but then be stuck on how to actually get value out of the data. Should they invest the time to interpret the network data they have? How can they effectively use it for reporting? Can other teams, beyond the networking team, understand it easily?
Too much undigestible data could in fact hamper your observability, muddying the view of the network with unwanted information. For this reason, any assurance solution providing network data must prioritize flexibility if it is to be useful for observability; allowing the user to choose what they see, a simple and intuitive GUI, and clear presentation of this wealth of data are all imperative.
Automated network assurance provides this network inventory, configuration, and state information, visualized and normalized across vendors and environments, via simple API integration.
Contextualized data that is normally either very difficult or impossible to gather from traditional monitoring systems, such as the end-to-end path of a packet through your network, is automatically mapped and modeled. It's ready to be used wherever you need it most (and by whichever team needs it most!).

IP Fabric's integration ecosystem has already established some pairings that elevate network observability efforts.
Use insights from IP Fabric to make monitoring more contextualized and useful for your team. Avoid alert fatigue by focusing on what's important to your teams. IP Fabric can easily provide the PRTG monitoring platform with network topology analyses for a more comprehensive view of the network.
Download: Paessler PRTG Solution Brief
Splunk is a versatile tool that helps put network data into action; IP Fabric can bolster its usefulness by providing actual network state data easily via API.
Read: How to integrate IP Fabric with Splunk
Another monitoring and assurance match made in heaven, Centreon and IP Fabric work together to take advantage of IP Fabric's advanced discovery process to ensure all the information you could possibly need is being monitored, and nothing can be overlooked.
See Documentation: IP Fabric and Centreon or Read Centreon's Blog Post: Integrating Network Assurance and IT Infrastructure Monitoring for stronger networks
It's clear that whatever your observability strategy, whether still relying on traditional monitoring or already moving toward a more mature implementation, it needs network assurance to answer to those blind spots, and give you confidence through continuous validation of your actual network state.
The world of network automation is far from immune to buzzwords designed to lure you in with promises of the perfect solution to your network woes.
Some are very appropriate metaphors or powerful terms that effectively crystallize the offerings or services that would seem otherwise abstract. Others are all frosting and no cupcake. Often, these dazzling terms are presented as the function of an offered tool or service, rather than what they are – a goal, or ideal, that tools can help you get closer toward.
Let’s dig into the meaning behind the marketing – what are industry voices saying, and does it line up with what they deliver? Is it a buzzword, or is it brilliant – or both? Here’s our take.
Data democratization refers to making network data, or information about your network, freely accessible to anyone in an organization who might need it beyond just the team working directly with the network (e.g., security teams, cloud teams, C-suite). The benefits include reduction of bottlenecks in workflows through self-service processes, enabling asynchronous work, harmony across teams, and reduced MTTR.
We use this term proudly at IP Fabric – not only because alliteration is irresistible, but because it succinctly sums up the above-mentioned benefits without overstating what the concept refers to practically.

The ambition of a digital twin – that is, an exact virtual replica of your network you can use to simulate and test changes – is sound, in that having a true digital twin would be extremely useful. Real-time updating of this network representation to reflect your actual network state should mean it’s always accurate and behaving as your real-life network does. However, we know that reality is not so.
The issue here is not with the concept – if you can find a true digital twin, sign us up - but the term is often confidently applied to products and platforms that are not a digital twin at all. Generously, some may be a digital cousin, in the sense they share some DNA with your network but fundamentally, they won’t behave exactly the same under the same conditions (which is the whole point).
That’s what the term implies, right? You would expect a digital twin of your network to be a precise DNA match.
It's not really a digital twin if:
Claiming that a digital twin provides end-to-end security posture visibility creates a risk for network operators who believe that they are working with a true digital twin. They may be making decisions based on ultimately useless simulations that can lead to unintended consequences in the actual network.
A so-called digital twin is great when used as a tool for guidance – remember that real-world conditions can always introduce variables that your digital twin can’t account for. Nothing substitutes the insights of the actual network engineer, whose job can be made a lot easier with a digital twin. Their knowledge and observations are hugely augmented by tooling, but not always replaced.
Our network model, which achieves similar goals – test changes, see how data flows through your network – but is proudly of its own DNA; its point-in-time representation of your network normalizes output from different vendors to supply a flexible, sharable understanding of your network behavior. Assurance then ensures that you know exactly what your actual network state is.
This refers to decisions about - and changes to - the network being led by intent, or a defined set of business objectives that represent how you desire your network to operate.
By starting with intent, usually stored in a Source of Truth repository, like the open-source Netbox, and having every network operation be in service of aligning with that intent in an automated fashion, you are ever closer to having your actual network state match your dream network state.
Intent-based networking is largely attractive to enterprises because it can help manage the complexity inherent in a modern, dynamic network.

Anyone in the network automation space has likely seen this term a thousand times over – maybe the first few times, it elicited a vision of utopia – everything you could ever need to operate your network visible in one place. The ultimate consolidation of important information.
After the 999th time, however, it’s clear with so many products and platforms claiming to offer this, they can’t all be the single pane of glass that your organization needs.
If they were, you would only ever have one place to go to do anything in the network infrastructure:
Additionally, it would have to serve a myriad of different lenses that operators approach the network with – cloud teams, security teams, and leadership. The single pane of glass is an ideal to strive for, not a silver bullet that you can buy.
Platforms claiming that they are “it”, rather than showing how they can accelerate you toward this goal.
Tools that gather data from disparate places and present it in a single, consumable form, in an accessible manner, help move the needle toward a unified network view for all teams; as mentioned, it’s a useful metaphor for a goal to work toward.

A Single Source of Truth – that all teams can trust - is touted as a key element of network automation projects, especially so for intent-based networking.
By nature, IBN requires that you express a single, consistent intent against which you build, test, and validate your network state.
Your source of truth is the ultimate repository of your network desires that are determined by clear business goals, which your actual network state should be continuously validated against.
When any one tool claims to contain the entirety of your intent. Expecting enterprises with dynamically growing networks to contain their entire intent in a single system is unrealistic. That said, there are tools that consolidate the information from these systems – your sources of truth – to make them useful, consistent, and updated for network automation projects.
IP Fabric does the same for your actual network state so that you can validate it against your source of truth.
You likely have, as mentioned above, many sources of truth containing information about elements of your network.
A single source of truth can be a helpful data cleansing element to consolidate these repositories managed by different teams and smooth out duplicates, inconsistencies, and interdependencies to ensure that your “sources of truth” are as accurate and valid as possible.
WATCH: For the Journey 2: From Design to Source of Truth with Network to Code & BlueCat
In an industry that is constantly innovating, buzzwords ebb and flow in the zeitgeist. We’re certainly not above overusing some of our favorites to describe our offerings concisely and concretely when applicable – as discussed, buzzwords can be brilliant, if used honestly.
However, overuse can muddy the waters with regard to how these terms are applied. Before your eyes light up at the next promise to solve all your problems, tactically assess – is it a buzzword or brilliant (or both)?


