Companies are spending big money on defensive measures against the outside attackers — investing into Next-Generation Firewalls, Intrusion Prevention Systems and Proxies. The inner network, however, was considered safe place, where nothing bad can happen.
This understanding has thankfully changed in recent years, especially with rise of mobility technologies allowing employees to work anywhere and concepts like Bring Your Own Device (and some major incidents as well, of course). Today's network administrator has to think about various types of devices connecting to the internal network and policy, how to treat them to keep the internal network and business critical systems safe.
Solution to this problem is to deploy network wide 802.1 x protocol, that allows the user to access the network just if he is able to authenticate himself using a username and password, or a valid certificate issued by the company. Various options are available and listing all the details would be worth a book.
It is not always straightforward deployment, as these types of projects tend to be slow and need proper user testing, because otherwise the users won't be able to work at all. Usually there are user machine issues that need to be rectified temporarily by disabling the 802.1 x protocol authentication on the switchport of the affected user and after couple days, no one knows, where the security is applied and where it is not.
With IP Fabric's platform, finding information about the ports secured by 802.1 x protocol is easy, and you can specify verification to tell you which network edge ports, connecting to end stations, are open and which are secured properly. For example, simple verification could do this:
Setup is actually trivial, with the most complicated part being the selection of what is physical and what is virtual interface. Good news is, that we've configured this already for you. The actual outcome of this verification looks like this:

Instead of manually verifying every interface or developing custom script for every platform out there, hundreds of hours of engineering time can be saved using this continuous verification instead. Also, it can be used as an evidence of how the 802.1 x protocol rollout project is proceeding and that the network is properly secured and there are no open interfaces, that would render your network insecure.
This will ensure the setup of the Interfaces on all devices in the network. In regards to the other part — RADIUS server configuration — this was covered in one of the recent articles, so you may check it out to create similar specific rules that will configure IP Fabric to verify your specific AAA needs consistently in a matter of seconds.
If you’re interested in learning more about how IP Fabric’s platform can help you with analytics or intended network behavior reporting, contact us through our website, request a demo, follow this blog or sign up for our webinars.
Today, we are pleased to release the new version 2.3.0 of IP Fabric platform. This release assists engineers in having a more complete overview of their network by adding support for additional technologies that are especially seen in Internet Service Provider and enterprise Internet Edge environments — Multiprotocol Label Switching (MPLS), Port Mirroring and Network Address Translation (NAT). We have again improved usability of graphs, that now support site renaming directly in graphs and also support visual separation of site interconnects from the general transit clouds.
Frequent feature request from Internet Service Providers and Enterprise customers as well was Multiprotocol Label Switching (MPLS) support. In this release we are adding full support for Label Distribution Protocol (LDP), where we provide the network operator with detail about configured interfaces and what are the LDP neighbor relations, and we also provide with global network MPLS Forwarding Table that is very similar in function to a global routing table we have already. The MPLS is of course supported in graphs as well.
Network Address Translation is pretty common in the enterprise Internet Edge service block and particularly in ISP networks to “sort out” their IPv4 address exhaustion issue. Today we are releasing support for Network Address Translation rules, to give you full End-to-End visibility and packet behaviour.

To support traffic recording efforts of our clients we are introducing support for port mirroring overview and configuration verification. Regardless if the technology used is Switched Port Analyzer (SPAN), RSPAN (Remote SPAN) or ERSPAN (Encapsulated Remote SPAN), we are supporting the overview tables including all the low level details like ACLs applied to the monitoring session or QoS used for the mirrored traffic.
The graphs are definitely one of the most used functionalities of our product. Many of our clients inquired for the functionality to be able to rename sites in easier way and we are now supporting renaming of site directly in the site diagram.
To get better overview about how the specific sites are interconnected, we are now introducing the separated transits for other sites in the diagrams. This way you will be able to find out what is connected to what much faster than before.
When the graph is opened through the hostname link in any table, it will zoom automatically to that specific device.
There are couple vendors out there that are using for their devices Organizationally Unique Identifier (first half of MAC address specific to vendor) that are belonging to other companies. This was causing issues during device discovery as our platform is connecting to well-known vendor OUIs, because we don’t want to log onto everything in the network, but just the network devices. However if you happen to have a device with special OUI portion in its MAC address, this is no longer an issue and you can override the default behaviour and select the MAC addresses, that are relevant to your environment.
We have worked hard on improvements in datacenter portfolio, where we improved support for Cisco Nexus Fabric Extenders (FEX) modules and their environmental parameters. For the memory hungry devices we have added a support for memory consumption overview — this can be used to verify if your network will support further IPv4 BGP routing table growth or it is running already at its' limits.
If you’re interested in learning more about how IP Fabric’s platform can help you with analytics or intended network behavior reporting, contact us through our website, request a demo, follow this blog or sign up for our webinars.
Today, we are delighted to release the new version 2.2.9 of IP Fabric platform. This release assists engineers in having a more complete overview of their network by adding support for additional vendors, such as Arista, HP Aruba, Huawei and F5 loadbalancers. It also provides support for new routing protocol IS-IS and improves End-to-end Path Lookup, which is now more intuitive — we now allow you to save and continuously verify specific path forwarding results, as well as display them on the dashboard.
E2E Path Lookup is one of the most useful features of our platform, allowing you to test and visualize the forwarding of the packet through the network. This will allow you to verify if the traffic is being forwarded as it is intended. Many of you have inquired regarding the possibility to be able to continuously verify specific traffic patterns, such as reachability of the CRM systems from branches. The verification now also extends to verifying if forward and return traffic are symmetric and if the traffic is being flooded somewhere within the network.
In order to receive the detailed information more efficiently regarding End to End path forwarding decision, we have implemented a new tab, which aggregates all the information found during the examining of the specific packet flow.
There are situations when you may wish to only see the edge devices, whether it be for troubleshooting or to see how the WAN works without distractions from the LAN devices and links. Therefore, we are introducing a function that allows for this.
As a committed vendor independent software company, we are always working towards implementing additional support for more widespread networking equipment, so that our software may analyze and verify any network. Therefore, we are providing discovery support for Arista, Hewlett-Packard Aruba, and Huawei networking equipment and loadbalancers from F5.
While we support general routing verifications regardless of the protocol or the route source, with version 2.2.8 we have expanded detailed routing protocol support and added EIGRP and RIP. Today, we are proud to announce that our platform supports all of the most important routing protocols, as we have implemented IS-IS.
Last but not least, based on the feedback that we have received, we have decided to add DNS resolve support for the Discovery Error reports, making it far easier to identify the devices that have not been properly discovered. We are also adding a graphical historical overview of the number of discovered devices.
If you’re interested in learning more about how IP Fabric’s platform can help you with analytics or intended network behavior reporting, contact us through our website, request a demo, follow this blog or sign up for our webinars.
Authentication, Authorization, and Accounting, otherwise known as AAA, or Triple A.
Many individuals who have had to implement AAA on a router or a switch most likely have little knowledge regarding the commands that they copy to the router configuration. Most will simply utilize the AAA configurations from another functioning router or switch. Today, we are going to analyze the best AAA practices and how one can ensure its proper setting with our IP Fabric's platform.
For those who are working with a larger network environment, you are most likely using a form of TACACS+ or ACS server running that is specifically designed for the management of logins to your devices. AAA works in unison with TACACS+ to provide efficient management of your logins’ security. In other words, this monitors who is able to log in (Authentication), what that user can do (Authorization), as well as track the commands that are used (Accounting). In the instance of server failure or reachability issues, it is recommended to have a backup local login user name and password that will allow access to your devices.
We shall now analyze what is considered the best practices for configuration.
aaa new-modeltacacs server ACS1
address ipv4 1.1.1.1
key 0 SECRET-KEY
tacacs server ACS2
address ipv4 2.2.2.2
key 0 SECRET-KEY
aaa group server tacacs+ ACS
server name ACS1
server name ACS2aaa authentication login default group ACS local
aaa authentication enable default group ACS enable
aaa authorization config-commands
aaa authorization exec default group ACS local if-authenticated
aaa authorization commands 1 default group ACS if-authenticated
aaa authorization commands 15 default group ACS local if-authenticated
aaa accounting exec default start-stop group ACS
aaa accounting commands 1 default start-stop group ACS
aaa accounting commands 15 default start-stop group ACS
Upon dissecting this model by line, we have:
This new-model essentially turns on the AAA functionality on the network device.
This addresses the setup of the TACACS server details, such as the IP address, shared key, and all other optional details.
This is intended for the grouping of specific servers into logical groups.
Here, we define how the device is authenticating the users who attempt to log into the device. First, there is the default authentication method with group of TACACS+ servers named “ACS”. Then, if it is unreachable, we shall implement the locally configured user account list.
This component explains that, for enable mode, the default authentication method with group of TACACS+ servers named “ACS” should be utilized.
This is regarding our goal to authorize each command that is being issued to the device.
This sets up the device and places the user directly into enable mode, upon his authentication (the if-authenticated keyword).
In this command, we are authorizing the level 1 user commands, which is similar to the non-enable mode.
Here, we are providing authorization for level 15 users against TACACS+. If TACACS+ is unavailable, then the local user account is used, instead. Upon authentication, the user will immediately be placed into exec/enable mode.
AAA Accounting ensures the logging in and access into the device.
This provides the tracking of user activity on a given device for privilege 1 commands.
This provides the tracking of user activity on a given device for privilege 15 commands.
This provides tracking of user activity on a device, even if they have just logged in.
As you can see from this basic configuration, there is significant variability, resulting in complications of the verification of the proper function. This worsens with regular network operations, when the connectivity to the TACACS server fails, requiring a troubleshoot to determine the error. In such a situation, one would usually remove the TACACS configuration in attempt to resolve the issue. However, during the troubleshoot, it is common to forget about this change and leave the network open with local authentication or, perhaps, no authentication, whatsoever. Luckily, IP Fabric offers the newly released AAA verification, which can be used for the verification of the real live AAA settings.
Although our platform includes a few “out of the box” reports, we highly recommend adjusting these default reports in color with your custom verification checks, since the AAA settings differ between various companies. We recommend that you observe and spend time on the following:
For example, let us assume that we want to set up the verification report for the Authentication methods to verify this:
which would be equivalent of the following piece of configuration
aaa authentication login default group ABACS localaaa authentication enable default group ABACS enableIt is generally recommended to have a single detection for all issues on the particular AAA method and to reveal the issue count on the dashboard.
This can be configured in the following manner:
For a more detailed overview of how to set this up, view the video below:
Proceed to colorize the columns with specific details to green or orange, so that you will immediately see what is wrong from the dashboard counter created previously. In our case, we would need to setup additional rules as follows:
AAA Authentication Secondary method would look like this:
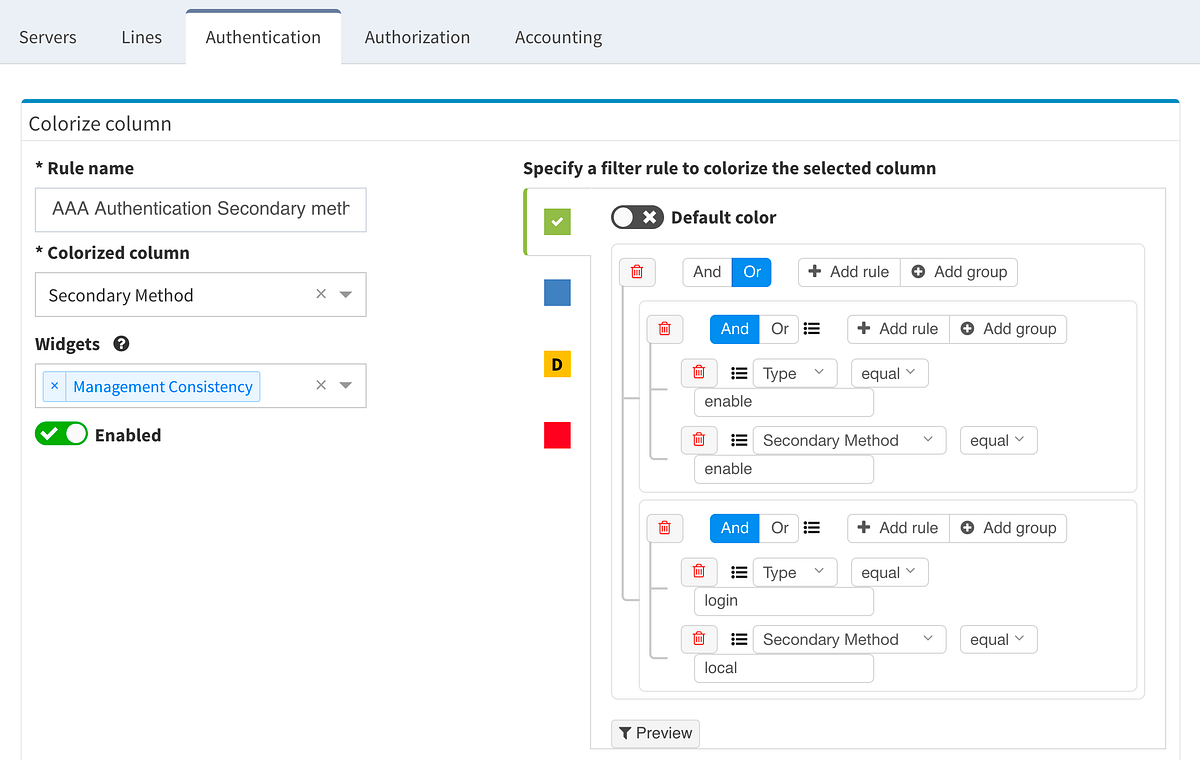
This will ensure the setup of the Authentication on all devices in the network. In regards to the remaining tabs (servers, lines, authorization, and accounting), you may follow the same logic to create similar specific rules that will configure IP Fabric to verify your specific AAA needs consistently in a matter of seconds.
If you’re interested in learning more about how IP Fabric’s platform can help you with analytics or intended network behavior reporting, contact us through our website, request a demo, follow this blog or sign up for our webinars.
Today, we are delighted to announce a new feature loaded release 2.2.8 of our IP Fabric Network Infrastructure Management Platform — Engineering Edition. This release is full of new exciting features and improvements, ranging from a new routing protocol support — EIGRP and RIP, through additional technology verification for Authentication, Authorization, and Accounting (AAA) to improvements for the existing tables and verification checks. We have listened to your feedback closely and implemented major improvements for the diagrams, so that you can display more information both visually and in the related popup windows.
Many of you have asked for ability to display additional information directly in the diagrams and we are delivering it today. Now you can display or hide additional network detail without going to the Technology Tables.
There is a number of options to display detailed information for various layers and technologies:
These new options, however, created an issue — the diagrams became overloaded with information. Therefore, we created a new straight link style that works better than the default Bezier curves, especially if you need to display more details on multiple parallel links.
Rethinking link style calculation proved very popular, because straight links can represent more information more clearly, especially when displaying multiple paths or protocols.
One of the awesome features of IP Fabric is its End to End path lookup. It allows you to test whether the traffic will be allowed through the whole infrastructure or not and why. However, in complex networks it was not very easy to find what is wrong with the path as there were only arrows to signify the resulting decision, and no clear indication of the problematic devices. To improve visual interpretation of the path lookup result we implemented highlighting of the devices which are causing a problem or are prohibiting traffic to pass, be it either because of ACL, Zone Based Firewall, Routing or Switching. Forwarding verification result has also been added to the device popup windows to provide detail from routing and switching perspective.
The path lookup is truly end to end, meaning we do not stop at the first device denying the traffic but finish the path simulation, so that we can highlight all the issues on that particular path.
This enables you to prepare all the necessary changes at once, instead of moving hop by hop.
IP Fabric now provides detailed information about configured Authentication, Authorization and Accounting (AAA) servers, policies and how they are applied through your network infrastructure. This can be used for validation that all devices are hardened properly, that the users logging in are being properly authenticated and authorized, and that all their activities on the device are logged and accounted for.
This is an example of how intent-based verification is much more robust than text-based golden config checks. With IP Fabric's platform you can ensure that general AAA rules are followed throughout your network, and that operational state complies with your intent of how the network is supposed to operate, regardless what OS device is running or if the device is HP, Juniper or Cisco.
While we support general routing verifications regardless of the protocol or the route source, with 2.2.8 we’re expanding detailed routing protocol support from BGP and OSPF to EIGRP and RIP. As always, the data is presented in the structured technology tables, the knowledge base, as well as in Diagrams.
BGP support was also improved, providing out-of-the box information about internal and external peering as well as details on BGP session uptime. This is very helpful for troubleshooting flapping or recently converged BGP sessions.
Last but not least, based on the feedback, we improved out-of-the-box verification reports to be more accurate and useful. In addition, we added DNS resolve support for the Connectivity report, which makes it easier identify the devices that have not been discovered properly.
If you’re interested in learning more about how IP Fabric’s platform can help you with analytics or intended network behavior reporting, contact us through our website, request a demo, follow this blog or sign up for our webinars.
Every network is growing, every network is becoming more complex due to all the requirements coming from the technology evolution or customer needs, e.g. building the more reliable network connections, application-based routing, etc. And all these facts are the triggers for all the changes we are facing almost every day. Of course, there are small (not so important changes) but there are also complex network changes including core devices replacement, design changes impacting the business, and emergency changes that are caused by a failure …
I was managing small networks of units of devices, larger networks consisted of tens or hundreds of network devices but also the enterprise networks with thousands of routers, switches, firewalls and many other different network appliances and devices. I want to share some of my best practices from experience with all the changes I had prepared and executed.
There should be a reason for every network change, but let’s exclude the emergency changes as it’s mostly about “how to fix the network so that the business can go on ASAP”. I want to focus on the planned changes for which we can prepare for properly — the best way is to have the change management process in place, including the CAB (Change Approval Board) that consists of technical reviewers and these are able to check the whole change preparation with the proper description, commands and devices to be implemented or installed, and also check the testing sequence that is needed to prove that the change is successful.
Ideal way is to follow these point to ensure we know what to do before we touch the network.
In case of the complex change it is better to divide the whole activity into the smaller pieces and prepare the tests for all these sub-tasks. It should avoid the complex troubleshooting during the maintenance window and review the commands we applied from the very beginning of the change …
Let’s imagine we need to implement small change caused by the change of the ISP’s PtP network on our MPLS connection. It means the only commands we need to implement is to modify the IP address on the WAN interface and modify the next-hop within our static route. So what to check? What kind of testing method should we choose?
I recommend to create a set of verification commands so they’re not based on a specific change. Just to have a possibility to check the health of the device, do a snapshot of the different tables to have a chance to prove there is some issue right before we start the change — e.g. we don’t have a connection to the corporate FTP server, the external connectivity is not working, the log shows some issue not related to our change etc. Based on the device type we should gather the information about the uptime, last reload reason, the logs from the device, NTP status, routing table, mac-address table, interface stats, ARP table, multicast table(s), etc. Then start with the verification the subject of the change — using ping and traceroute is the most usual way to check the routing — ping the ISP IP, ping any other off-site resource, ping some Internet IP (personally, I’m using the public DNS IPs — e.g. 8.8.8.8, 4.4.2.2 …) and also trace to these IPs. Then, check the specific command related to this change — interface configuration and default route information.
And most important fact is the reason why we are configuring the network services — it’s not just for fun, just to have the router/switch/firewall with the Internet connection, but mostly because it’s serving the customer to have a set of services they need for the business (except the lab environment). Therefore the most critical testing is the application testing procedure from the customer side and it should be executed directly by the customer or onsite user to confirm it’s working as expected. For basic pre-check see below
!
show clock
show version
show run
!
show ip int brie
show int description
show int e0/0
show int e0/0.3733
show ip route
show ip route 0.0.0.0
sh ip proto sum
sh ip ospf
sh ip ospf neighbors
sh ip ospf data
sh ip nat translation
sh ntp status
show log
!
!!! ping the ISP interface (old and new)
!
ping 10.73.254.1 rep 100 size 1024
ping 10.73.200.1 rep 100 size 1024
!
!!! ping the off-site resource
!
ping 10.0.20.20
!
!!! traceroute to the off-site resource
!
traceroute 10.0.20.20 prob 1 time 1 num
!
!!! ping the Internet IP
!
ping 8.8.8.8
!
The change activity should start with running the verification commands, then change the IP and default route in this case and running the same verification command set. I’m asking customer to run their own verification after I’m done with my portion of verification to avoid some high traffic load etc. Then, using some comparison tool to review the PRE and POST states:
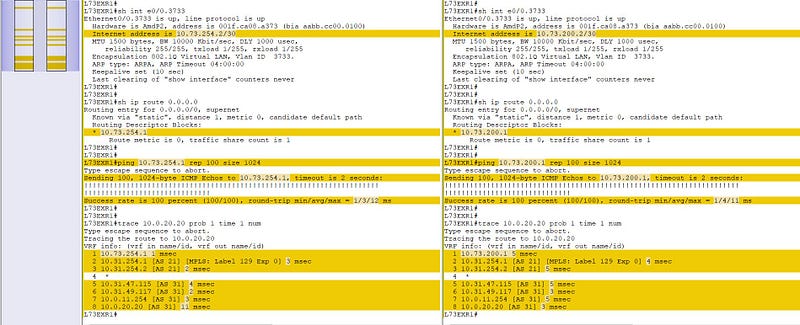
From the network perspective — the change has been implemented successfully, all the checks are as expected, the routing is working fine and we should ask the customer to do their tests — their own pings, traceroutes, application testing — e.g. working with the emails, VoIP services, core apps like SAP, web services, FTP services, etc.
Let’s review all the steps required to proceed with this simple change — change one IP address. Analyze the risk and impact of that change, prepare the verification procedure, prepare the commands needed to implement the change, run all the checks, apply all the commands, run all the checks once again and compare the results. And now, add the some complexity to the trivial network change.
What about if the replacement of the core network device is needed? It means more preparation work and also more attention to the whole process … what about if the site-local dynamic routing protocol is planned to be replaced, e.g. replace the old RIP with the newer OSPF. It’s not about one step, about one or two commands and one or two ping/traceroute verification. I will go through the previously described process more deeply and will bring some additional details to each step.
1. Prepare all the commands
We should be prepared as much as possible and should have all the commands we will apply on all various devices to save the time during the change window. Many complex changes have to be planned very carefully and it is better to split the whole change to several stages with the specific command set to be applied
We should be prepared as much as possible and should have all the commands we will apply on all various devices to save the time during the change window. Many complex changes have to be planned very carefully and it is better to split the whole change to several stages with the specific command set to be applied
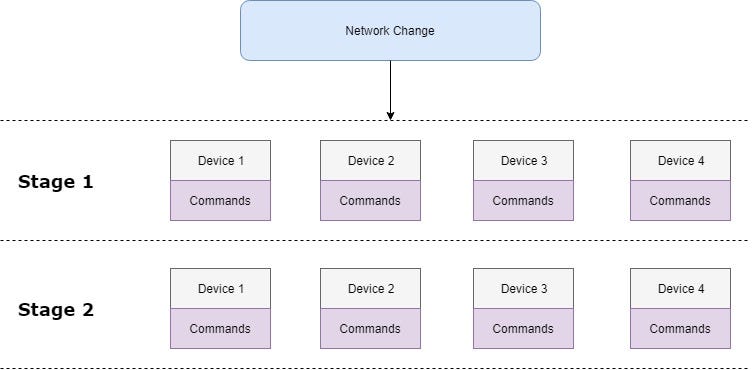
These “big actions” are mostly coordinated with the customer therefore it is good to define some milestones within the implementation plan and discuss the progress among the whole team. I will cover the rollback plan later in this chapter.
It is a definitely most critical part of that change process. Not from the functional point of view but from the change management process perspective. It must be proven the network is working at 100% and all the types of communications have to be tested and all the parameters verified.
It is still very important to have all the information we might need in one place — IP addressing of all devices, access credentials incl. local user access, topology diagrams, etc. It is also important to double check the order of the commands we will apply line by line — we must be very careful not to apply any command it will cut the device off. Personally, I caused it many times in the past — I applied the wrong access-list, I didn’t allow the correct VLAN on the uplink trunk, I configured the wrong IP address on the WAN interface, and did many other things… so if it is possible, it is good to use scheduled rollback or reload of the device to revert back the last known configuration (e.g. Cisco’s command reload in) …
2. Prepare all the verifications
It is a definitely most critical part of that change process. Not from the functional point of view but from the change management process perspective. It must be proven the network is working at 100% and all the types of communications have to be tested and all the parameters verified.
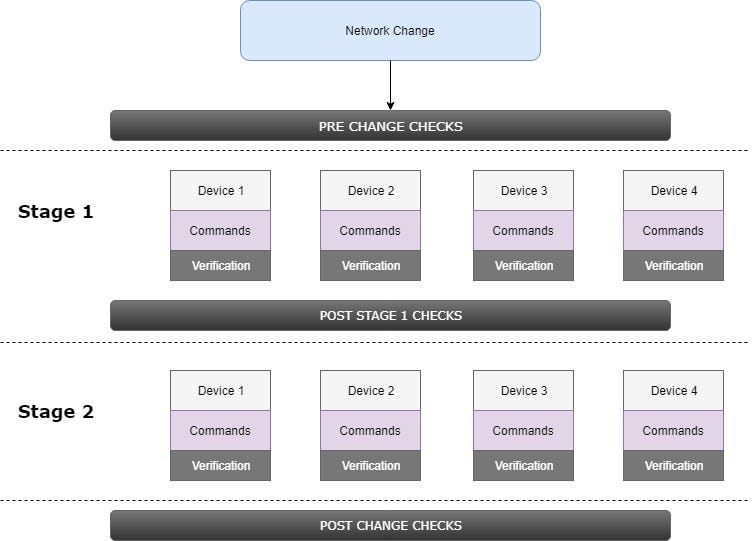
The big checks (PRE/POST and after the specific stage) should include the global verification — availability, path parameters and should be automated (will be covered later in text) and the small verification boxes represent just “local” testing after the specific commands are executed (e.g. verify the routing protocol is up and running, the ACL matches the trafrfic, the QoS marking is working etc.).
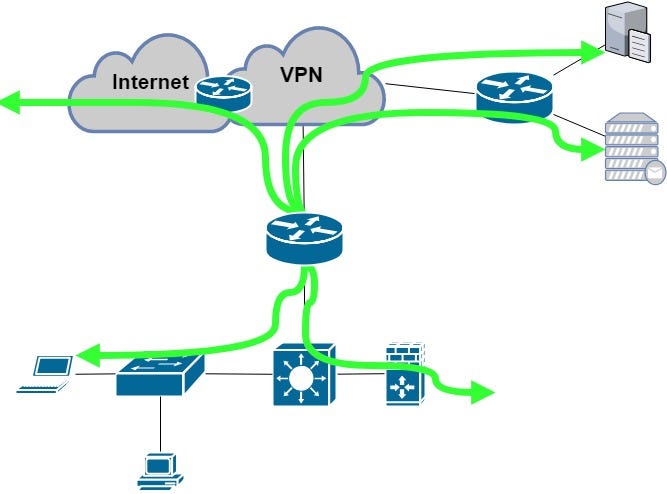
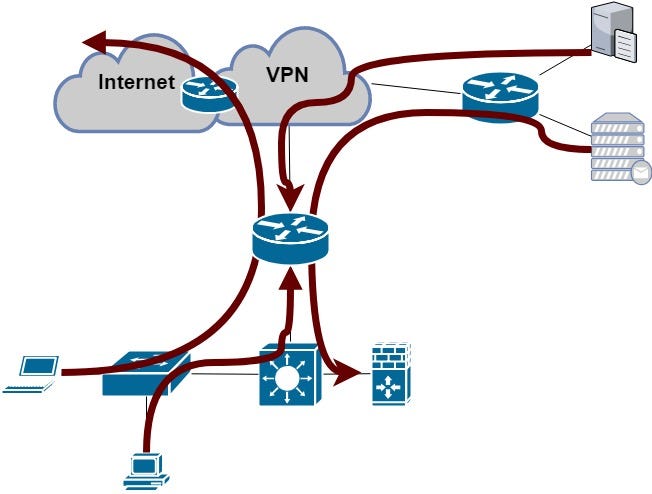
Most of the network devices we are configuring have two sides — the firewall is using inside and outside interfaces, the router is using WAN and LAN interfaces, the switch is connecting the hosts or other switches towards the core etc. Based on this fact, I recommend to use three different types of testing method:
a) checking connectivity TO THE DEVICE
It means we should check the availability of the configured device from the core or from the downstream direction. We can check the online/offline state with the ping tool and we can check the incoming direction with the traceroute command. The IP address can be the management loopback, WAN IP address or any other IP important for the communication with this device.
b) checking connectivity FROM THE DEVICE
It is very important to have a list of corporate resources that should be available throughout the whole network — FTP server, NTP server, VPN hub, … and the best way how to check this part is to ping all these resources (IPs) and trace the path to them to ensure it’s working as expected.
c) checking connectivity THROUGH THE DEVICE
It may happen that the network is not working even the previous two checks are OK. Why? Because the traffic shouldn’t pass the device correctly — there could be a problem with the advertisement of the local prefixes, the issue with the redistribution, the L2 switch VLAN ACL or mismatched filtering within the FW ACL. So pinging the core or corporate resources from the LAN (or inside) AND pinging the LAN/inside IPs from the core is a must in this case to ensure both directions are OK.
3. Prepare the rollback plan
As mentioned before, milestones or check points should be defined to have a possibility to decide whether to continue or not with the network change (go-no-go decision). They are usually after verification at every stage:
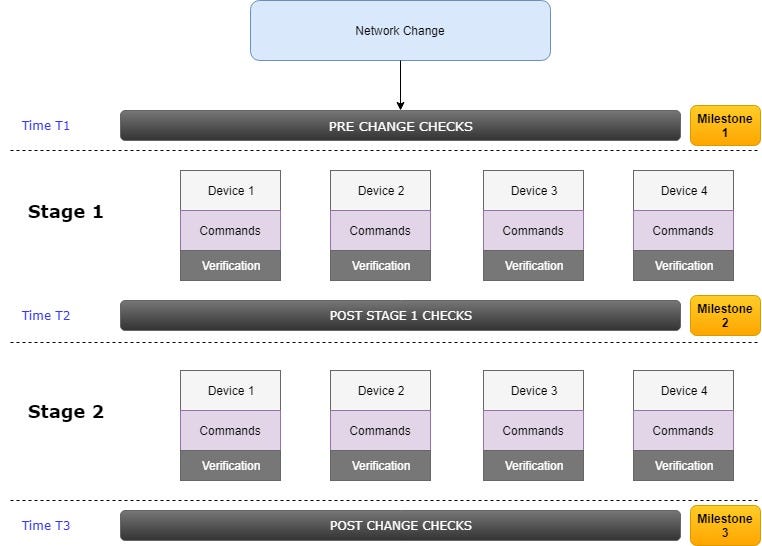
These three milestones from our example can be described as follows:
The rollback plan should contain the steps for all the devices that are being touched during the change window — re-cabling instructions and command set for each milestone and its own verification procedure. The global post-check verification is executed after the rollback is completed and comparison with the pre-check output is mandatory.
The amount of the verification is growing with the complexity of the change and therefore we should try to save the energy by using some automation tools. I omit the commercial tools for monitoring the network resources and want to describe some various possibilities I’ve encountered during my work.
I will use just three verification commands they’re implemented on all OS I have met — ping to check if the destination IP is available or not, traceroute to check the exact path between the source and the destination IP and telnet to check various L4 ports. If I use the same differentiation of the verification directons as described above, I will talk about only two directions from that list only — verification executed on the device that is being changed and from any other location towards this device.
1. Verification from the impacted device
It’s easier to execute the verification procedure from the impacted device as we are still at one prompt and only challenge is to process the command by command.
Cisco’s easiest way is to use the TCL script to run the verification commands by using native commands mentioned above. It can be stored as a function and called any time during the change window or it can be processed just once as we need it.
Let’s demonstrate how it works and the difference between the various possibilities. Let’s have three IP addresses we will use for our verification from one device — 10.0.20.1, 10.0.20.20 and 10.0.20.21. I have prepared the set of verification commands:
!
ping 10.0.20.1 rep 2
ping 10.0.20.20 rep 2
ping 10.0.20.21 rep 2
!
traceroute 10.0.20.1 prob 1 time 1 num
traceroute 10.0.20.20 prob 1 time 1 num
traceroute 10.0.20.21 prob 1 time 1 num
!
Of course I can use standard copy&paste function but the problem is processing the input via the TTY session. Next exhibit shows the result when using copy&paste — it can be seen one ping command is missing (even it was within the pasted text) and two traceroute commands are also missing …
L73EXR1#ping 10.0.20.1 rep 2
Type escape sequence to abort.
Sending 2, 100-byte ICMP Echos to 10.0.20.1, timeout is 2 seconds:
!!
Success rate is 100 percent (2/2), round-trip min/avg/max = 4/4/5 ms
L73EXR1#ping 10.0.20.20 rep 2
Type escape sequence to abort.
Sending 2, 100-byte ICMP Echos to 10.0.20.20, timeout is 2 seconds:
!!
Success rate is 100 percent (2/2), round-trip min/avg/max = 5/11/18 ms
L73EXR1#traceroute 10.0.20.21 prob 1 time 1 num
Type escape sequence to abort.
Tracing the route to 10.0.20.21
VRF info: (vrf in name/id, vrf out name/id)
  1 10.73.254.1 1 msec
  2 10.31.254.1 [AS 21] [MPLS: Label 129 Exp 0] 1 msec
  3 10.31.254.2 [AS 21] 3 msec
  4  *
  5 10.31.47.115 [AS 31] 2 msec
  6 10.31.49.117 [AS 31] 1 msec
  7 10.0.11.254 [AS 31] 4 msec
  8 10.0.20.21 [AS 31] 5 msec
We need ensure that every command is pasted/processed once the prompt is ready. With Cisco TCL script we can modify the verification set as follows:
foreach address {
 10.0.20.1
 10.0.20.20
 10.0.20.21} { ping $address rep 3
}
It means we can enter the TCL mode by typing tclsh command and paste the text above. It will process command by command as needed. Then, we can expand the TCL script and add the traceroute or any other Cisco command with the IP address as an argument. To make it simpler, it’s possible to create the procedure called any name, put all the verification into the brackets and then, it can be called any time from the tclsh prompt. The example of our verification set:
proc CheckFROMonce {args} {
 foreach address {
  10.0.20.1
  10.0.20.20
  10.0.20.21} { ping $address rep 3
 }
 foreach address {
  10.0.20.1
  10.0.20.20
  10.0.20.21} { trace $address prob 1 time 1 num
 }
}
Then, let’s call the procedure once:
L73EXR1(tcl)#CheckFROMonce
Type escape sequence to abort.
Sending 3, 100-byte ICMP Echos to 10.0.20.1, timeout is 2 seconds:
!!!
Success rate is 100 percent (3/3), round-trip min/avg/max = 4/6/8 ms
Type escape sequence to abort.
Sending 3, 100-byte ICMP Echos to 10.0.20.20, timeout is 2 seconds:
!!!
Success rate is 100 percent (3/3), round-trip min/avg/max = 2/8/14 ms
Type escape sequence to abort.
Sending 3, 100-byte ICMP Echos to 10.0.20.21, timeout is 2 seconds:
!!!
Success rate is 100 percent (3/3), round-trip min/avg/max = 2/5/10 ms
Type escape sequence to abort.
Tracing the route to 10.0.20.1
VRF info: (vrf in name/id, vrf out name/id)
  1 10.73.254.1 1 msec
  2 10.31.254.1 [AS 21] [MPLS: Label 129 Exp 0] 3 msec
  3 10.31.254.2 [AS 21] 3 msec
  4  *
  5 10.31.47.115 [AS 31] 7 msec
  6 10.31.49.117 [AS 31] 5 msec
  7 10.0.11.254 [AS 31] 5 msec
  8 10.0.20.1 [AS 31] 4 msec
Type escape sequence to abort.
Tracing the route to 10.0.20.20
VRF info: (vrf in name/id, vrf out name/id)
  1 10.73.254.1 1 msec
  2 10.31.254.1 [AS 21] [MPLS: Label 129 Exp 0] 1 msec
  3 10.31.254.2 [AS 21] 7 msec
  4  *
  5 10.31.47.115 [AS 31] 7 msec
  6 10.31.49.117 [AS 31] 6 msec
  7 10.0.11.254 [AS 31] 9 msec
  8 10.0.20.20 [AS 31] 3 msec
Type escape sequence to abort.
Tracing the route to 10.0.20.21
VRF info: (vrf in name/id, vrf out name/id)
  1 10.73.254.1 1 msec
  2 10.31.254.1 [AS 21] [MPLS: Label 129 Exp 0] 2 msec
  3 10.31.254.2 [AS 21] 5 msec
  4  *
  5 10.31.47.115 [AS 31] 2 msec
  6 10.31.49.117 [AS 31] 2 msec
  7 10.0.11.254 [AS 31] 3 msec
  8 10.0.20.21 [AS 31] 3 msec
L73EXR1(tcl)#
In case we cannot use the TCL or we don’t want to use it for any kind of reason, we can use own script based on the tool or scripting language we are using — it can be PERL or PYTHON script with direct SSH/Telnet module or it can be served by VBScript within the SecureCRT client. The easiest VBScript without loading external files (e.g. device list or command set) is as follows:
#$language = "VBScript"
#$interface = "1.0"
crt.Screen.Synchronous = True
sub Main
  crt.Session.Log False
  crt.Session.LogFileName = "logs\CheckFROMonce.log"
  crt.Session.Log True
crt.Screen.Synchronous = True
  crt.Screen.Send "ping 10.0.20.1 rep 2" & vbcr
  crt.Screen.WaitForString "# "
  crt.Screen.Send "ping 10.0.20.20 rep 2" & vbcr
  crt.Screen.WaitForString "# "
  crt.Screen.Send "ping 10.0.20.21 rep 2" & vbcr
  crt.Screen.WaitForString "# "
  crt.Screen.Send "trace 10.0.20.1 prob 1 time 1 num" & vbcr
  crt.Screen.WaitForString "# "
  crt.Screen.Send "trace 10.0.20.20 prob 1 time 1 num" & vbcr
  crt.Screen.WaitForString "# "
  crt.Screen.Send "trace 10.0.20.21 prob 1 time 1 num" & vbcr
  crt.Screen.WaitForString "# "
  If crt.Session.Logging Then
    crt.Session.Log False
  End If
  crt.Sleep 500
  MsgBox "DONE: Generic Scripting"
end Sub
There is a lot of options how to proceed with this type of task but the aim is the same for all methods — save the time by pasting the commands, avoid the human error by using one verification procedure in all the verification steps and to have the same-formatted log to be able to compare the results any time during or after the change.
2. Verification to or through the impacted device
A little bit different scenario is the second part of verification and it’s testing the function of the impacted device for the traffic that is destined to the device or is passing through the device.
To fulfill this task we should login to the various devices and execute some specific set of command. The command set can be equal to check the same connectivity check from various network sources or additionally, it can be different and test different services or destinations.
I recommend to include these verification:
The automation of these verification steps can be done by using some scripting language and preparing the specific device-list as an input file and executing the verification command set from these devices step by step.
The simple BASH script that should be located and executed somewhere in the network far from the change location could be used to monitor the local resources incl. the management IP, local prefixes etc.
#!/bin/bash
HOSTS="10.0.20.73 10.73.255.1"
C=2
while true
do
  for conHost in $HOSTS
  do
    result=$(ping -c $C $conHost | grep 'received' | awk -F',' '{ print $2 }' | awk '{ print $1 }')
      if [ $result -eq 0 ]; then
        echo "Host $conHost is down! at $(date)"
      fi
  done
done
We can specify as many hosts as needed and check the connection state — if the ping result is OK (the IP is reachable), it’s showing no output and if there is an issue with the reachability, it will display the information the host is down and the date/time detail:
trehor@labremote:~$ ./monitor.sh
Host 10.73.255.1 is down at Thu Jul 26 06:39:41 CEST 2018
Host 10.73.255.1 is down at Thu Jul 26 06:39:53 CEST 2018
Host 10.73.255.1 is down at Thu Jul 26 06:40:05 CEST 2018
^C
trehor@labremote:~$
Because of the infinite loop within the BASH script, you must terminate the monitoring script by pressing CTRL+C.
In my opinion, the verification is very important part of the network changes regardless it’s a simple network change (changing the next-hop of the static route) or very complex change (core router replacement, local dynamic routing protocol replacement, adding the second router with the secondary connection etc.) or impacting one device or including 10+ devices. It must be prepared and reviewed in advance to avoid missing tests and mostly, we should collect as much as possible from the testing logs and be able to compare the PRE/POST outputs to prove the network behavior is the same after we finish the network change as it was before we started. And sometimes — these logs can help us with the troubleshooting several days after the change …
If you’re interested in learning more about how IP Fabric’s platform can help you with analytics or intended network behavior reporting, contact us through our website, request a demo, follow this blog or sign up for our webinars.
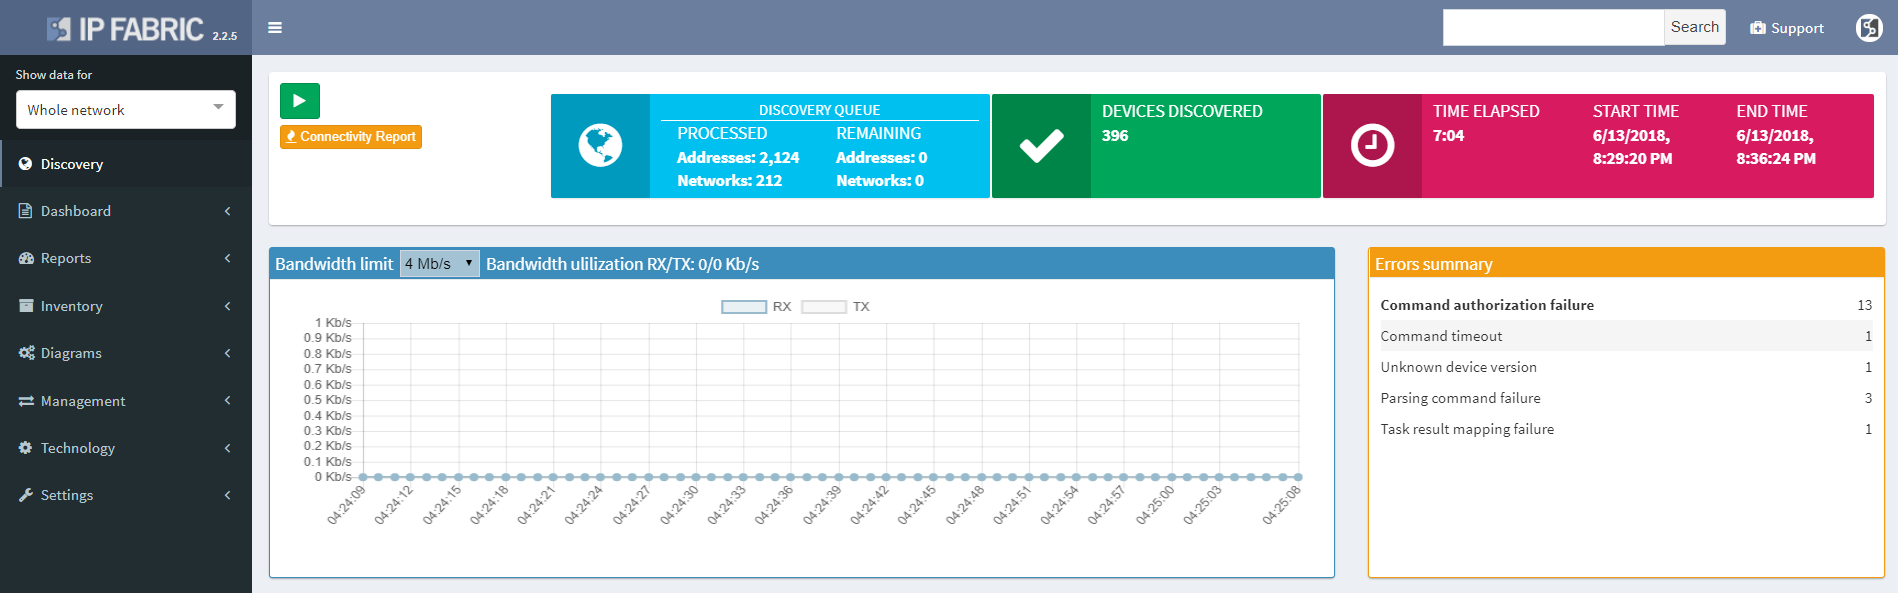
This week we released IP Fabric version 2.2.5 which focuses on improvements of network diagram workflow, significantly improving the depth of information provided in the diagram tooltips, and improving readability of the End to End path diagrams. We’ve also added pseudo-STP links, or MAC edges, to correctly interconnect Layer 2 and Layer 3 when discovery protocol is not present between the devices. This release also adds support for GLBP protocol, support for multi-context Cisco ASA firewalls, support for discovery of ExtremeXOS devices, wireless support for HP830/850, and many other improvements and fixes as detailed in the release notes.
Clicking on a device or link in the network diagram now opens a detailed tooltip with information about the object. Information is contained in tabs of each window, and tabs depend on what functions the device is performing and what protocols it is running. For routers there is naturally more Layer 3 information, including ARP and active routing table entries. For switches there is much more Layer 2 detail, such as switchports and MAC address table entries.
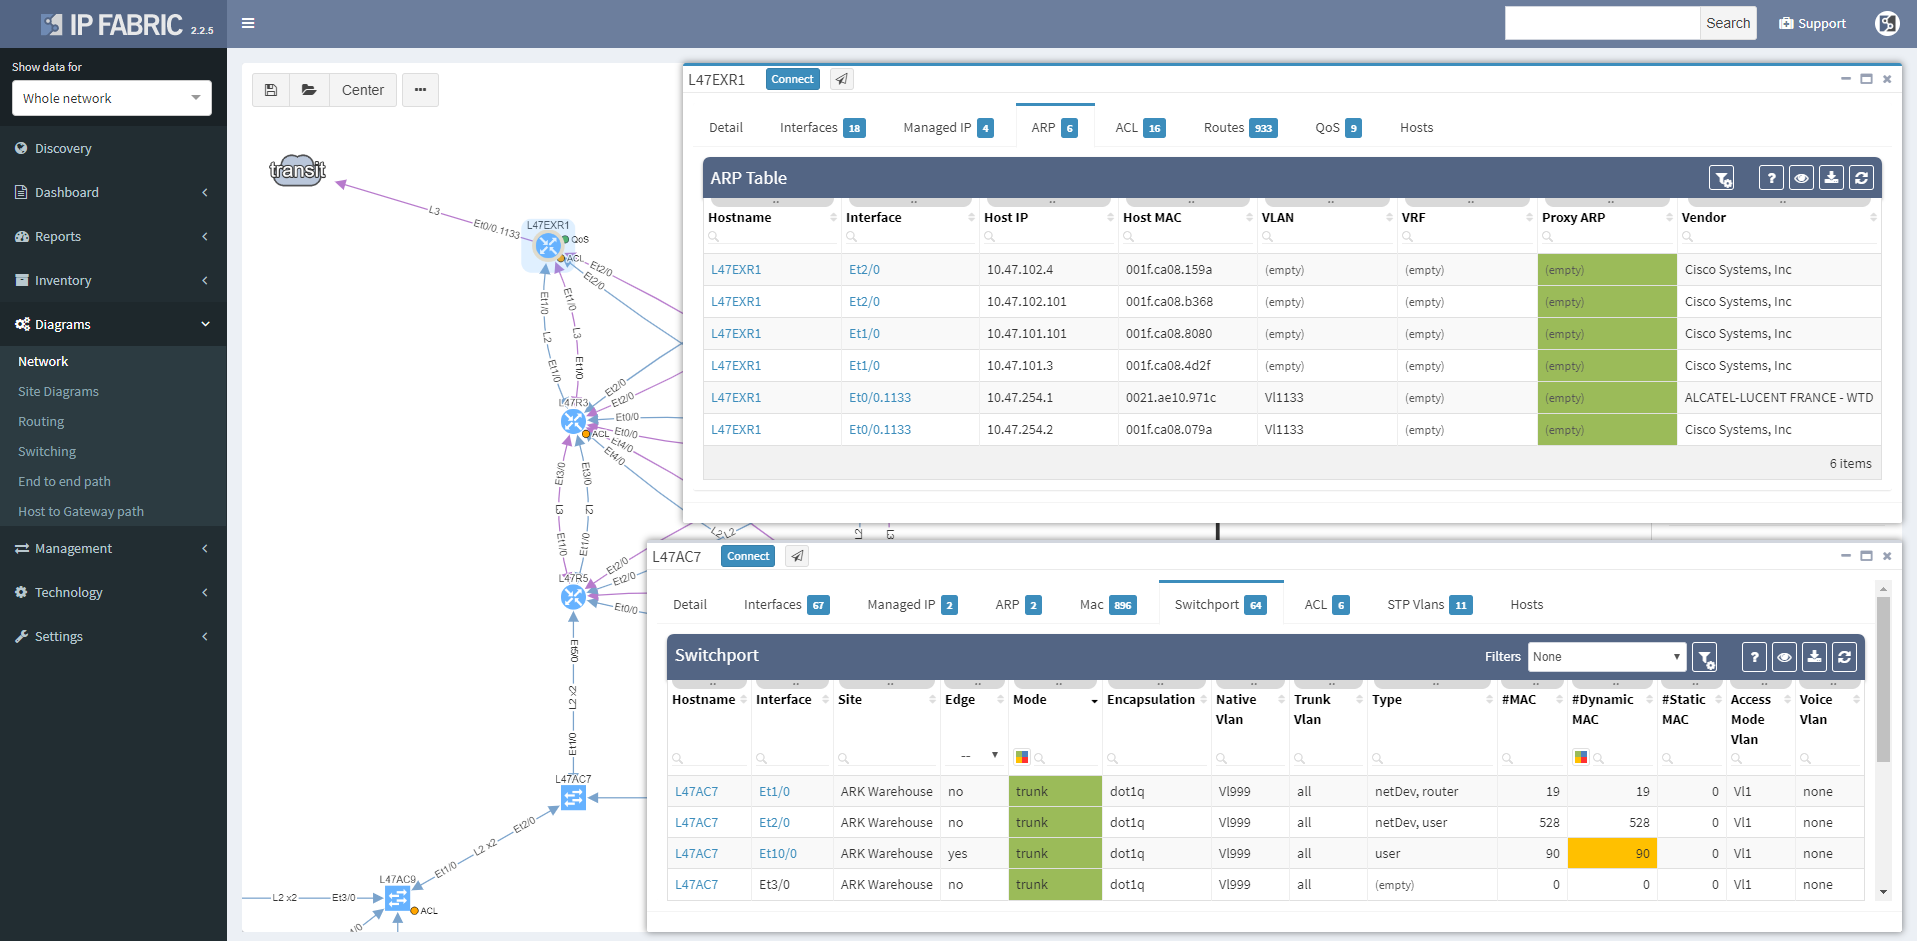
Wireless controller tooltips contain information about APs, firewalls about zones, and so on.
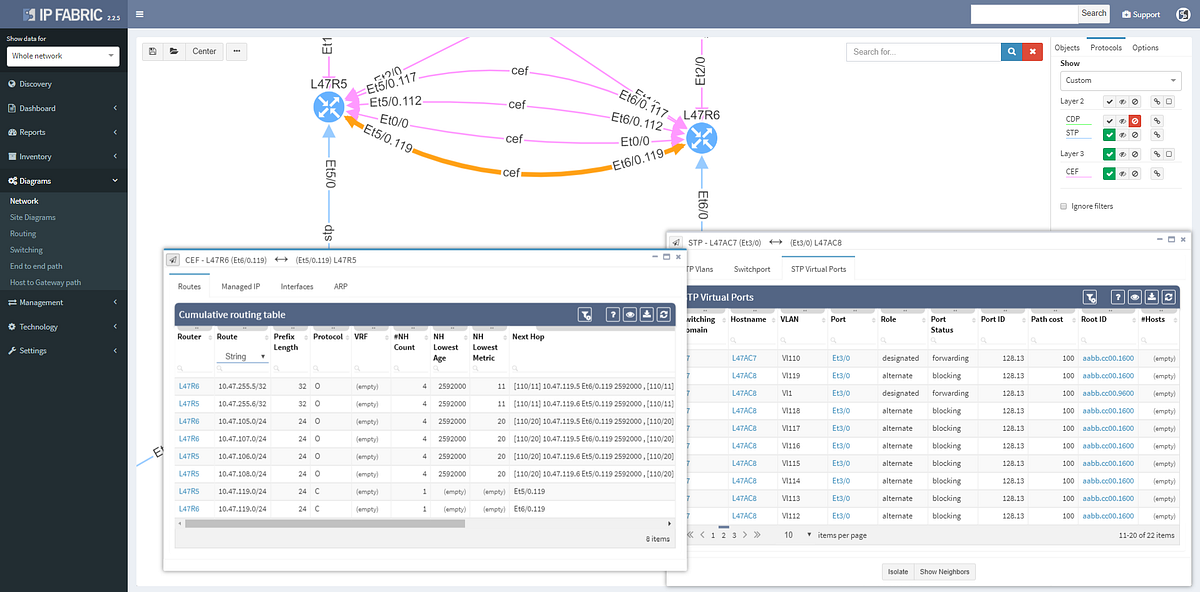
Clicking on a protocol link also opens a window with specific details relevant for the protocol, such as virtual ports and switchport details for the STP link
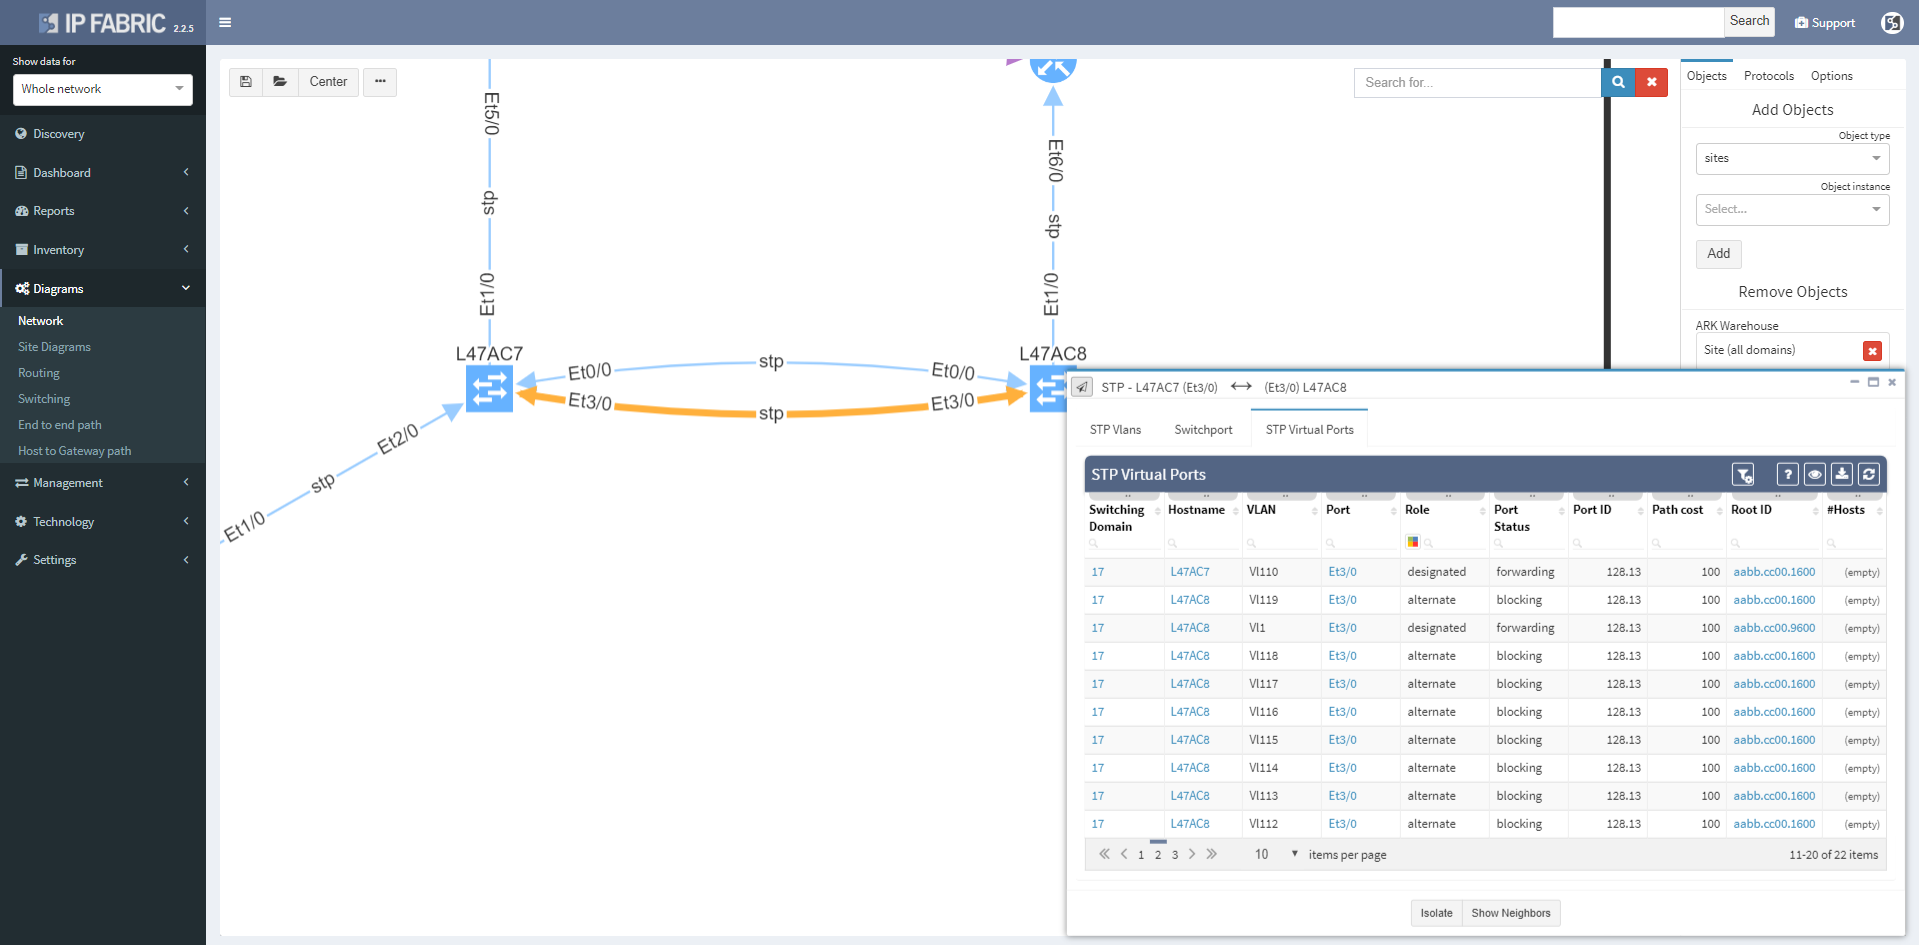
Or routes and for the routed links
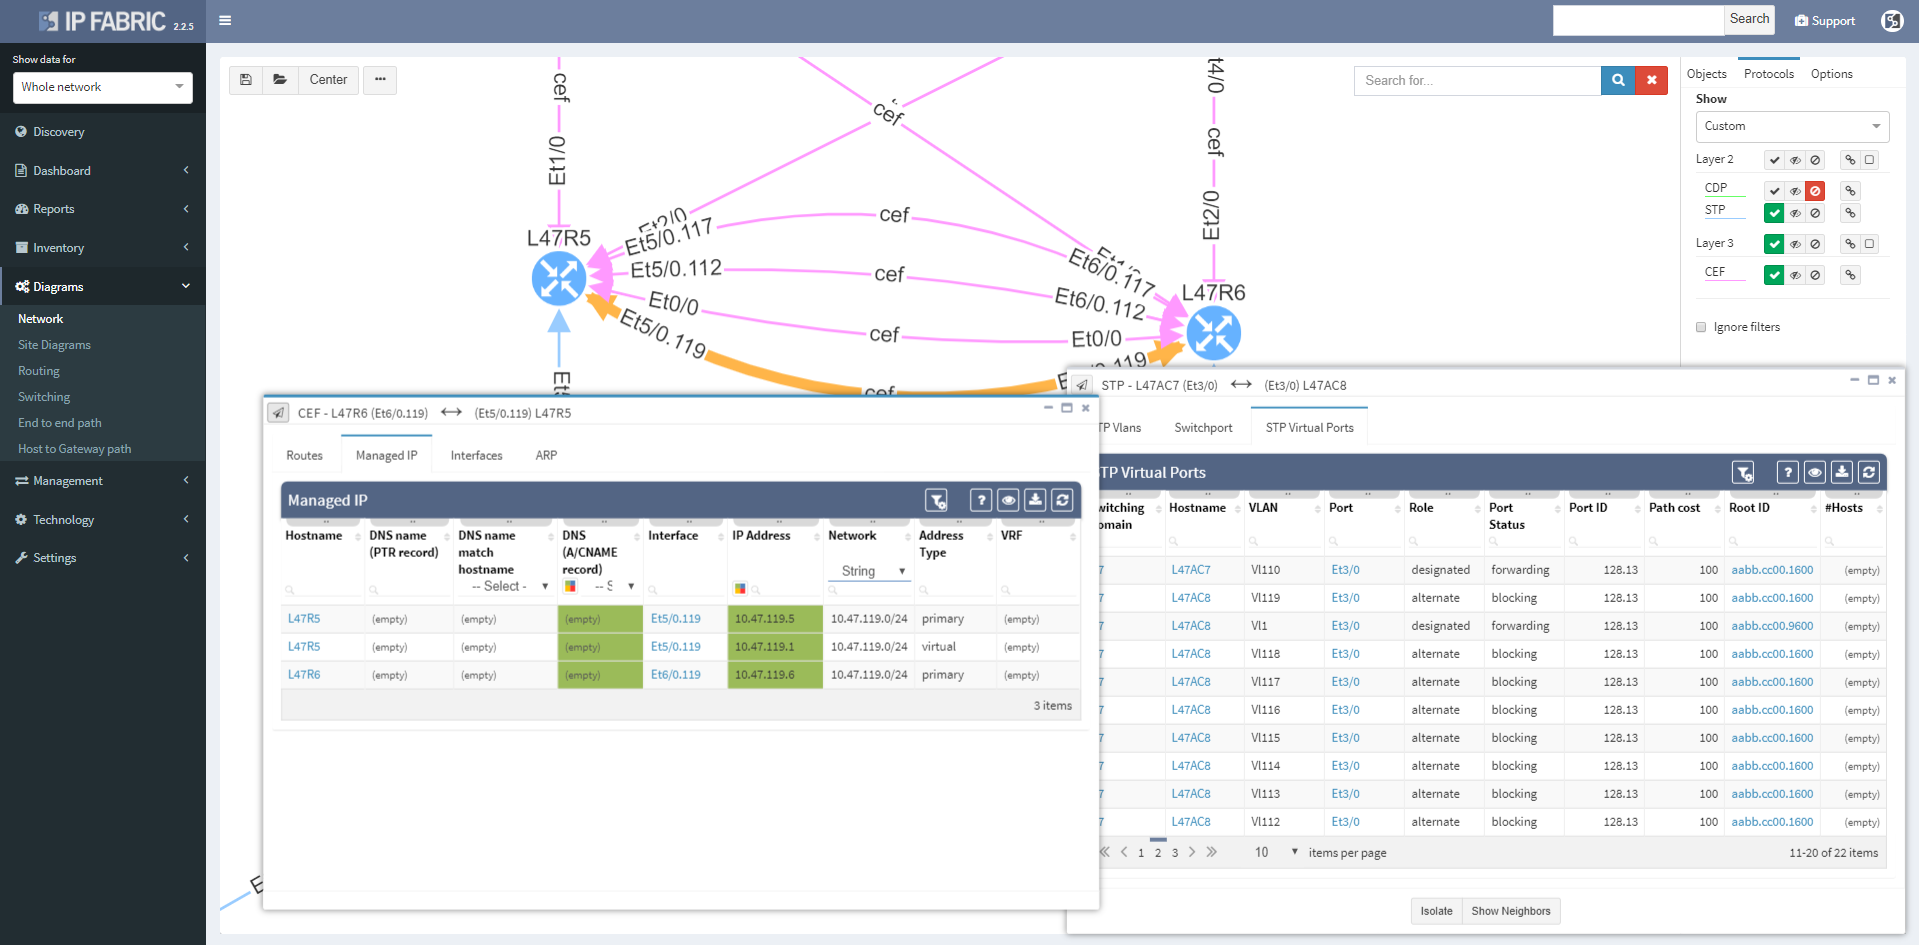
Switching tab to the Managed IP on the routed link shows active IP addresses on both sides of that link.
More time can now be spent in network diagrams and going through the detail without leaving the diagrams by managing tooltip windows. These can be resized, moved, or minimized as needed, and can be referred to later by clicking on the window icon in the bottom right corner of the browser window.

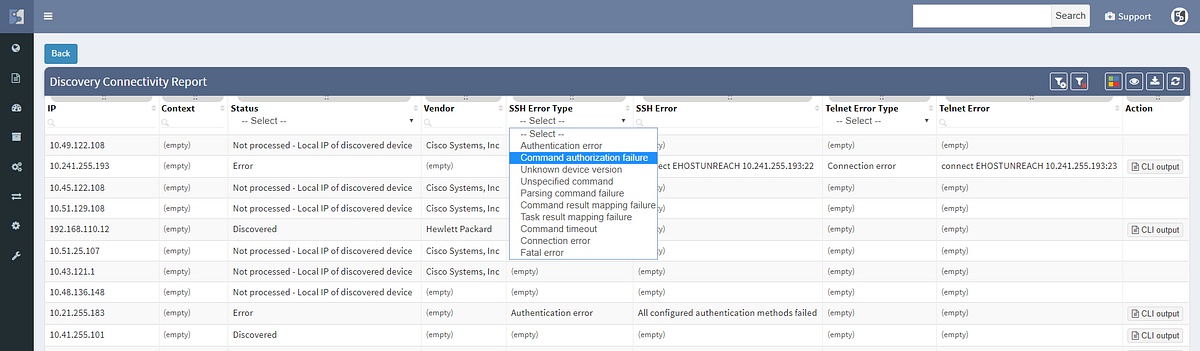
We haven’t focused exclusively on the diagrams, and the Discovery interface has been improved to include information about encountered errors during parsing of device output, grouping issues by error types and enabling to click through to specific output that caused a problem for IP Fabric. This enables to quickly spot issues such as missing authorization for a specific command, or inappropriate timeouts for very long command outputs.
The discovery connectivity report itself has also been improved to include not only successful and failed attempts, but also skipped attempts when an IP in queue was found to be belonging to one of the discovered devices, or halted attempts when device being discovered was found to be discovered in parallel by another process (simultaneous duplicate discovery). A complete CLI output log is also available for each attempt.
If you’re interested in learning more about how IP Fabric’s platform can help you with analytics or intended network behavior reporting, contact us through our website, request a demo, follow this blog or sign up for our webinars.
Have you ever tried to find out why the dynamic routing protocol in your network is not passing specific prefix as expected? And the situation had not improved even though ad-hoc static routes were created here and there? Networking protocols are designed to be simple in general. However, they can create very complex state machine systems that may be very hard to diagnose router by router.
What to do when the destination router is positively redistributing the route to the network but the source router does not have a clue about it? Each router should be analyzed one by one and assessed with following topics:
This involves checking the configuration and state information from all routers on all possible paths over the network. Outputs from neighbors must be compared to locate where the route blackhole has been erroneously created. It usually involves lot of administrative sessions to the router and manual work as the scripts for this task would be too complex to create.
IP Fabric offers a very convenient way to see where the problem may be. Do you have a suspicion that your route is a part of a routing loop? One of the links is constantly going up and down? The outer address of a tunnel is advertised inside the same tunnel? You simply put your troubled route as a filter to Routing stability table.
You can quickly look up any route on any router in the network by the following criteria:
All lookups are VRF-aware and return the results in seconds. You will see how many times is the route present in the network and if it recently converged which would indicate instability.
If the route is not flapping, it still may be incorrectly distributed. You simply put your troubled route as a filter to Cumulative network table and you can immediately see which routers know about it and which routers don’t.
You can quickly check the protocols that are used to transport the route (or if the subnet is directly connected or statically routed). Moreover, you can quickly assess all next-hops and trace the path on one screen instead of logging to each router and looking for details manually.
Furthermore, you can have an overall view of all the routing methods (directly connected, static or dynamic) used in your network. Those should match the network design — not desired protocols should be turned off and the desired ones should be up. Even the misconfigured exotic routing protocol left behind from testing can be a source of suboptimal or faulty routing.
IP Fabric can help you approach possible routing problems proactively. It is pointless to have half-open routing peerings or misconfigured neighbors even though it does not affect any network traffic so far. Those should be either repaired or removed from the network. For example table of OSPF, neighborships will quickly show routers where the peerings should be revised because it did not reach the FULL state.
Are you eager to see all of IP Fabric’s powerful features? Schedule a time for a free video call with our expert team who will help create a solution to fit your needs.
The best way to get a quick overview of any network infrastructure is by viewing a diagram (or most likely set of diagrams). The human brain can receive essential information much faster when represented in graphical form. The downside is that manually creating a diagram can take a long time. And keeping a big bunch of diagrams up-to-date is not an attractive task for most of the people.
Network design documents usually include various diagrams (at least one diagram depicting physical infrastructure and at least one diagram depicting logical scheme where the data flows should go). When the design is implemented and routinely operated, the network usually undergoes through many changes as the new requirements approach. Thus design documents provide only a basic clue for everyday network operation such as:
· What is the exact connection at a specific point?
· How many of intermediate devices the data have to cross to reach the destination?
· What is the redundancy/failover mechanism and what is its actual state?
· How many other branch networks are dependent on this network site?
· Which routing mechanism and actual routing decisions apply for the data flows?
· Where in the network is the network security enforced and what is the outcome of it?
To get the answers quickly, diagrams must be kept up-to-date. If the network is large, the set or complete hierarchy of diagrams must be maintained to keep the readability at an acceptable level. The links and relations between the diagrams can slow down navigation among them — most likely when the issue span several regions in the network. And it is not always easy to find the level of detail and scope of the information included on a specific diagram — some information may be missing when troubleshooting and some information can be superfluous and thus confusing when looking for the big overview picture of the network.
Increasing the use of virtual environments with virtual links and devices brings another level of complexity when describing and understanding the network infrastructure. Logically independent entities which share some computing resources may have a different impact on network than if they were physically independent. Diagrams help here but different views of the same entities are required.
The IP Fabric platform copes with the issues mentioned above by introducing Dynamic Diagrams. Those are dynamic in two ways:
1. They are built automatically according to the current network state without the need to update them manually
2. They are viewed with real-time customization of displayed attributes reflecting the actual needs of a viewer
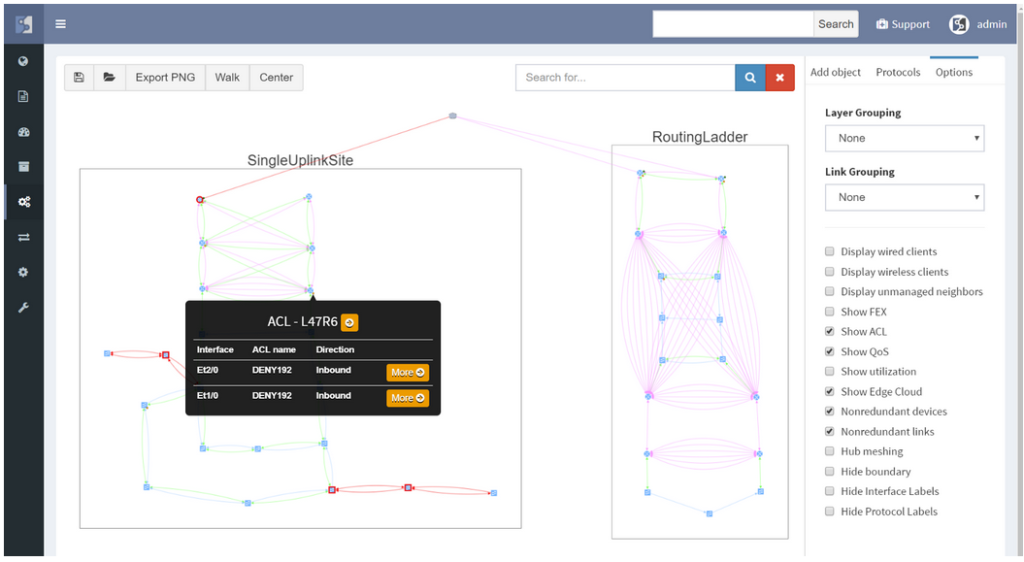
One can easily click through the Ip Fabric platform network diagrams from one end of the network to another or from core to the last edge level of the hierarchy.
The diagram can be quickly transformed from physical-like view with plain L1/L2 neighbor relations to any level of logical view with L2 switching or L3 routing info — thus effectively stopping the need for keeping many sets of diagrams describing the same entities, just with a different point of view.
If you have found this article resourceful, please follow our company’s LinkedIn or Blog, where there will be more content emerging. Furthermore, if you would like to test our platform to observe how it can assist you in more efficiently managing your network, please write us through our web page www.ipfabric.io
Large enterprise networks are constantly changing. Even if no administrative or configuration change activity is planned, the network lives by itself — the devices and links are going up/down and the network protocols are changing their states. How can you find unwanted changes as soon as possible?
The main goal in reactive network troubleshooting is to find the causality chain between the network problem (consequence) and network change (cause, often innocent) that happened beforehand. The change affected some components of the network which affected other components…and led to network problem at the end as a final consequence. Change visibility helps in proactive network analysis as well — some changes may not be visible to users yet, but the network administrator can see that problem may appear soon.
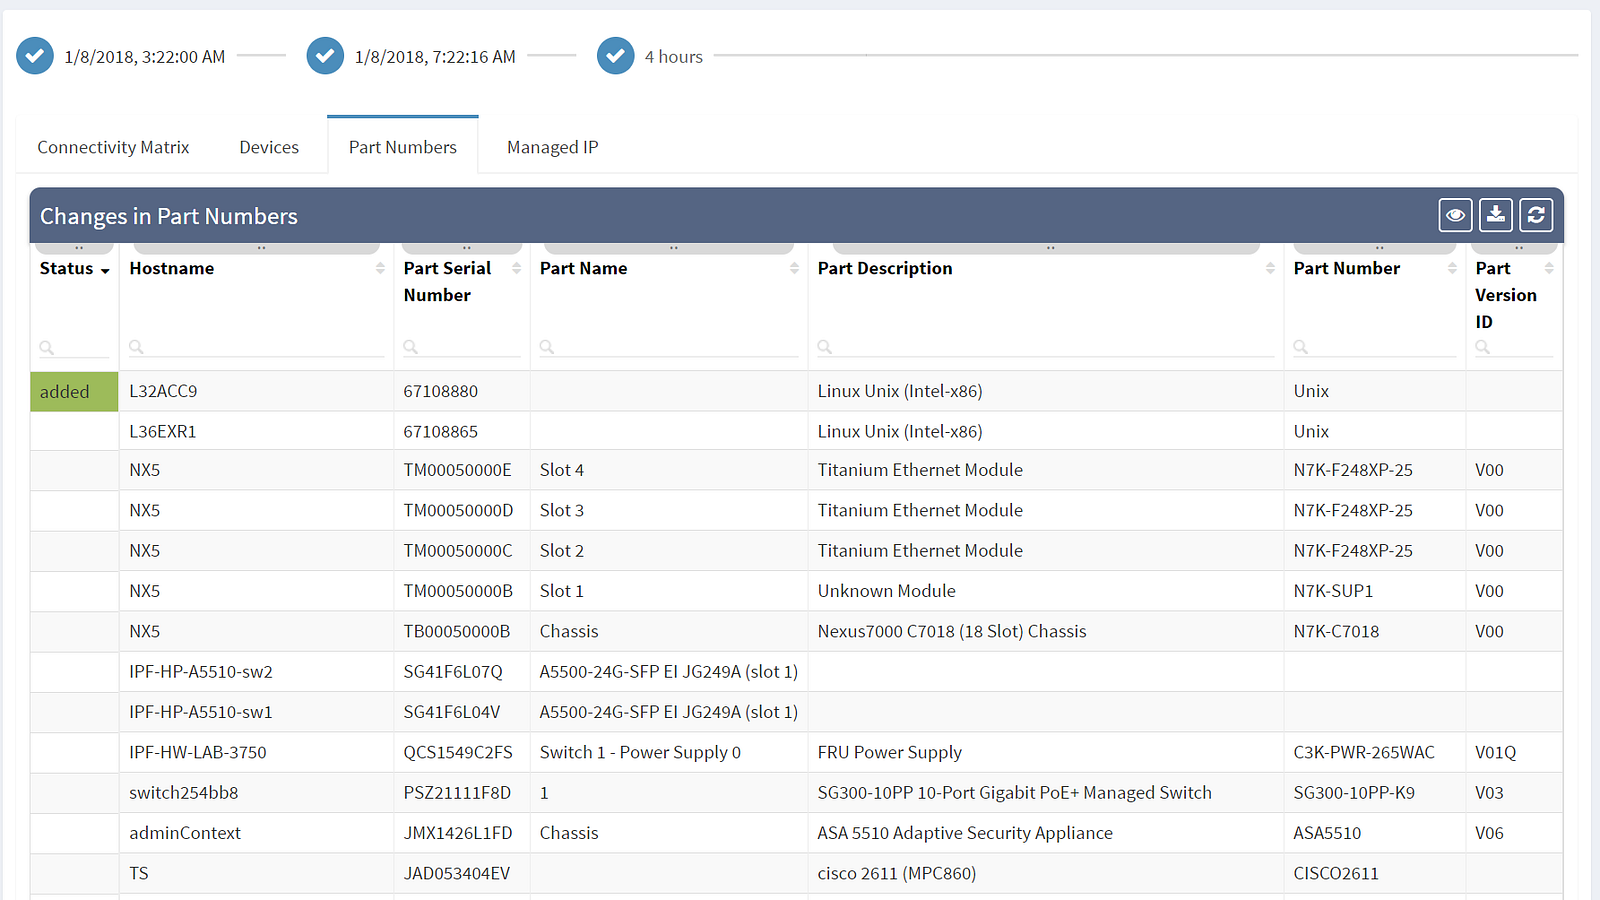
Thus the common question of a network engineer is: What has changed in the network since last time I was inspecting the network? Which device (or its component such as line cards, power supply, one of its transceivers…) was removed from the network? Which new device was added to the network? Which IP address changed its location or type? Which links were changed in the network? Is there a new protocol adjacency for STP? Is there different IP next-hop for a given destination (both indicating logical topology change)?
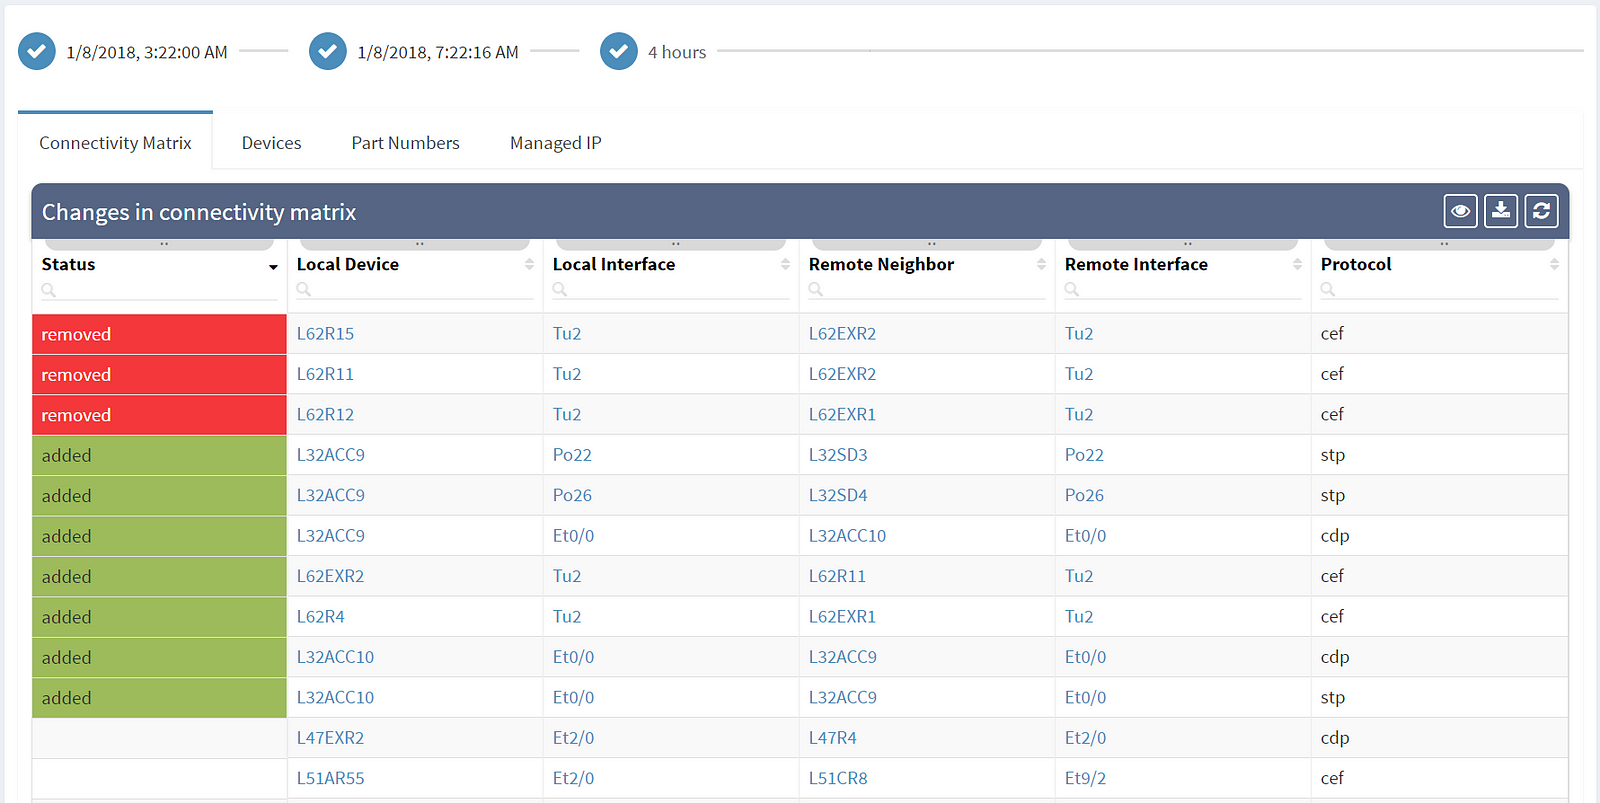
The first column shows the actual status — removed entities are in red, newly added entities are in green and the rest shows unchanged elements. Among the most common attributes displayed are the OS version (which should be as uniform as possible) and the serial number of the element (which if changed indicate HW replacement).
Are you interested to see all of IP Fabric's powerful features? Sign up for a trial or an online demo.


