Typically, an organization's network isn't a single thing. It's a collection, a network of networks if you will, which work together to deliver the connectivity from user to app, from sensor to data repository, which underpins application service for an organization.
There are networks of different types, using different technologies, connecting different domains, using multiple vendors; each must be interconnected and interoperable in order to deliver the packets which carry application data from application workload to user. The number and depth of these interactions bring complexity to the network of networks and with it being dynamic and alive, this complexity grows daily.
The biggest challenge that modern network teams face is managing that complexity, along with the scale that adoption of connected applications has brought to the modern IT landscape. And as network engineers, not only are we constantly reminded that the best way to cope is to automate, but we recognize the necessity.
The idea is to maintain a centralized management point for the network which can provision service and deploy change using as few touchpoints as possible. Typically, that might mean introducing:
These approaches all have pros and cons of course, but typically are very focused on delivering an outcome for a specific task, for a specific vendor's equipment, or in a specific network domain. As such, testing of success of automation tends to be focused and task-based too. And while this has a certain level of value in ensuring that tasks themselves aren't broken, it's hard to verify that the impact of change to the network isn't farther reaching, or that further change is required to enable the capability we’re trying to introduce.
Consider the case where you create a new subnet in your private Cloud instance – this is easily verified that it has happened through the API into your favorite Cloud provider. But does that mean it is available and usable? Not necessarily – we might need to make sure it is advertised into our on-prem network, redistributed over our SDWAN into our campus, and that policy is updated to allow traffic to pass to it.
Network Assurance has the goal of validating that the network is operating the way you intend it to and enabling corrective action when your dynamically changing network drifts too far from your intended state. Importantly, the scope for network assurance is the whole network end-to-end, not limited to a specific vendor or domain.
By using IP Fabric's automated network assurance platform, it's possible to validate:
IP Fabric uses snapshots of this model to build up a picture of changes across the network over time. Those snapshots can be of the complete network, scheduled regularly, or they can be ad hoc or partial views, depending on the desired effect (particularly useful before and after change implementation).
And this is the key. When changes are made in the network, it is not likely to be enough to simply test that the desired configuration has been pushed to the device. The impact of that change is likely to be felt further afield and so it is necessary to look more holistically at the outcome, as looking at the change in isolation can be misleading. Is a successful config push successful if it’s impacted your network elsewhere, and therefore your end-to-end service?
You can examine the state of the affected device and that may help but in reality, the best outcome is to validate that once tasks are completed, the overall change has had the desired impact on end-to-end service. And naturally, the only way to accurately verify that end-to-end behavior will be as expected is to not limit the scope but test against a model of the whole network.
And as IP Fabric's API allows snapshot creation and refresh, along with querying of those tests, it is the perfect tool to incorporate into an automated workflow to carry out that big picture validation.
Recently, the IP Fabric team was in Las Vegas, where we shared the stage with Itential at Tech Field Day Extra at Cisco Live 2022. We showcased what it means to integrate network assurance into real network automation processes, and how that turns Network Automation from a point solution to a small problem, into a key component of the complete Self-Driving Network.
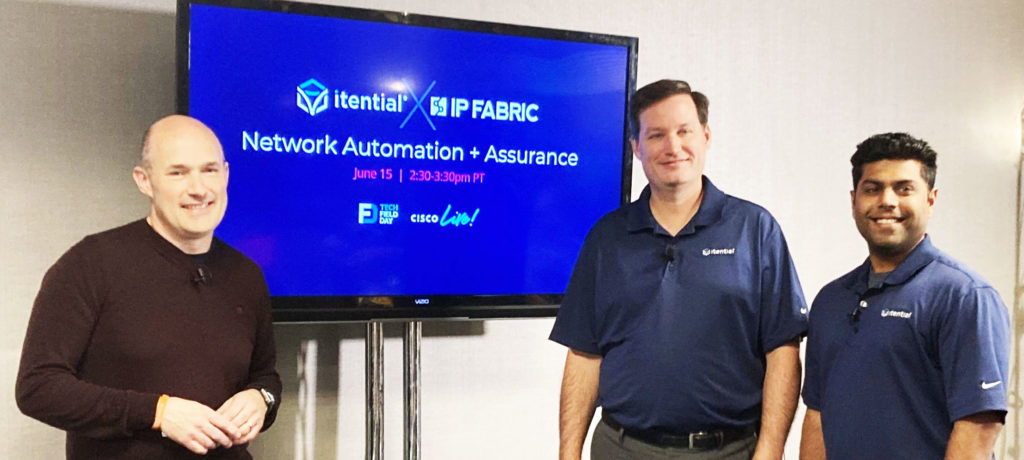
Watch the Tech Field Day video below to see exactly how smart integrations can accelerate your network automation:
WATCH: Scaling Network Automation (with Itential)
WATCH: Closing the Loop with Network Assurance (with IP Fabric)
WATCH: Integrated Network Automation and Assurance Demo with Itential & IP Fabric
We're proud to share that IP Fabric earned top billing in Gartner's Cool Vendors in Network Automation list for 2022. Gartner members can access the report here.
While network automation garners a lot of interest from large enterprises with complex networks, its successful implementation lags behind. Fear of change, resource strain, and operational and organizational labyrinths to navigate are all factors that hold organizations back from fully embracing the inevitable.
That's where cool vendors come in. We're here to bridge that gap between understanding that network automation will bring agility, efficiency, and simplicity to your network, and actually making it happen by directly addressing the roadblocks in your way. Cool vendors aren't afraid of breaking new ground - we march forth, illuminating the road to innovation in your network.
We use automated network assurance to revolutionize how enterprises manage increasingly complex networks by bringing robust visibility and insight into network behavior.
We're not just giving back time and resources to our customers, but also changing how an entire industry approaches networking - taking it from reactive to proactive, and eventually, predictive - a self-driving network. On the road to this goal, we offer solutions to problems faced by network engineers in the spaces of network visibility, automation, security assurance, trouble resolution, and multi-cloud networking.
Our straightforward approach makes easily viewing inventory, ensuring configuration compliance, navigating topology
views, state information and analyzing end-to-end forwarding behavior staples in a network engineer's toolbox. Consolidating these functionalities in a single multivendor product that extends to the public cloud is a bit of magic we've spun up to help clear your path to innovation.
So, as the cool kid on the block, how have we mapped out this road to network automation adoption?
We've outlined the adoption of IP Fabric (and therefore, your confident approach to automating your network) in three clear phases:
Shine light into the dark corners of the multi-vendor network for a full picture of the inventory, configuration, topology, and state with automated discovery and documentation. Only when you have a trustworthy baseline can you truly know your network, which is an essential start to any automation project.
Rich data, path simulation, change validation, intent verification, data democratization - IP Fabric uses data from across your entire network to enhance your operational process. As your team experiences how intelligently sharing and leveraging data across your operational ecosystem elevates systems, workflows, and processes, the value becomes undeniable and resistance to change is quelled.
Start integrating with other technologies to put the data intelligence from IP Fabric to work, expanding the reach of your newfound operational bliss. For example, start asking your network questions and getting immediate answers (directly in Slack or Teams if you’d like) opening up a world of possibilities.
The insight IP Fabric provides empowers teams to think in cool ways about how to innovate your network while keeping the infrastructure secure and changes aligned with your intent.
Check out how IP Fabric & Nautobot ChatOps bring innovation to your network at Network Field Day 27.
To our delight, our friends over at Itential join us on the list of Cool Vendors. Together, IP Fabric and Itential work to design and deploy network automation workflows that are validated by measuring the end-to-end behavior of the resulting network, comparing it with its previous state and the desired outcome.
Another great example of how we enhance your network toolset.
If you want more insight into IP Fabric, or would like to see how it can revolutionize your network, get in touch with our team and request a demo.
Follow us over on LinkedIn for more updates.
After presenting IP Fabric at Networking Field Day 23, a number of Twitter threads started probing at the idea of Intent-Based Networking (IBN) - is it simply a marketing term that vendors use to sell more gear or does it have a deeper meaning? And what impact does it have on the network team? Does it automate them out of a job?
It’s safe to say that every modern business depends on its IT, and the network provides the underpinning to all the systems on which we rely. Business needs IT to just “be”. It should be permanently available, supporting business process with a minimal operational overhead. But it’s obvious to anyone in IT just how big a stretch that is due to many factors, not least:
Automating regularly occurring network tasks helps reduce the operational overhead of running the network, of course. You might use controllers or scripts, templates, zero-touch provisioning and automated change mechanisms. There are plenty of benefits in being able to treat a network domain as a macro entity and allow the micro tasks that are required to maintain the environment be taken care of by automated processes.
However, it's vital that we fully understand the networks we build. This ensures that the automation platform is deploying configuration with the expected outcome. Configuration still happens in a network domain on a box-by-box basis. The process uses configuration detail from a knowledgeable and experienced network engineer. In reality, the automation system functions like a fast, consistent network analyst. It makes and tests changes and fetches data about operations, based on rules defined by its "superiors"!
IBN takes the automation approach to the next level. Given the business intent for the network, you first translate it to a set of technical capabilities, then:
What we’re really doing here though is subtly evolving the roles of the network architect, designer and engineer.
The business intent may include such abstract ideas as “make sure that my critical applications are always available”. The traditional approach would involve a network architect in translating that intent to some design criteria: “always use High Availability, no SPOFs, converge my routing protocol within x seconds, define QoS across the network” and so on. A network designer will then take those principles, and looking at each network domain in turn, consider how to turn out specific bills of material, Layers 1, 2 and 3 topologies and designs using specific vendor platforms. The network engineer would finally deploy this. They would turn the designs into actual configuration, and then manage and maintain the resulting network.
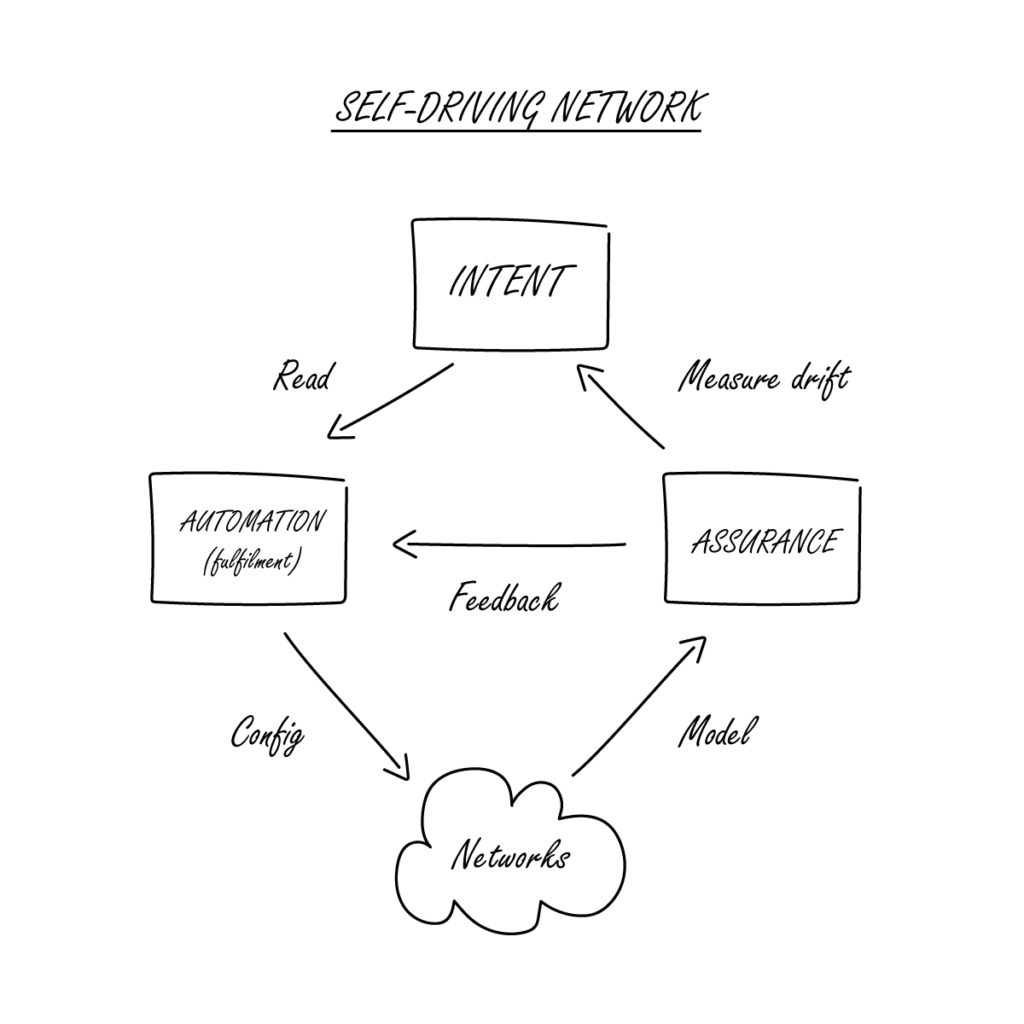
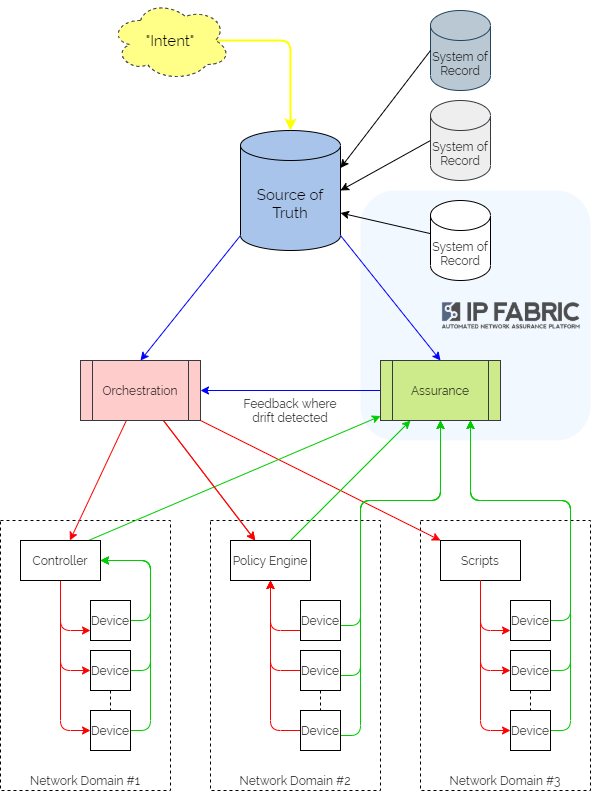
IBN automates much of this process, taking business intent and delivering a self-regulating, self-healing network environment.
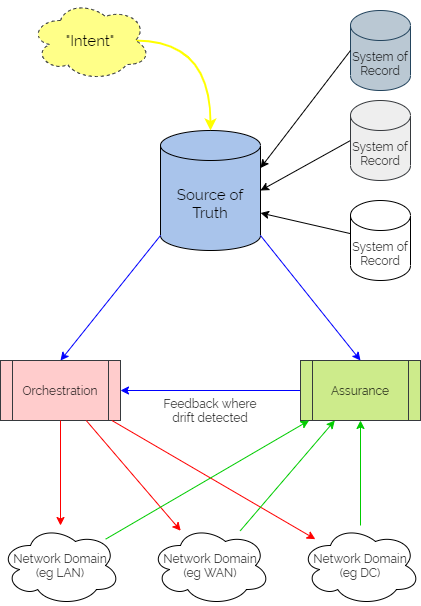
It centres on a “Source of Truth” (SoT) – a picture of the network as it is intended to look, developed from the business intent using logic defined by the network architects and designers. It is then used as a central reference point for all intended configuration data – often referring to other “Systems of Record” as definitive reference sources where necessary.
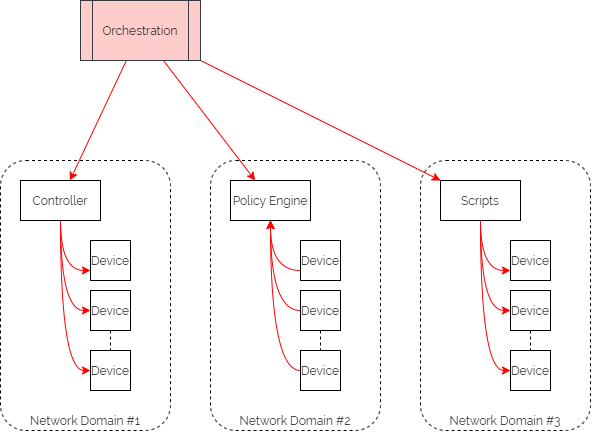
Updating intent in the SoT triggers orchestration workflows to render the configuration in the different network domains. These configurations might include organisational or industry Best Practice templates, security policy data or specific network domain detail to support the intent. And typically the orchestration workflows then kick off automation tasks in controllers or as scripts to interact with different sets of network devices, potentially from different families from different vendors. Subsequently, they might also update policy engines which devices are using to refer to without having to keep local copies of configuration or policy.
Assurance workflows are built first to harvest state information from the network devices and controllers. They then analyse that data to ensure that they are meeting the intent.
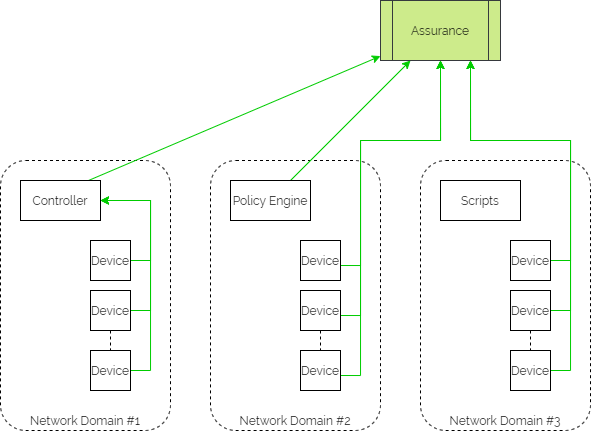
And if intent is not being met, the assurance element then triggers a feedback loop into the orchestration platform to update configuration through the automation layer.
There are of course a few words of caution.
And so you can see, the network architect, designer and engineer are still key - they simply demonstrate their knowledge and experience in different ways.
As we mentioned in our earlier post, IP Fabric is not well-positioned as the SSoT for intent, simply because the product focus is on being the informational reference for the actual network state.
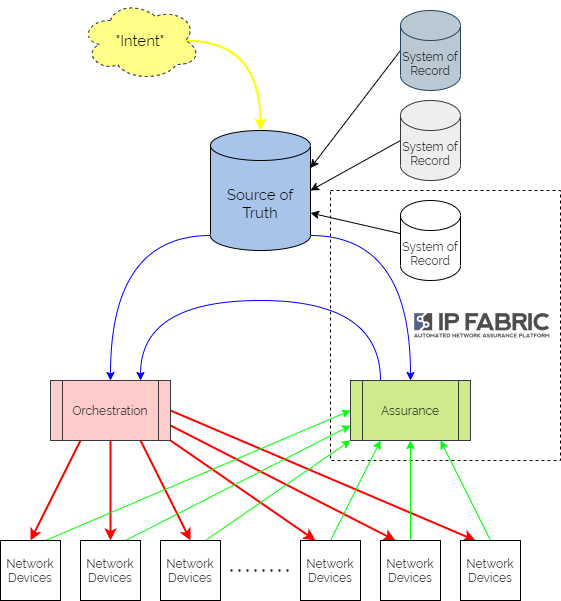
IP Fabric can sit squarely at the heart of your intent-based networking ecosystem however. As it provides full inventory, configuration and state visibility of the entire network, it then becomes well-placed to serve as the System of Record for those elements. It would be used to carry out an initial population of the Source of Truth, and then as a regular source of true-up data to ensure that the SoT genuinely represents the active network.
As IP Fabric is already harvesting all the network data, it is in a great position to begin carrying out the assurance elements of the IBN system. We would define rules in IP Fabric that validate elements of configuration and state, which are checked at every snapshot. Rules are not only created through the UI but also through the API. This means that they can then be pushed to the platform from an agent acting for the Source of Truth. Webhooks can then be fired from IP Fabric at calculation of those intent verification rules, to provide a feedback mechanism to the orchestration platform should intent not be met.
The real beauty of using IP Fabric with its complete network database and open API is that it can then serve as a reference source for whoever else needs that network data. The same system operating as part of the IBN platform could thus be used to keep monitoring platforms up to date, feed data to ITSM tickets at creation time, and later be queried through slash commands in Slack.
And so, the network engineer already has all the detailed configuration and state data they need to maintain, troubleshoot and deploy the networks they run. The network designer has an understanding of inventory, and topology relatinships at all layers. And the network architect can then get a picture very quickly of the current state of the interoperation of the network domains to help plan for transformation.
If you have found this article helpful, please follow our company’s LinkedIn or Blog, where more content will be emerging. If you would like to test our solution to see for yourself how IP Fabric can help you manage your network more effectively, please contact us through www.ipfabric.io.
A lively debate sparked up after Networking Field Day 23, where we presented IP Fabric to a panel of delegates and hundreds of eager online viewers. Could we class our solution as a "Source of Truth" for the network? The conclusion was "Yes". And "No". So why the confusion and what did the question actually mean? I thought I'd try and get to the bottom of it!
Network automation has come a long way. Once, that meant CLI scripts that you created by "mail merge", then rolled into your network over a telnet session. Now we have sophisticated automation platforms that take desired state and through configuration templates, functions, modules, and APIs, can push that state into network devices (and if you're really lucky, roll them back again if they didn't complete.) But where does that desired state come from? You need to decide and record which features and parameters you want to enable and push out to which devices ...
And so you create a database - a bunch of spreadsheets, SQL, DCIM (Data Center Infrastructure Manager), or IPAM (IP Address Management) system - containing those feature definitions and parameters. And your templates are rendered using the data from that system into intended config state. This is typically referred to as the "Source of Truth", SoT (or sometimes "Single Source of Truth", SSoT).
The idea is that there is only one place to store that data - the ultimate reference source of desired configuration. Update that and the implied intention is that the network config is required to be changed. Typically that information would be version-controlled and tracked, often using git or a similar VCS (version control system).
... when it doesn't hold all the information in one place! A Single Source of Truth can simply be a placeholder or proxy for the collection of reference sources for individual pieces of the network data puzzle.
You may use an IPAM system to record the definitive IP addressing schema that you want to use. You may use a CMDB to track your network device inventory details. These would be referred to as Systems of Record. Ultimately your network automation needs to access information from both of these sources in order to render configurations. So an SSoT would zip that information together as required.
Within the accepted conventional definition, not really. As the inventory, configuration, and state data in IP Fabric is harvested from network devices, it doesn't represent intended state. It isn't able to be changed or updated manually. IP Fabric builds vendor-neutral snapshots of the state of the network as a whole. It reflects - in great detail - the state of the network as it is operating at a point in time. It is queried through Web UI or API, visually or in tabulated data. As such, it doesn't store intended state, but the actual state.
But that's not the complete story. Because along with the data from the network, we can build a series of intent verification checks. We use filters and classifications on that data to verify that the active network complies with an intended state. For a simple example, we can ensure that all network devices are configured to a specific set of management parameters. We verify that NTP, SNMP, and syslog match a set of criteria at every snapshot, and present a compliance report.
The 150+ embedded verification checks that ship with the platform range from the simple (eg checking where VLAN 1 is in use) to the complex (eg ensuring Spanning Tree root and FHRP active gateways align) and everything in between (eg checking MTU sizes at either end of a link match).
Whilst there is a mechanism to store intent in IP Fabric, it isn't used to render the intent as configuration. Verification checks are run against every snapshot and provide us with a way of validating intent on an ongoing basis.
We also carry out simulated end-to-end path checks at each snapshot. This allows us to validate that paths are as you expect them, and firewall rules allow connections only as intended.
All of these intent verification checks are built through either Web UI, or IP Fabric's extensive REST API. This provides us with the ability to update the intent verifications in IP Fabric while you render the configurations from the intended state data, thus confirming at each snapshot that the state is matching the original intent from the SoT.
IP Fabric's new webhooks feature which allows us to notify an external platform when verification checks are completed. This can be used to provide a feedback mechanism for when actual state has drifted from intended state.
In IP Fabric we compare the intent with the network state that is discovered at the time of the snapshot. If for some operational reason, a part of the network is down, or if a partial snapshot is run to validate a change in a particular area of the network, then we only have partial data. And that is not useful for expressing intent across the whole network.
It is more optimal to use IP Fabric in tandem with a dedicated SoT like the open-source project Netbox. IP Fabric would then be used to cross-validate that the data in the SoT is correct and up to date. This effectively treats IP Fabric as a System of Record for active network state. An automation platform like Ansible might then be used to render configurations.
Using the API, IP Fabric intent verification rules can be built from the data defined in the SoT to confirm that the network configuration and behaviors matches the intent expressed in the templates. If state doesn't match intent, webhooks can be used to notify the orchestration/automation platform that adjustments need to be made. So not only would we automate the network device configuration from the SoT but also IP Fabric configuration!
Based on current accepted definitions, IP Fabric would not be considered a "Single Source of Truth" for intended state. It would be more accurately considered a System of Record for existing network state. It would be used in conjunction with a SSoT to measure compliance with intent. And if required, it would then trigger activity to rectify any drift.
Look out for the next article, where we'll consider Intent-Based Networking in a little more detail!
If you have found this article helpful, please follow our company’s LinkedIn or Blog, where more content will be emerging. If you would like to test our solution to see for yourself how IP Fabric can help you manage your network more effectively, try our free online demo here: Self-Guided Demo.
Multicast routing and related implementations can be a real pain. If you want to make a network engineer nervous (and it doesn’t matter whether managing enterprise or service provider networks), just whisper few evil words “PIM”, “distribution tree”, “IGMP”. And if it’s not enough and you want to continue with fatality combo, follow that up with “RPF”.
Joking aside, how can IP Fabric help you with multicast?
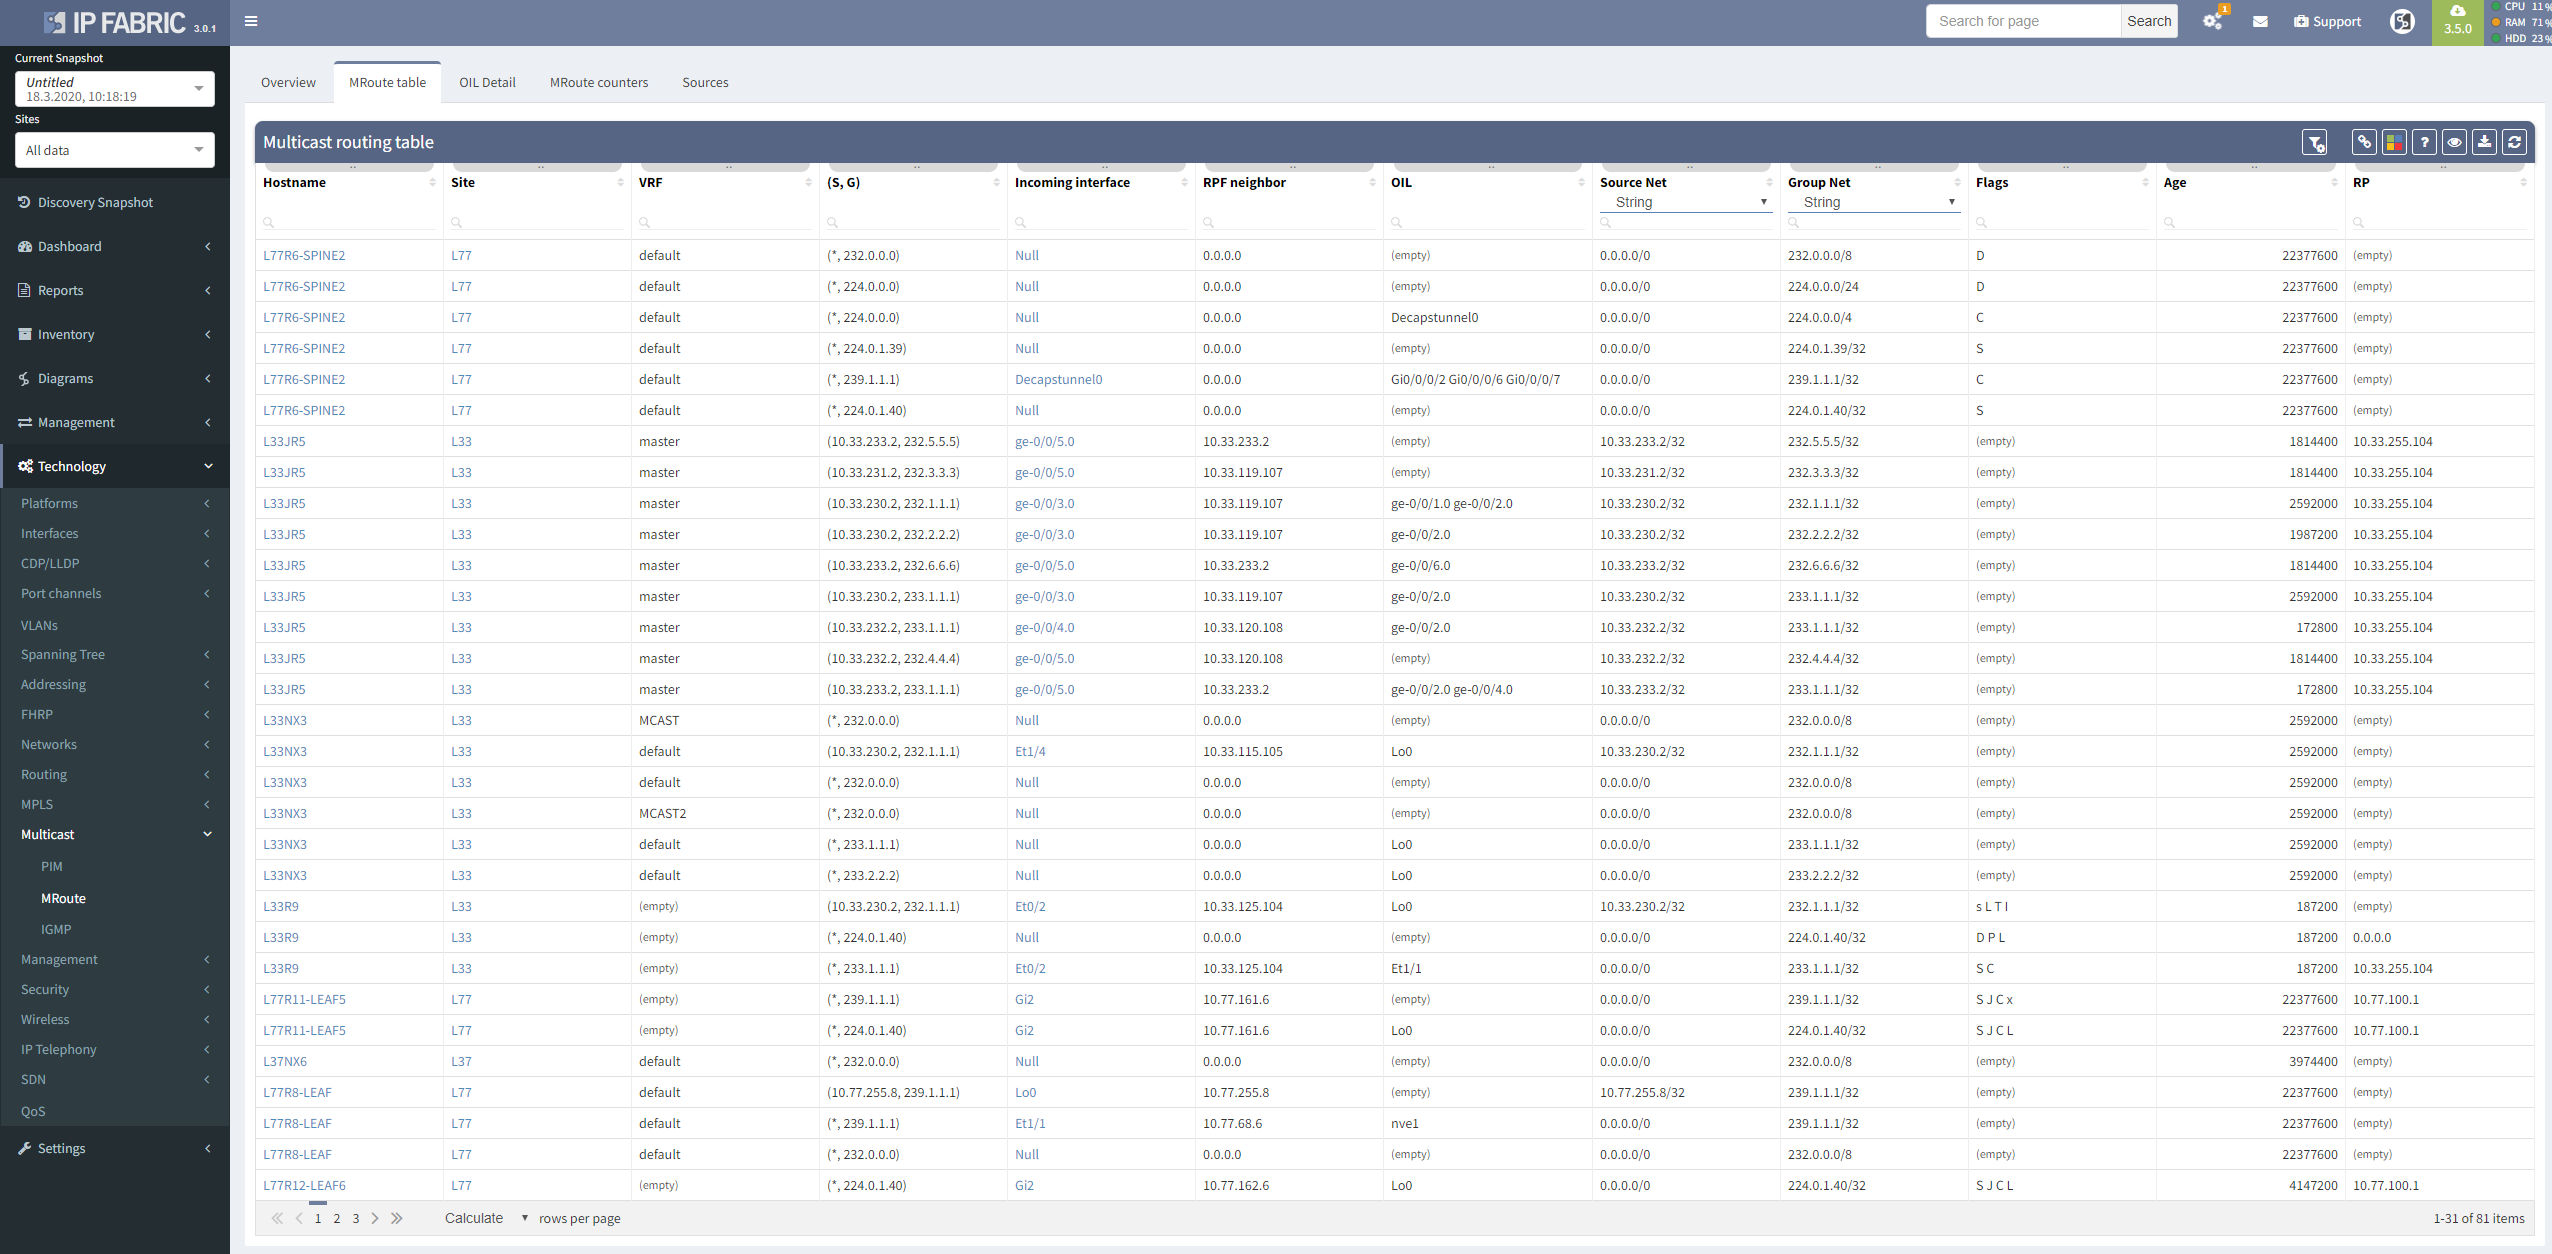
A good strategic overview is necessary to win a battle, here represented as a list of routers where a multicast routing table is present, with a number of entries for each router.
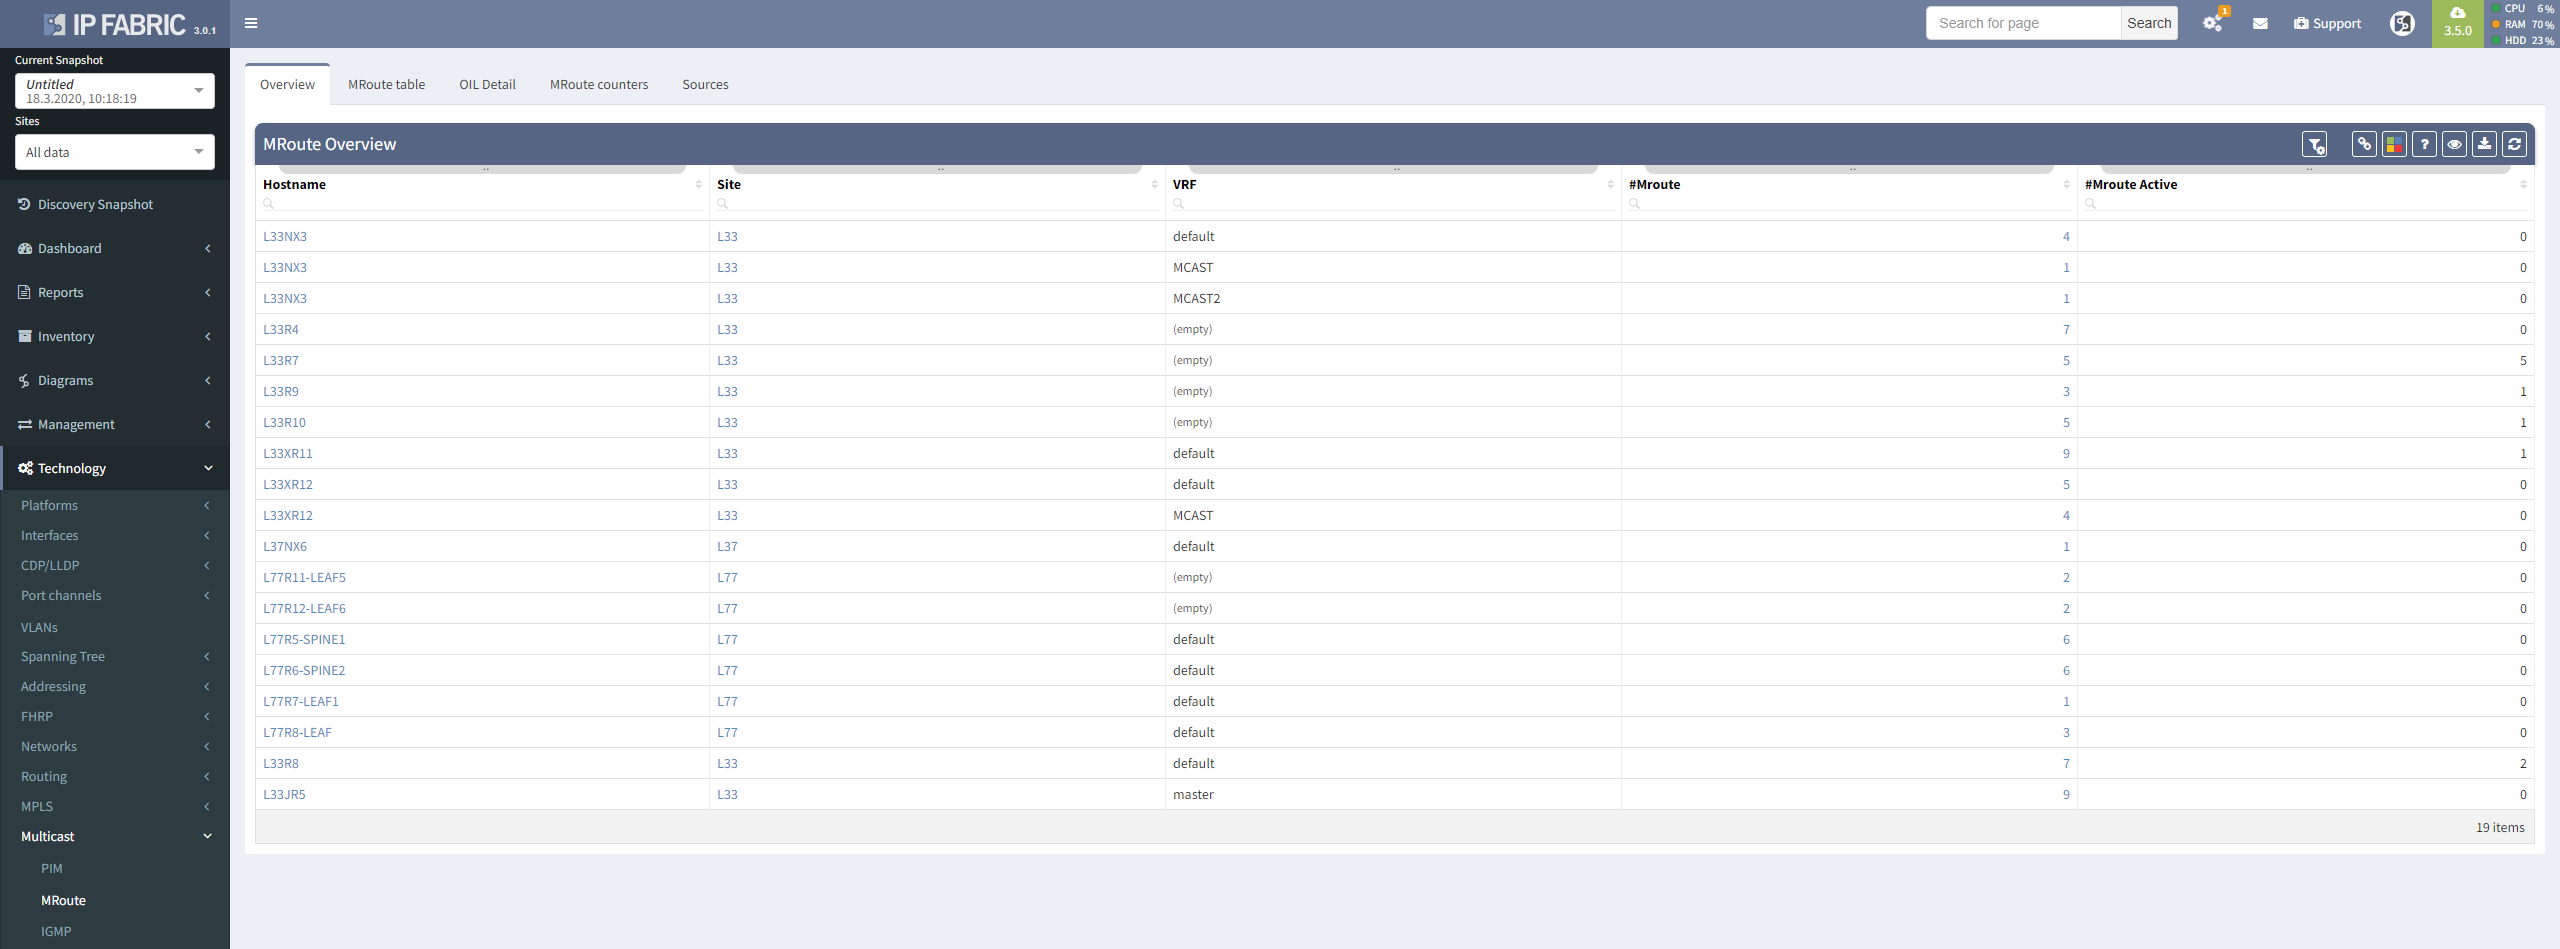
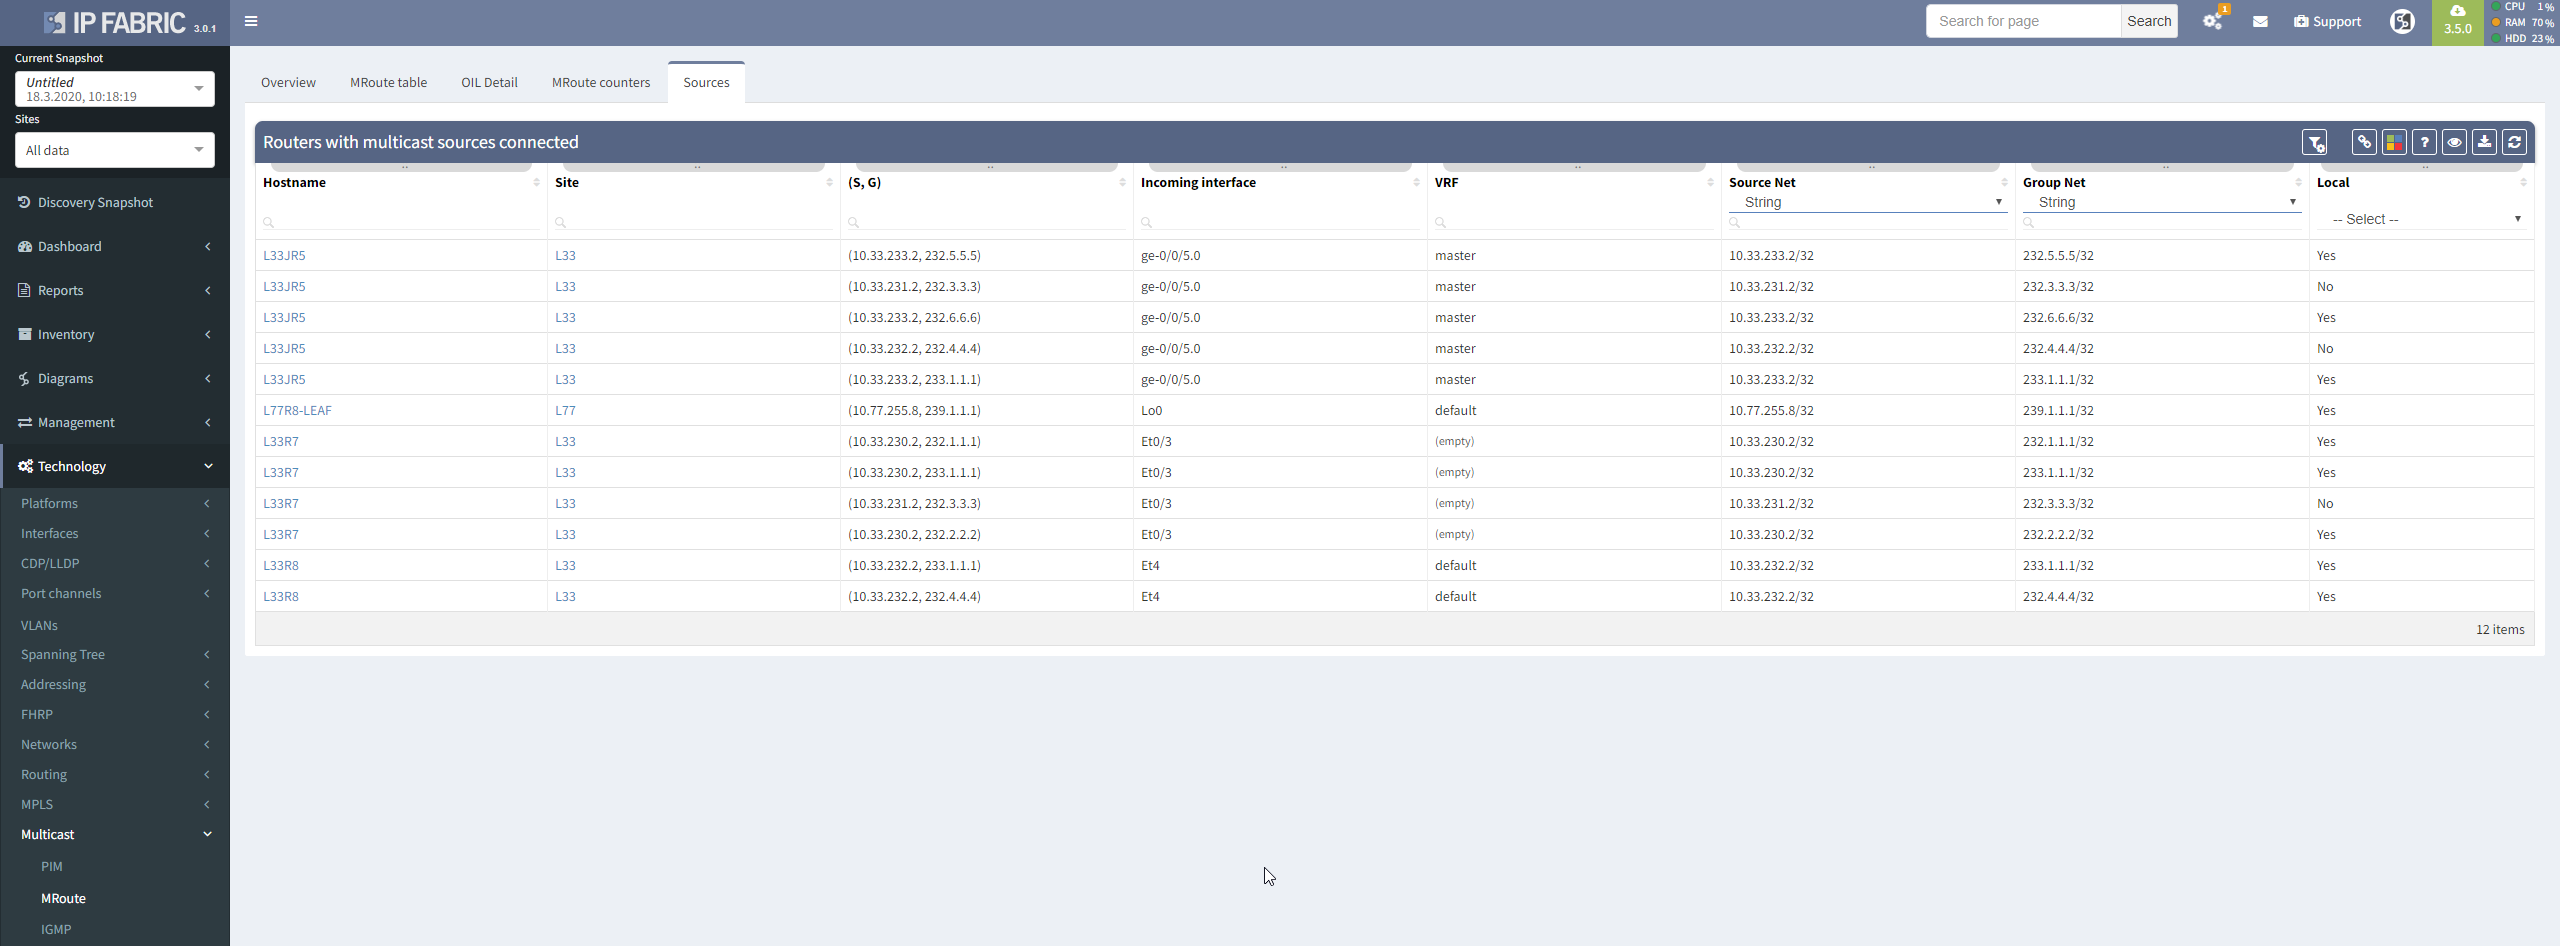
Thanks to our intelligent network model, we can detect not only sources with IP addresses from directly connected networks, but also not directly connected addresses (for example used for Anycast SSM).
What would be multicast sources without multicast clients? IGMP group table will show us all interfaces with connected clients, including the subscription to specific multicast groups.

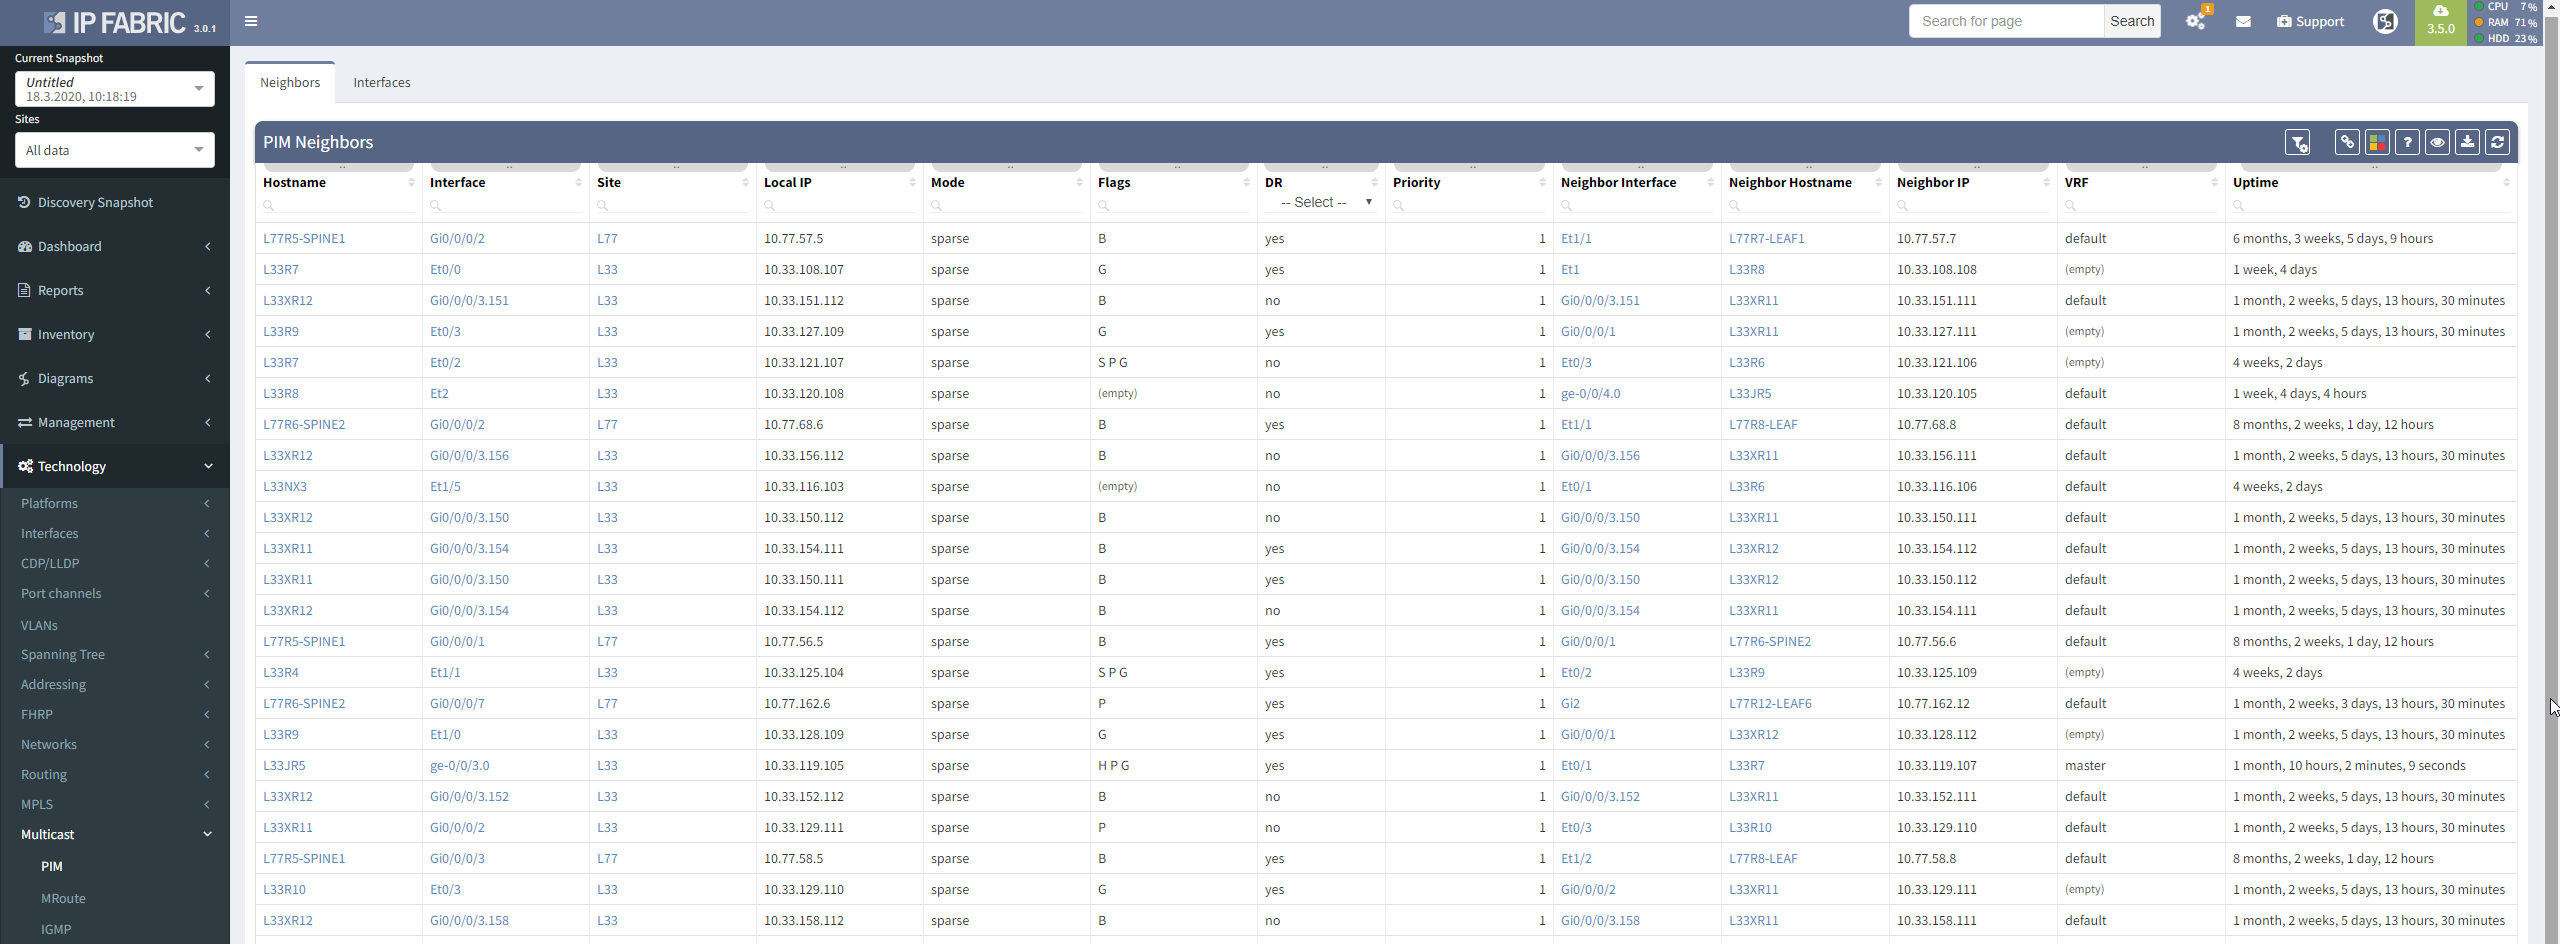
Multicast flows through distribution trees, which are build by PIM protocol with different flavors. For verification, you can use a table.
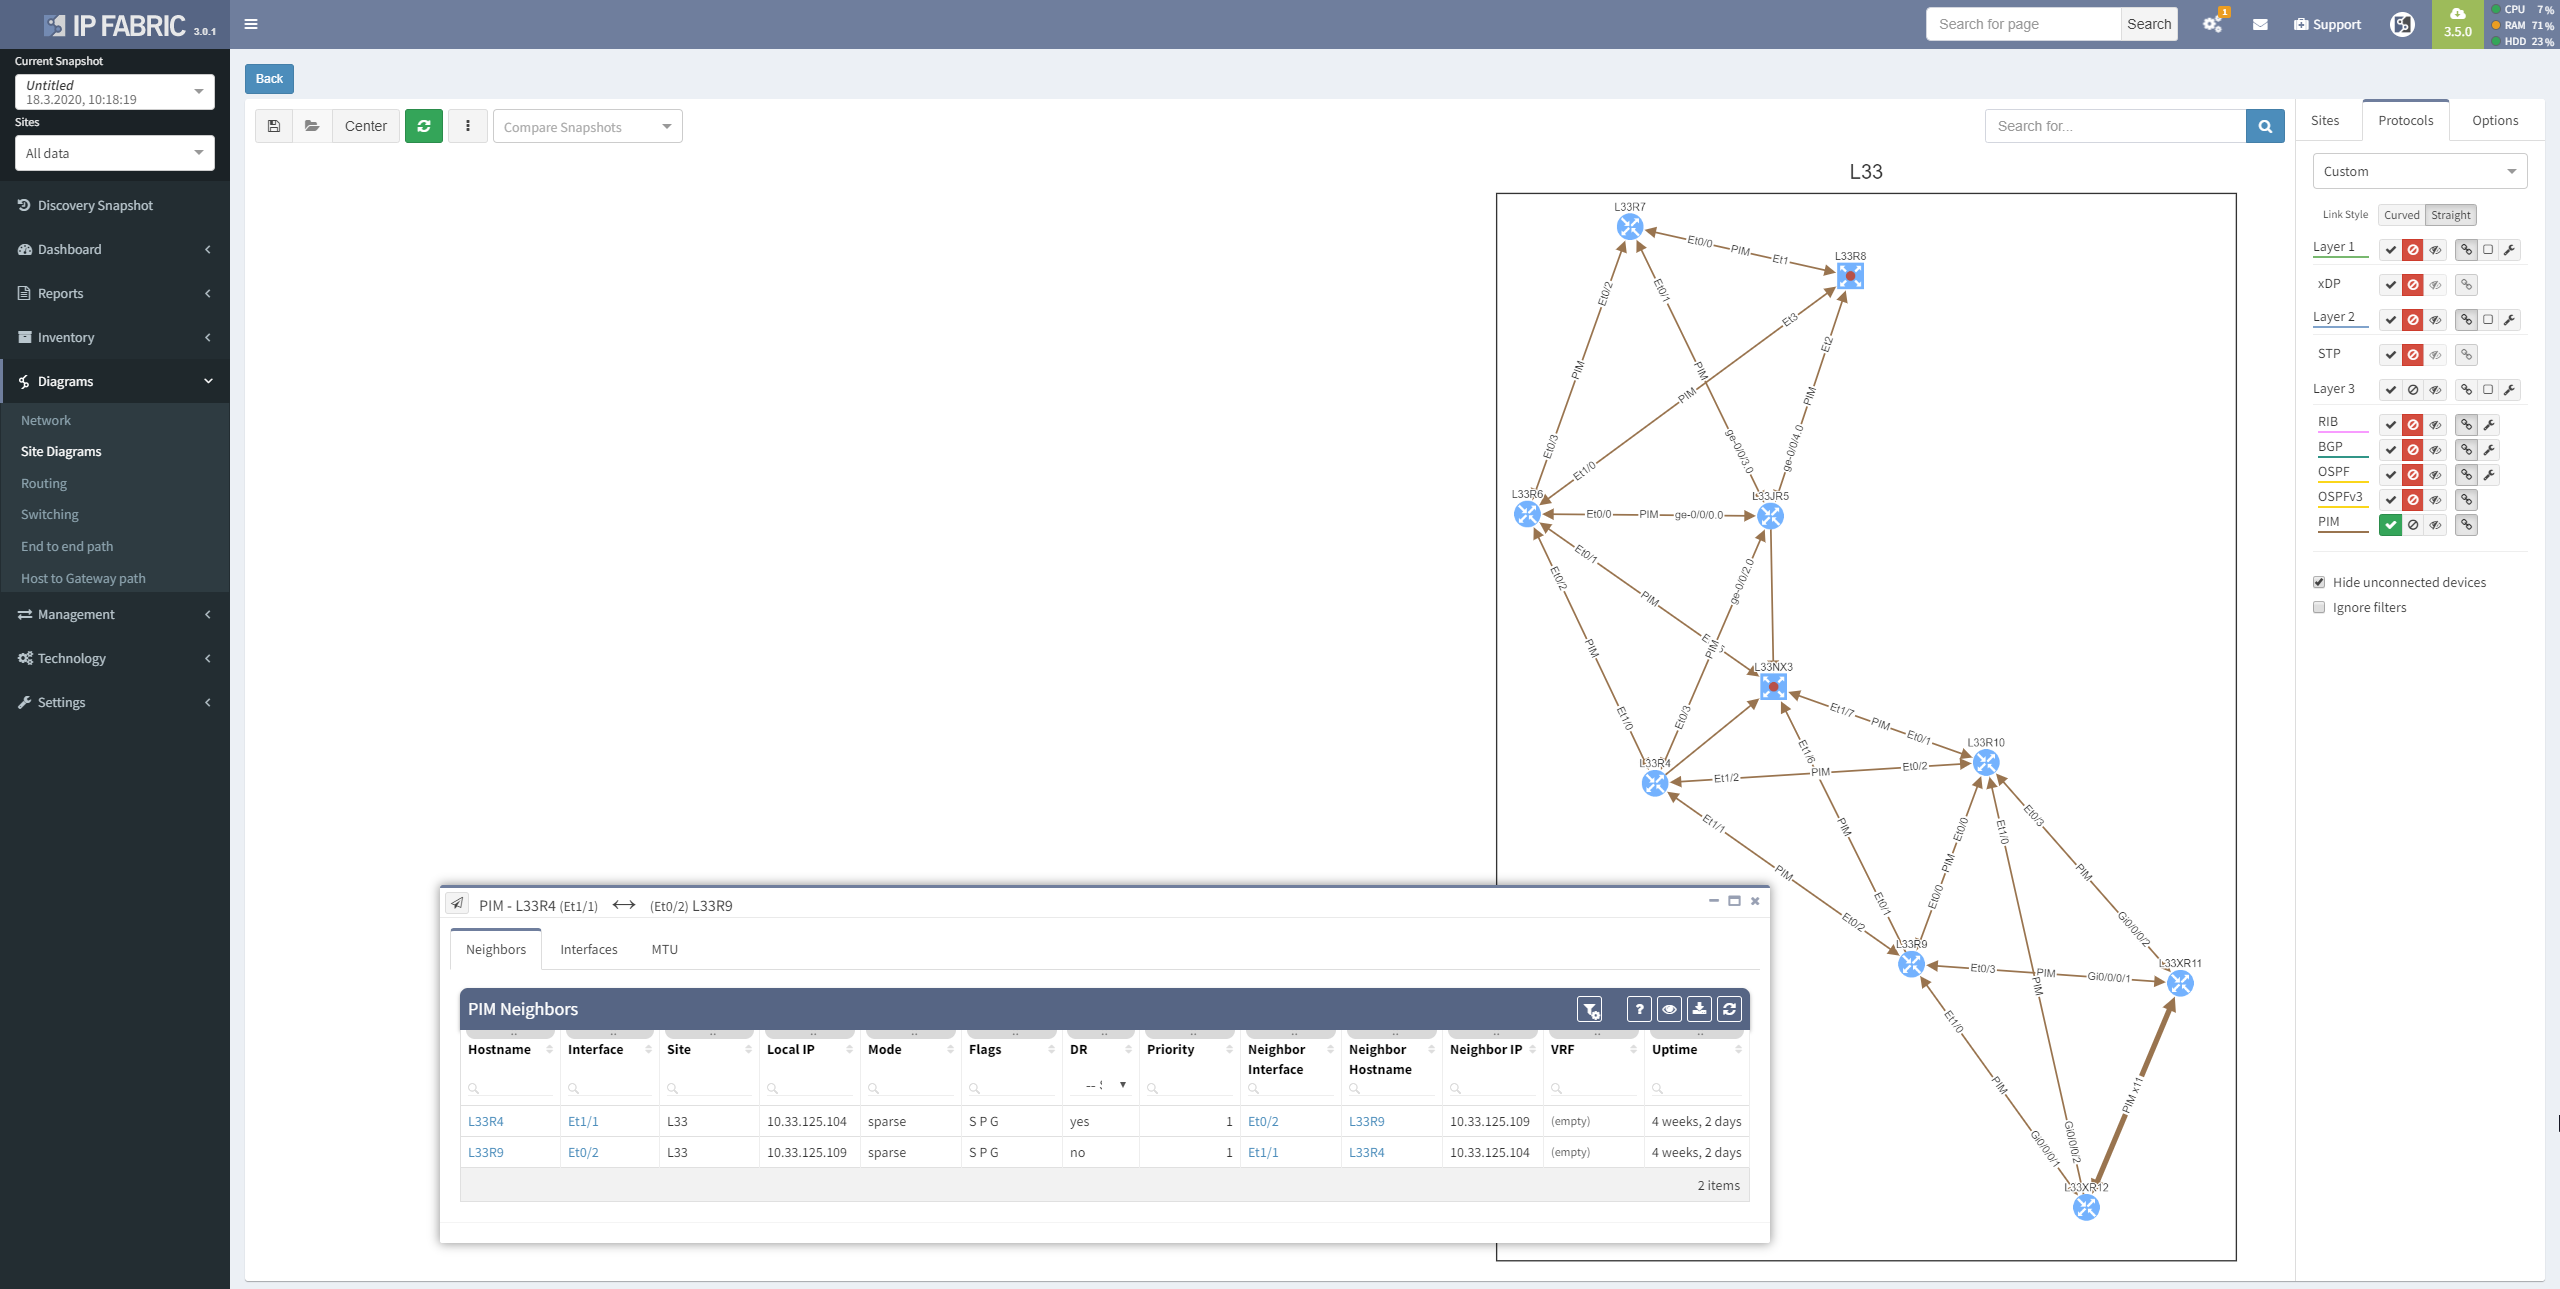
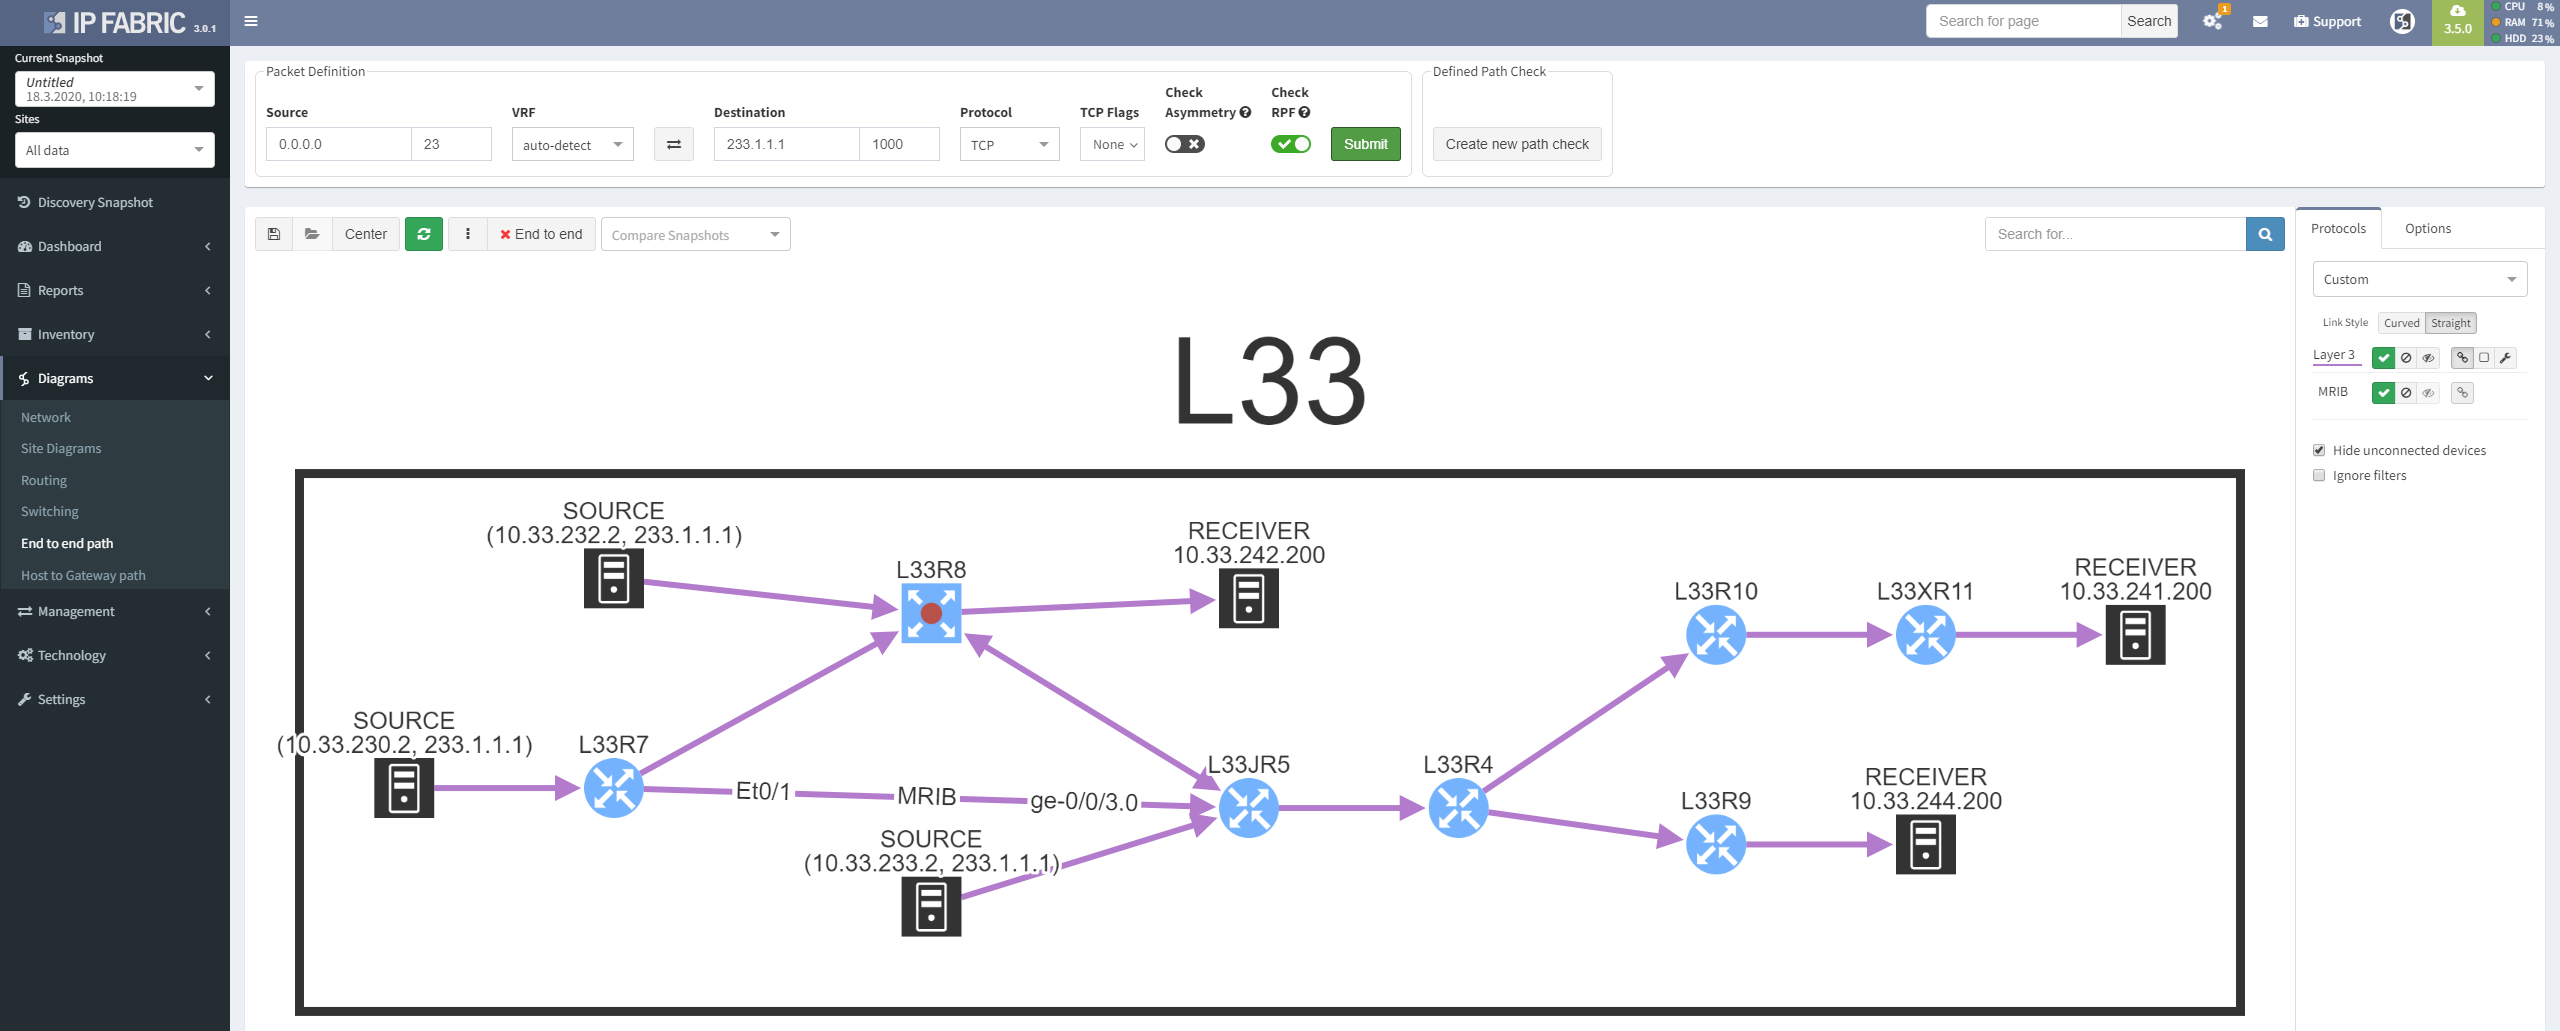
Better yet, you can visualize protocol relationships in the diagrams.
If you want to check how multicast traffic flows, you have to go to the multicast routing table and find the correct entry and copy packet from an incoming interface to all outgoing interfaces. On every single router. You know the drill.
Or you can let IP Fabric do all the hard work for you. You can use the path lookup feature to simulate multicast traffic flow and visualize the whole distribution tree for a specific group. And it even works for shared trees and multiple sources in the same group.
You know that desperate feeling. You configured everything right, sources are sending traffic, receivers are joined to groups, trees are built, but it still doesn’t work. Meet RPF checks in multicast PIM routing, which solve one of the biggest nightmares with operating multicast networks - troubleshooting multicast routing and RPF.
If your trees are not correctly aligned with unicast routing (multicast loop prevention) then say goodbye to your multicast traffic. But routers tell you where the problem is, you just need to be lucky or pedantically look everywhere. Or have a platform with multicast intent verification capability, such as IP Fabric!
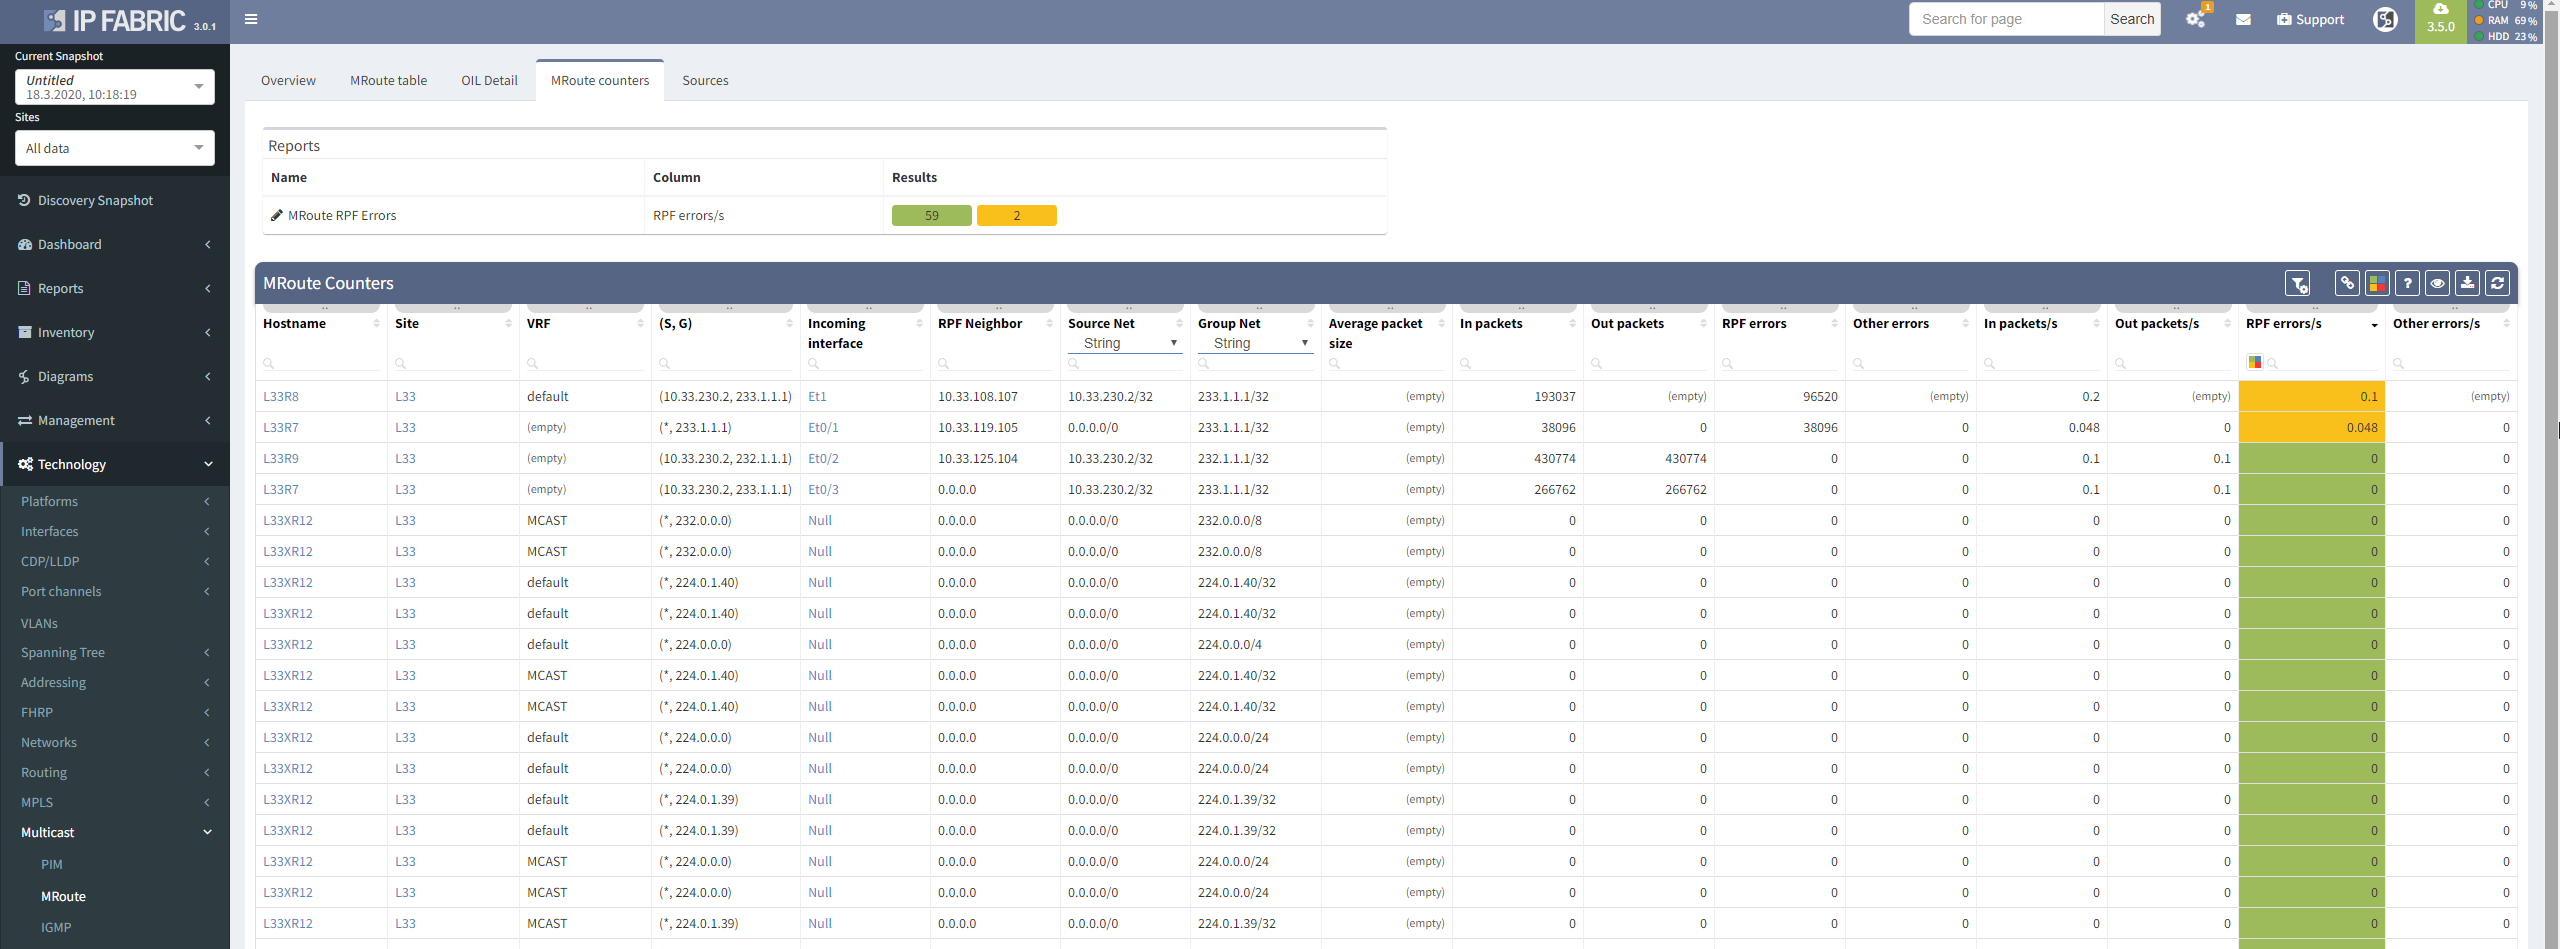
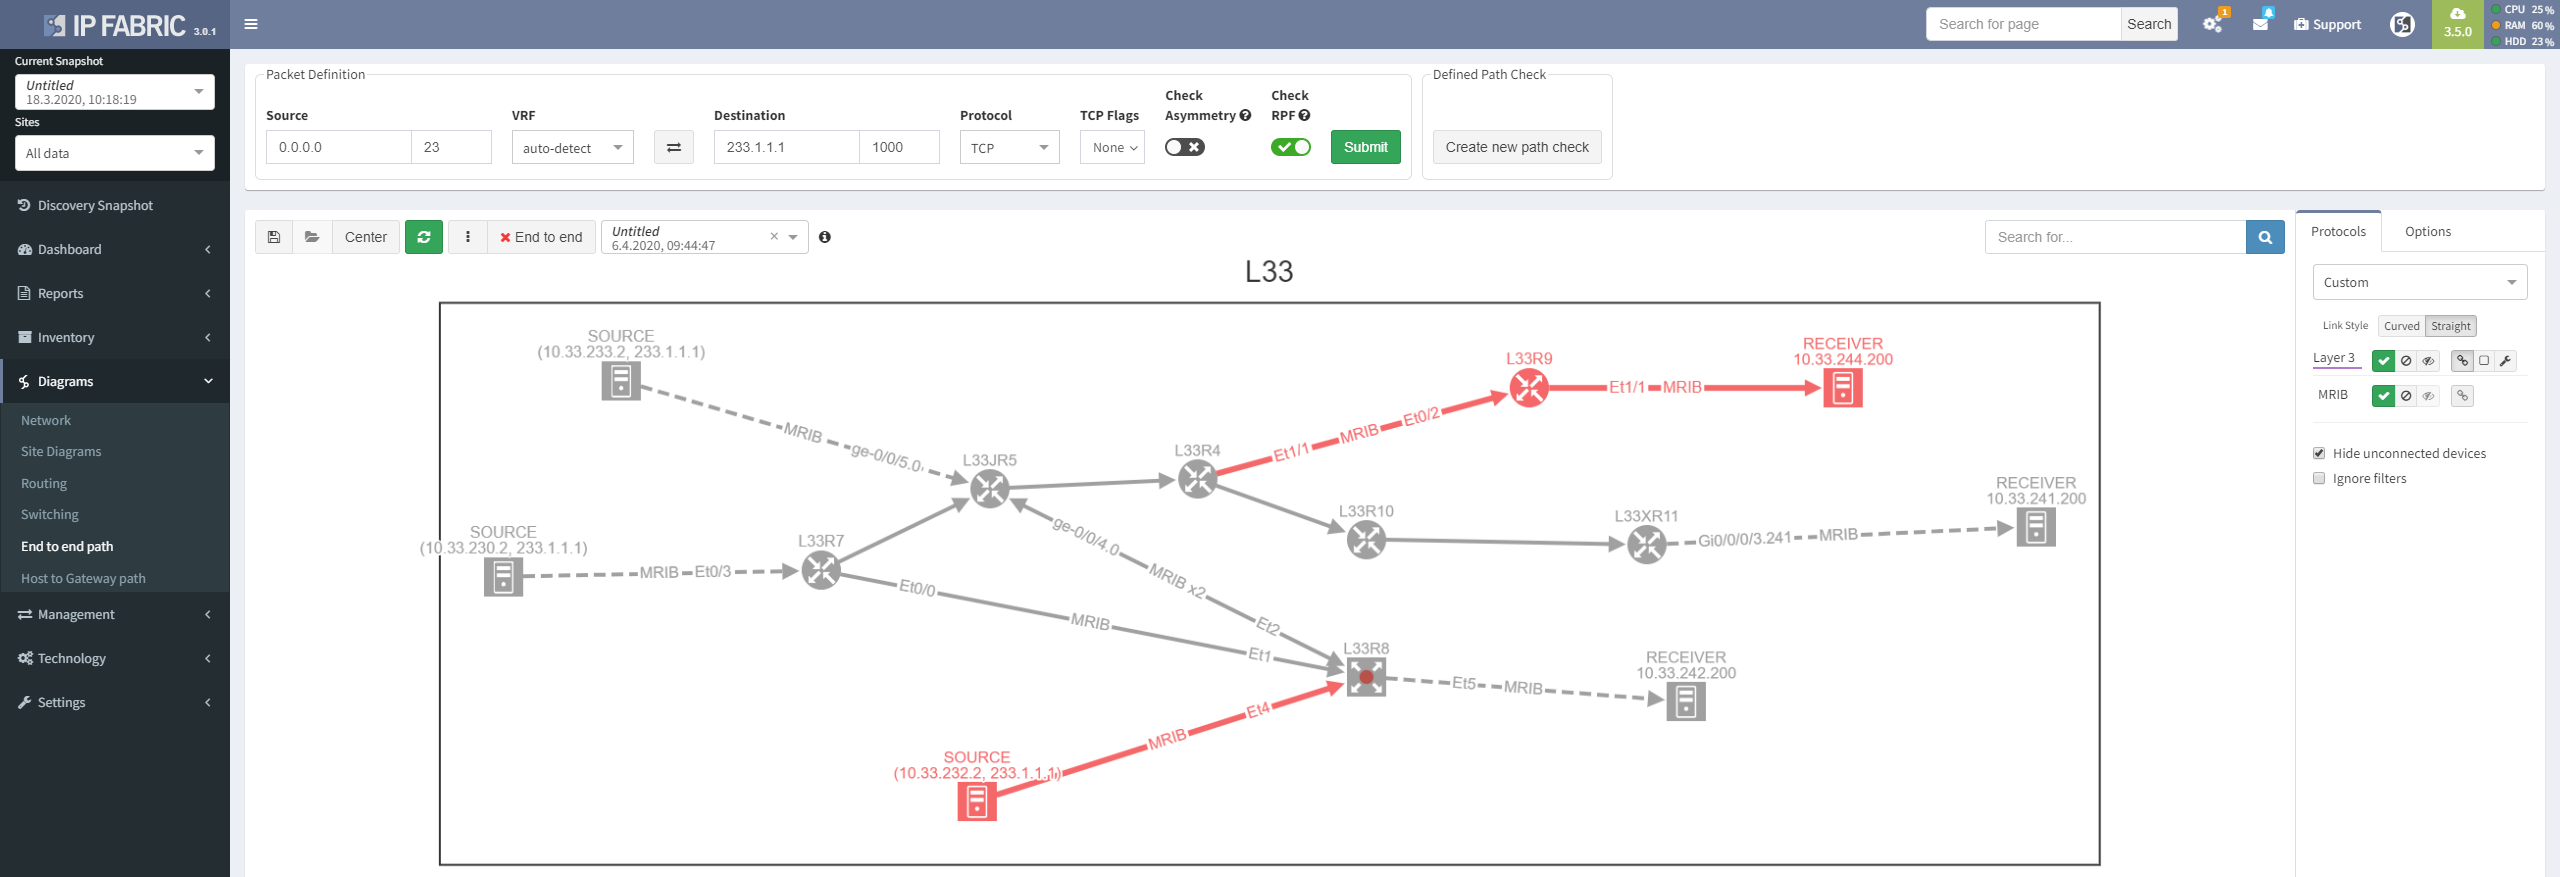
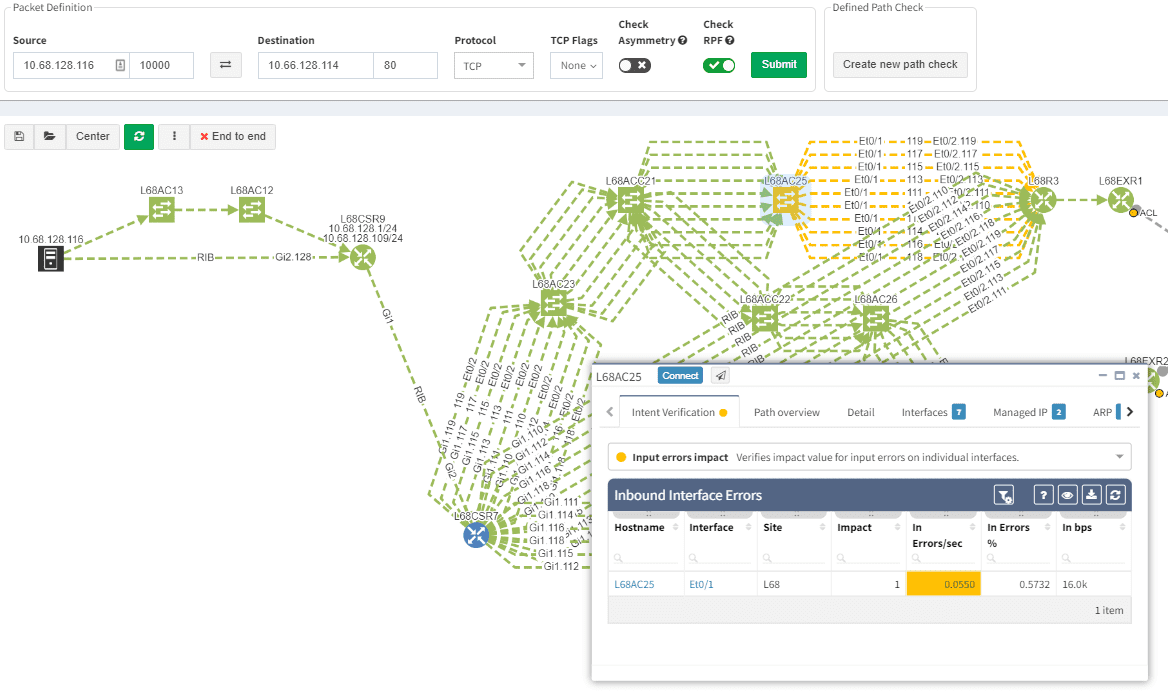
RPF issue can also be troubleshot directly from path lookup by applying intent verification, so you can see on which devices and interfaces RPF check fails.

"Hello. This is IT. Have you tried turning it off and on again?" With IP Fabric helping users with their IPTV or conference problems is much more deterministic. Why? Because you can go back in time and compare what was working before and compare with the state of the network right now. You can see missing sources, receivers or whole parts of the tree.
So far, we have covered all of the multicast routing. In the next release, we will focus on switched networks with IGMP snooping. Stay tuned.
If you have found this article helpful, please follow our company’s LinkedIn or Blog, where more content will be emerging. If you would like to test our solution to see for yourself how IP Fabric can help you manage your network more effectively, please contact us through www.ipfabric.io.
Good news everyone, another version of the IP Fabric platform is officially out. We have added more freedom to users in terms of platform configuration and above all, the intent-based network verifications can now be visually represented directly in the diagrams.
This greatly helps in many scenarios when specific part of the network is of interest. For example, one of the frequent scenarios in troubleshooting is finding an issue on the path. Now all paths between any two endpoints can be visually verified for a presence of an issue in an instant.
This includes paths with significant complexity, such as paths including Stack, FEX, vPCs, VXLANs, WAN accelerators, Lightweight Wireless and others.
Imagine troubleshooting a path for a performance issue, and trying to narrow down a problem, because it’s not feasible to check everything at once. Techniques such as resolving a balancing hash for a particular flow were utilized to know which link to focus troubleshooting on. These techniques were necessary to narrow down the issue, but not in finding the underlying cause. Well, now it is feasible to check all path elements at once, and see all affecting issues.
Now it’s even possible to “Check everything at once”. Not surprisingly there will be a lot of red.
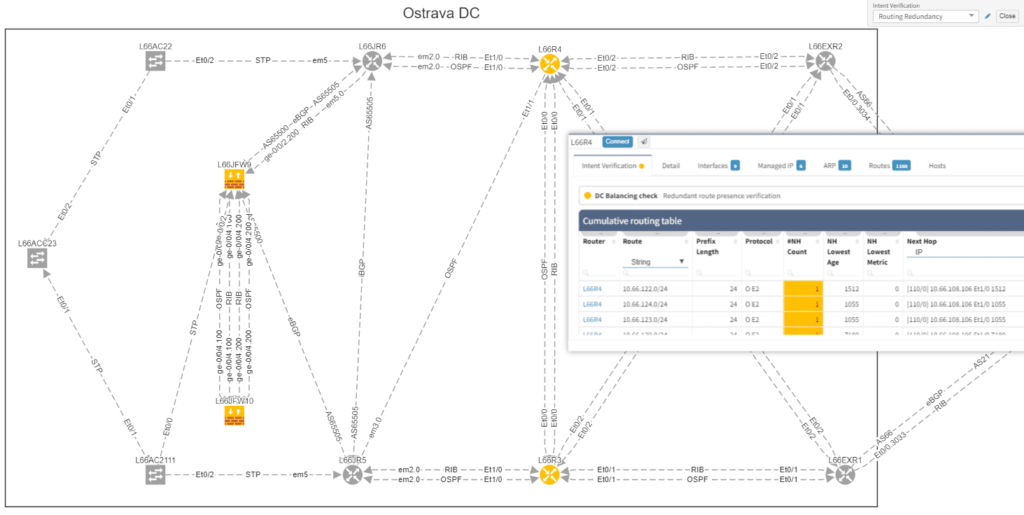
Of course, any intent verification group can be displayed separately. For example here we want to see only specific routing table entries which have routing redundancy issues in our datacenter.
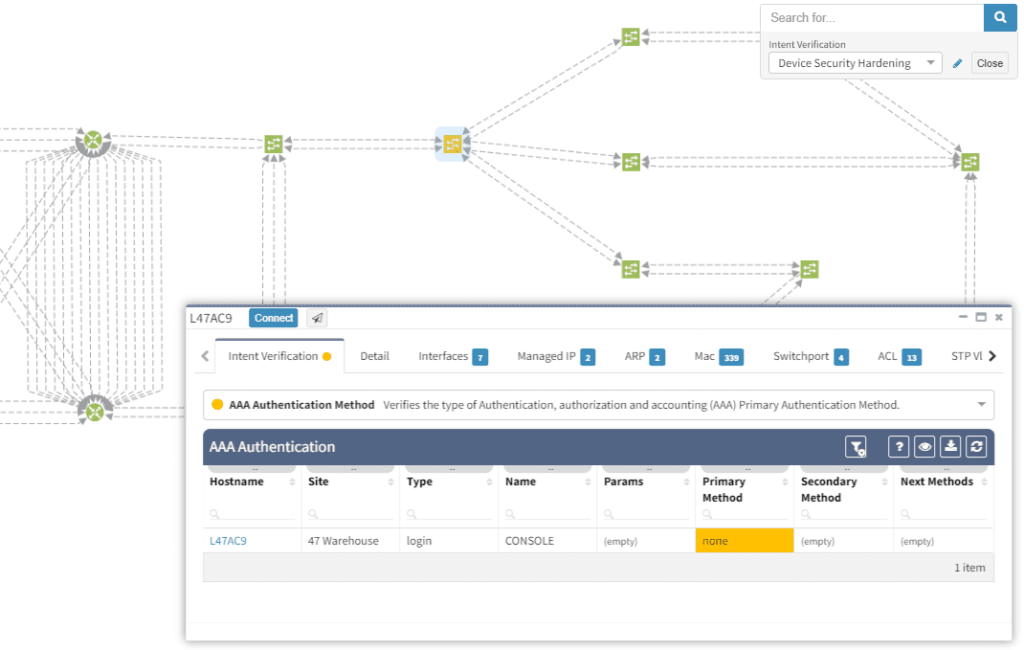
Or here we want to visually verify device security hardening for compliance checks, and suddenly see that one of our devices has AAA Authentication configured with method "none" allowing privileged access without any authentication.
Visualization is available for any type of Intent verification, and can be combined with visual snapshot comparison. Here we verify neighborship compliance, and once we see that there is an issue with OSPF neighbors, we compare Monday's network state with the network state at Sunday, to see if the network has changed.
This visual issue representation is available for any type of Intent-Based Verification which can be associated with a link or a device.
The intent-based networking (IBN) or intent-based verification (IBV) buzz word has been around quite some time. However, to this day, not every engineer from security or network operations is familiar with the concept. Apart from that, people with diverse backgrounds may have a different understanding of the approach.
The goal of any computer network is to transfer information based on multiple variables. The Intent-Based Networking (IBN) is focused on network automation and better aligning networks with operational goals or 'intent'. Intent is what we want networks to do. It differs from classical monitoring goals in that we can express advanced operational concepts or even business goals. In classic monitoring we might have checks such as "IP address X must be reachable" while 'operational intent' could be "Authorized users must be able to redundantly reach application servers".
Verifying reachability via ICMP from the monitoring center is one thing, but verifying specific path availability and parameters from a specific set of sources to specific set of destinations is significantly more complex and has usually required a lot of manual effort to complete. This is extremely important to understand, because 'intent' advanced next level of visibility and shifts operational notion from "up/down" to predictive analytics.
As networks move towards IBN, the IP Fabric platform is here to help automate a significant part of the process.
In the platform, we have already created the Assurance Engine that is capable of tracking protocol inconsistencies or providing feedback on network health. The IPF administrators have the power to create their own system-wide controlling mechanisms that fit their needs for IBN.
We decided to take this powerful feature to another level, and with version 3.3. we have introduced Intent-Based verification for the diagrams. Imagine you are viewing any available network topology or the end-to-end path, while you can apply any previously defined IBN rule directly.
In the new version, the platform collects and analyzes DHCP Snooping information for supported devices. The information includes normalized configuration and state, including trusted ports, option82 and the binding database amongst other parameters. You can find the new DHCP snooping tables at /technology/security/dhcp-snooping/configuration-v4 in the platform
The VLAN summary information is now compiled from the network specifically from VLAN point of view. Previously VLAN information was compiled and available only from point of view of the Spanning Tree Protocols, however VLANs without any STP association were not available in the platform. Now any VLAN that exists in the network can be found, analyzed, and visualized, even if it is suspended, broken, or exists on a single device without any STP capabilities. Definitive VLAN information can be found at /technology/vlans/device-detail in the platform
Detailed SSID radio information was already available for mapping each SSID on each wireless Access Point in the Network. This information was present for each unique AP-SSID pair, and therefore was inherently presented from the AP point of view. In this release we have added SSID summary table which provides information from the point of view of SSID, and should help in consistency verifications of SSID deployments in the network. The table is located at /technology/wireless/radios/ssid-summary in the platform
With a single double-click (all clap for an amazing self-contradiction) one can ungroup the links in diagrams. So far it was only available with the help of the 'group/ungroup' button in the protocols menu.
Every release we tend to update the vendor list per requests from our customers and IPF version 3.3 is not an exception. We’ve seen a somewhat surprising venture of Mikrotik platforms into enterprise environments, primarily for advanced routing and MPLS capabilities, so we have added support for the Mikrotik platform. Please keep in mind that Mikrotik routers require longer session timeout, otherwise they will be not discovered.
The Extreme routers and switches have been among supported vendors for some time but not the Enterasys devices which Extreme has acquired back in 2013. Starting with 3.3, the basic discovery has been added.
Discovery attempts to contact devices using Telnet or SSH, which is useful especially for very large networks or networks with significant history. There is always an occasional forgotten device with Telnet enabled which IPF platform could help to identify. However, not everyone is particularly happy by having Telnet sessions around with every discovery. In the new version, the Telnet can be disabled for discovery.
Transceivers on NX-OS platform are now available in the inventory, for the ASA the support for system-defined object groups was added and much more.
Big thanks to our supporting customers, who are constantly helping us to improve the platform. Full details of the release could be found in our Release Notes.
If you have found this article resourceful, please follow our company’s LinkedIn or Blog, where there will be more content emerging. Furthermore, if you would like to test our platform to evaluate how it can assist you in managing your network more effectively, please let us know through www.ipfabric.io.
As networks become increasingly complex, the job of network administrators becomes more and more demanding. To understand the sheer amount of effort that the role takes, you only have to look at the task of analyzing the enormous amounts to status information within a network.
With the methods that most organizations are using, analyzing network status, preventing link capacity and node overloads, and having enough information to take immediate action within your network is virtually impossible.
If network admins were able to harness the power of network visualization and dynamic network mapping regularly, instead of it being a long, laborious process that takes months to create, they’d suddenly be able to visualize the relationships between network elements and have an accurate representation of the network’s graph structure.
Network visualization helps clarify and define the relationships between network nodes and the links between them and displays them either as an online (live) diagram or an offline diagram.
When dealing with network visualization, several rules need to be considered.
For this example, we’re going to use seven rules from Eugen Goldstein, the German physicist that is often credited with the discovery of the proton, and apply them to network visualization software.
Also, as another example, other basic rules which can be good to consider, are:
These rules were given by Ben Shneiderman (an American computer scientist).
Network visualization helps users connect the dots more quickly than just staring at a spreadsheet of data. With visualization, reports can be more straightforward and can be far more effective. These easy to follow reports provide network engineers the intelligence for monitoring, troubleshooting and gathering reports of the network, which helps them to analyze and understand the status of their networks nodes, links, and more.
Network visualization tools can also help network security engineers handle security issues and more easily observe the status of their systems.
The monitoring software helps network engineers visualize the patterns within their complexed network, which enables them to troubleshoot issues and make informed decisions much more quickly, minimizing downtime during outages. Visualizations can be used in offline mode, giving you the flexibility to view a static picture, or online mode, which lets you see changes as they’re discovered in real-time.
If they were armed with network visualizations, admins would soon find that troubleshooting, assessing, and planning out their networks would be a piece of cake! Unfortunately, features like these go far beyond what any legacy network tools are able to provide.
That’s where IP Fabric comes in.
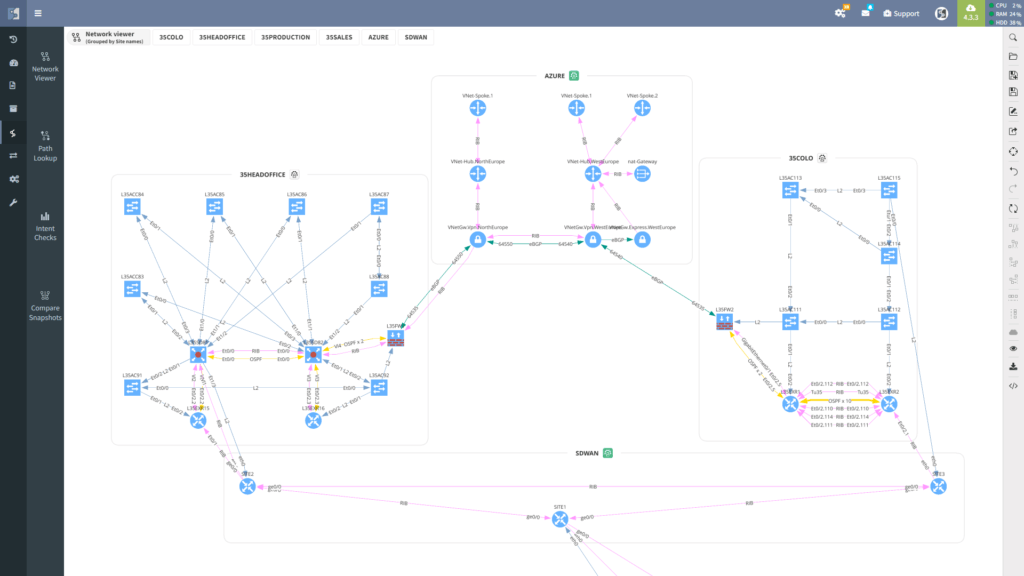
IP Fabric’s platform uses visualization to provide users with detailed tech visibility and drill-downs on dynamic network maps. The system visualizes individual technology and protocols, which enables network engineers to plan changes, troubleshoot connectivity issues, and document the network.
Mapping out and verifying end-to-end paths, from switching through balancing to firewall and cluster policies, enables network engineers to troubleshoot issues much quicker, and to communicate with other engineers about the network.
Using visualization, IP Fabric maps out complete active network paths between any two endpoints. The map shows you the routing and switching forwarding decisions, including the results of all of the security decisions of all active path filters for the specific source-destination pair.
End to end path mapping
As a network engineer, it’s incredibly important to be able to see your site-to-site connectivity or your individual sites, including all of your managed and unmanaged devices (including wired/wireless users, or IP phones). IP Fabric visualizes the details of individual protocols or aggregate links and topologies into a representative view.
IP Fabric helps you delve into active QoS, applied Access Control Lists, or transmission issues on any of the diagrams. Use the platform to verify links and device redundancy, or visually analyze specific protocol topology.
Try IP Fabric for yourself and see just how useful network visualization and network dynamic diagrams can really be.
IP Fabric platform can be considered a Swiss Army knife for network engineers, providing one with trustworthy network verifications. One of IP Fabric's functionalities is here to help you continuously check if the network is configured properly or not.
Lets demonstrate this capability on one of the functionalities that would be typically configured by IP Fabric administrator, as it is one of those domain-specific configurations differing in every network — Authentication, Authorization, and Accounting, otherwise known as AAA, or Triple A.
Many individuals who have had to implement AAA on a router or a switch most likely have little knowledge regarding the commands that they copy to the router configuration. Most will simply utilize the AAA configurations from another functioning router or switch. Today, we are going to analyze the best AAA practices and how one can ensure its proper setting with our IP Fabric platform.
For those who are working with a larger network environment, you are most likely using a form of TACACS+ or ACS server running that is specifically designed for the management of logins to your devices. AAA works in unison with TACACS+ to provide efficient management of your logins’ security. In other words, this monitors who is able to log in (Authentication), what that user can do (Authorization), as well as track the commands that are used (Accounting). In the instance of server failure or reachability issues, it is recommended to have a backup local login user name and password that will allow access to your devices.
We shall now analyze what is considered the best practices for configuration.
aaa new-modeltacacs server ACS1
address ipv4 1.1.1.1
key 0 SECRET-KEY
tacacs server ACS2
address ipv4 2.2.2.2
key 0 SECRET-KEY
aaa group server tacacs+ ACS
server name ACS1
server name ACS2aaa authentication login default group ACS local
aaa authentication enable default group ACS enable
aaa authorization config-commands
aaa authorization exec default group ACS local if-authenticated
aaa authorization commands 1 default group ACS if-authenticated
aaa authorization commands 15 default group ACS local if-authenticated
aaa accounting exec default start-stop group ACS
aaa accounting commands 1 default start-stop group ACS
aaa accounting commands 15 default start-stop group ACS
Upon dissecting this model by line, we have:
This new-model essentially turns on the AAA functionality on the network device.
This addresses the setup of the TACACS server details, such as the IP address, shared key, and all other optional details.
This is intended for the grouping of specific servers into logical groups.
Here, we define how the device is authenticating the users who attempt to log into the device. First, there is the default authentication method with group of TACACS+ servers named “ACS”. Then, if it is unreachable, we shall implement the locally configured user account list.
This component explains that, for enable mode, the default authentication method with group of TACACS+ servers named “ACS” should be utilized.
This is regarding our goal to authorize each command that is being issued to the device.
This sets up the device and places the user directly into enable mode, upon his authentication (the if-authenticated keyword).
In this command, we are authorizing the level 1 user commands, which is similar to the non-enable mode.
Here, we are providing authorization for level 15 users against TACACS+. If TACACS+ is unavailable, then the local user account is used, instead. Upon authentication, the user will immediately be placed into exec/enable mode.
The logging in and access into the device is ensured by AAA Accounting
This provides the tracking of user activity on a given device for privilege 1 commands.
This provides the tracking of user activity on a given device for privilege 15 commands.
This provides tracking of user activity on a device, even if they have just logged in.
As you can see from this basic configuration, there is significant variability, resulting in complications of the verification of the proper function. This worsens with regular network operations, when the connectivity to the TACACS server fails, requiring a troubleshoot to determine the error. In such a situation, one would usually remove the TACACS configuration in attempt to resolve the issue. However, during the troubleshoot, it is common to forget about this change and leave the network open with local authentication or, perhaps, no authentication, whatsoever. Luckily, IP Fabric offers the newly released AAA verification, which can be used for the verification of the real live AAA settings.
Although our platform includes a few “out of the box” reports, we highly recommend adjusting these default reports in color with your custom verification checks, since the AAA settings differ between various companies. We recommend that you observe and spend time on the following:
Let us assume that we want to set up the verification report for the Authentication methods to verify this:
Which would be equivalent of the following piece of configuration
aaa authentication login default group ABACS localaaa authentication enable default group ABACS enableIt is generally recommended to have a single detection for all issues on the particular AAA method and to reveal the issue count on the dashboard.
This can be configured in the following manner:
Proceed to colorize the columns with specific details to green or orange, so that you will immediately see what is wrong from the dashboard counter created previously. In our case, we would need to setup additional rules as follows:
AAA Authentication Secondary method would look like this:
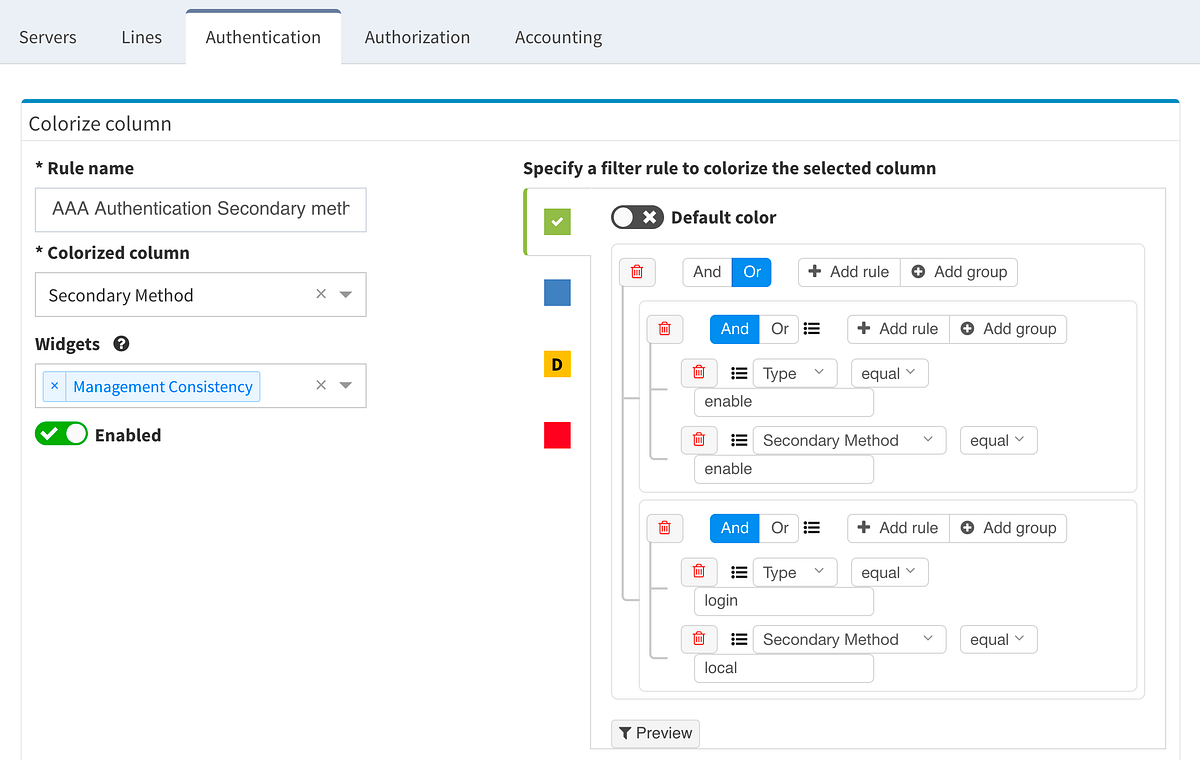
This will ensure the setup of the Authentication on all devices in the network. In regards to the remaining tabs (servers, lines, authorization, and accounting), you may follow the same logic to create similar specific rules that will configure IP Fabric to verify your specific AAA needs consistently in a matter of seconds.
In similar way, you can implement your custom verifications for any data table present in the system, to get complex view on your own network setting consistency!
If you have found this article resourceful, please follow our company’s LinkedIn or Blog, where there will be more content emerging. Furthermore, if you would like to test our platform to observe how it can assist you in more efficiently managing your network, please write us through our web page www.ipfabric.io
The wait is over, IP Fabric v3.0 is HERE! 🎉🙌
Quite often, when a company pushes out an update, it’s more about their developers squishing a few bugs than actually giving you shiny new toys - I mean, features.
This is not one of those updates.
In our quest to help you empower your network engineers, we’re rolling out an update that expands our platform’s capabilities in unprecedented ways.
In this update, we’re adding Network History functionalities that allow you to display the network state from any point in the past and compare it to the current state. This will enable you to do things like work on the platform while the discovery process is running, export any snapshot you’d like, and more!
Let’s go over the shiny new toys you’re getting in a little more detail so you can take full advantage of our platform.
Of all of our platform’s new features, this is the one we’re most excited about.
Unlike in previous versions where you could only see the latest network snapshot, our v3.0 update allows you to pull up any previous snapshots so that you can see how the network performed before. This new capability extends to all aspects of the platform, including technology verification tables and diagrams.
Thanks to IP Fabric’s newest update, you can now pre-load and instantly switch between up to five snapshots.
Now, instead of going through a lot of effort trying to figure out what changed in your network over the weekend, you can have an answer instantly.
Your days of waiting for IP Fabric’s platform to finish an operation before allowing you to use its other features are over.
The system now allows you to use all of IP Fabric’s features while simultaneously running other processes (like a network discovery), saving you even more time.
When the platform encounters a device that it isn’t able to log into, whether it’s due to misconfigured passwords, missing access control lists (ACL), or any other reasons that may arise, it no longer needs to scrap the current discovery process and start over again from scratch.
This update allows you to “discover” the missing devices manually by adding details like the username, password, IP address, or other pieces of information into the platform, saving you loads of time previously spent restarting discovery processes.
Thanks to the update, IP Fabric now allows you to run targeted partial discoveries on select devices. This can be useful in all sorts of scenarios. For example, if you’re using IP Fabric as part of the change management process.
In this scenario, to run a targeted discovery, select the devices affected by the network change. The process will automatically update their state data, saving you time and effort.
IP Fabric v3.0 comes with a snapshot management tool. That allows users to do all sorts of things with their network snapshots, including:
We’ve continued to improve our platform’s network discovery process, including improved platform detection.
Diagrams load even more quickly than before, especially in large network environments.
For those who want to take our platform’s automation to the next level, we’ve published our platform’s API documentation here.
Other various improvements and fixes that we haven’t outlined here can be found in the release notes here.
Interested in learning more about how IP Fabric’s platform can help you with analytics or intended network behavior reporting? Contact us through our website, request a demo, or follow this blog.
Today, it is our pleasure to announce new version of our IP Fabric platform. Version 2.4 is in a general availability release that extends our product capability in technologies usually found in datacenter and network edge environments, namely VXLANs and Multi-protocol BGP address families.
For customers using Virtual eXtensible LAN overlays in their datacenters, we are adding support for this technology in both Diagrams and Technology Tables. The platform provides with information about Virtual Tunnel Endpoints (VTEP) in the network, their peers, configured interfaces and VXLAN VNI.
To support traffic recording efforts of our clients we are introducing support for global Flow Exporter overview and configuration verification. Regardless if the technology used is NetFlow, Flexible NetFlow, IPFIX or sFlow, we now provide you with detailed overview of the devices configured for traffic exporting. Additional details provide information about all the configured collectors and interfaces used for exporting traffic to them.
Although the Simple Network Management Protocol is one of the oldest network protocols, it is still widely used in network management for network monitoring. However, there are some risks associated with use of this protocol. First, when this protocol was created in 1980's, the idea was, that it will be used also for network configuration and second, there are well known community names for both read-only and read-write access to the devices. Last issue is, that except the last version of the protocol — version 3, there is no way to ensure authentication and privacy of the messages. Our tool can help you to improve the security of your network in couple ways — within seconds you can identify devices that are still using well-known public/private communities, find the devices that are using some non-standard communities and get rid of legacy SNMP protocol versions 1 and 2 completely, replacing it with SNMPv3. Of course, if you are using SNMP traps, we provide you with overview of all the SNMP Trap hosts configured on your gear as well.
All devices are generating amount of logging messages that can be stored locally on the device or, ideally sent to a central syslog servers or SIEM systems for correlation of events. Our tool again arms you with a visibility into what syslog servers are configured and where, so you can easily clean up the legacy servers configurations and ensure that the proper servers are in place, so that you don't miss any message your device wants to tell you.
We have worked hard on network discovery, where we improved detection of various platforms. The Diagrams now load much faster then ever before, especially in big network environments. Last, but not least, we now support BGP address families, where we provide with a new Technology table with all address family sessions configured along with their state.
For those interested in serious automation with our platform, we have published documentation of our platforms' API. You can find it here.
If you’re interested in learning more about how IP Fabric’s platform can help you with analytics or intended network behavior reporting, contact us through our website, request a demo, follow this blog or sign up for our webinars.


