It's a typical Monday morning and you sit down with your coffee and log into work. The first call you receive is from a team stating that they can no longer access their application. From your previous experience, the tools you must work with, and the complexity of your network this may leave you thinking "There goes my morning."
Here at IP Fabric we have the operations and engineering teams in mind, but before we jump into our platform let's look at some challenges many companies face daily. Troubleshooting an issue, like the one stated above, in a mid-size to large enterprise environment can take anywhere from 1-3+ hours just to discover the root cause. After the problem is found, the operations team will also have to engineer a solution, open an emergency change control, get proper approvals, deploy the fix, and verify network stability which adds even more overhead to getting your users back up and running. Mean Time to X (MTTx) are key metrics in a network environment; just imagine if you were able to cut your troubleshooting time down to minutes. This would have an immediate effect on these Key Performance Indicators (KPIs) while strengthening your network compliance, reliability, and security.
Deploying IP Fabric into your environment can alleviate many headaches your network teams encounter and greatly reduce your MTTx metrics. Unlike other products, after installing the IP Fabric VM in your environment and running the simple setup you can be using the tool in a matter of hours, no complex configurations are required.
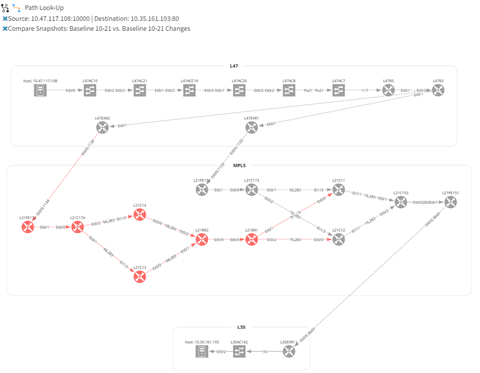
Today we will be discussing Path Look-Up Tool and how it uses network snapshots to visually create a diagram of your network.
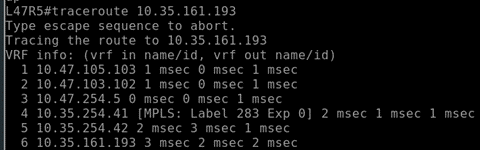
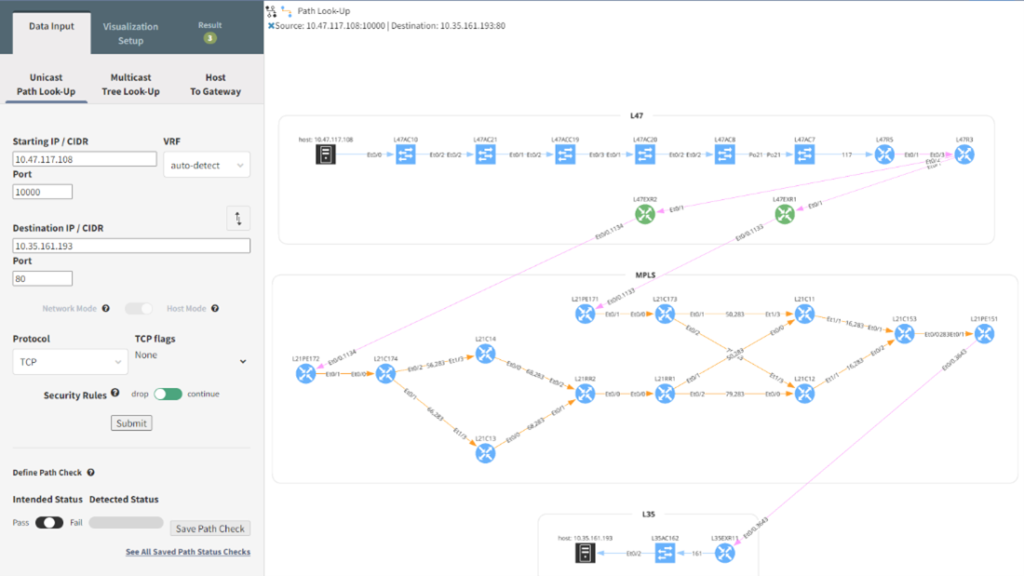
Using a read-only credential, IP Fabric will create a snapshot of your network using device configurations, Layer 2, Layer 3, MPLS, and other routing protocol information. It will also pull ACL rules and firewall policies to ensure the security of your network and assist with troubleshooting connectivity issues. There is no longer a need to go to a database or static documentation to locate endpoints and then log into multiple network devices to verify the network topology between them. Also, since snapshots can be scheduled, you can ensure your network diagrams are always up to date without the need for tedious manual updates. All this data is graphically represented to you in a webpage by entering a source IP and port to destination IP and port. The traceroute data does not show the switches and MPLS routers which is where a possible issue may arise.
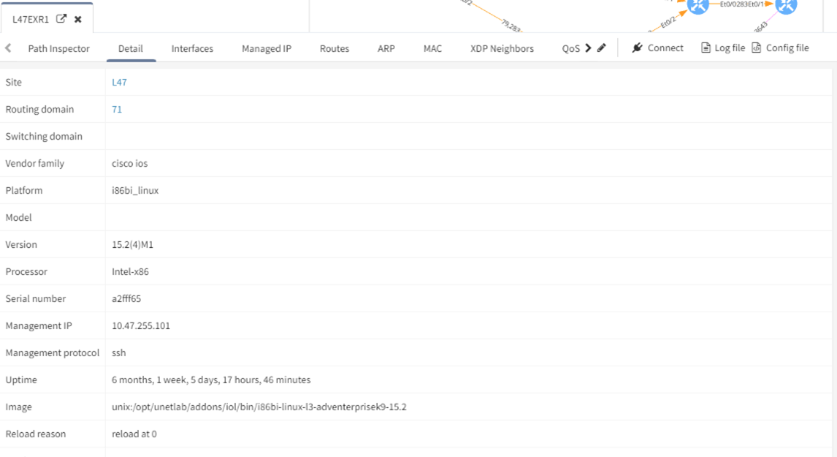
Right clicking any device in an IP Fabric topology diagram and selecting Show Detail will display all the information IP Fabric has collected on the device. You can view all the routes, security rules, ARP entries, interfaces, QoS information and even download the configuration without having to leave the web browser.
IP Fabric comes with many network verification checks out of the box, and you can create your own customized ones. These can be overlaid onto your diagram to ensure your network is operational.
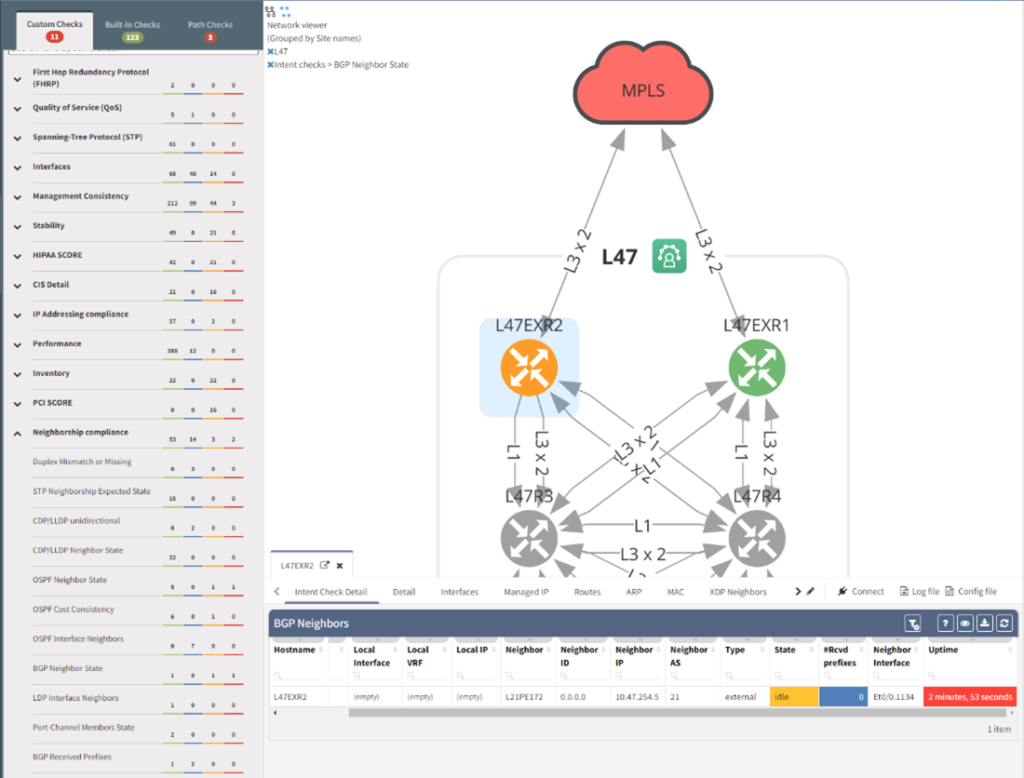
In this example, BGP Neighbor State check has been selected and device L47EXR2 is highlighted orange. Right clicking the device and selecting Show Detail opens the device window at the bottom of the page where the table shows the BGP state is Idle not Established. Built-in checks include items like routing protocols, spanning tree, and configuration to name a few.
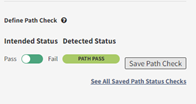
After searching for a path and verifying the intended network topology you can define it as a Pass or Fail check. An example of where this might be useful is if you have deployed a new firewall rule to block access to a device or subnet, IP Fabric will be able to calculate if there are any backdoors around the security policies that might allow unintended access.
IP Fabric supports multiple vendors. IP Fabric can consolidate all your ACL and firewall policies into a single pane of glass. This removes the need for logging into firewall controllers or networks devices and running troubleshooting commands. Some of these basic troubleshooting steps require you to not only know the source and destination IP and ports but also the source and destination zones which adds more time to your diagnosis. Once the policy is fixed you can refresh the data for that single firewall and verify your traffic will flow once again.
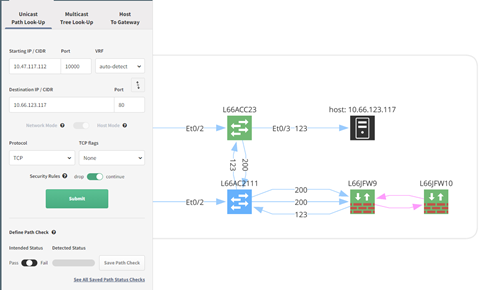
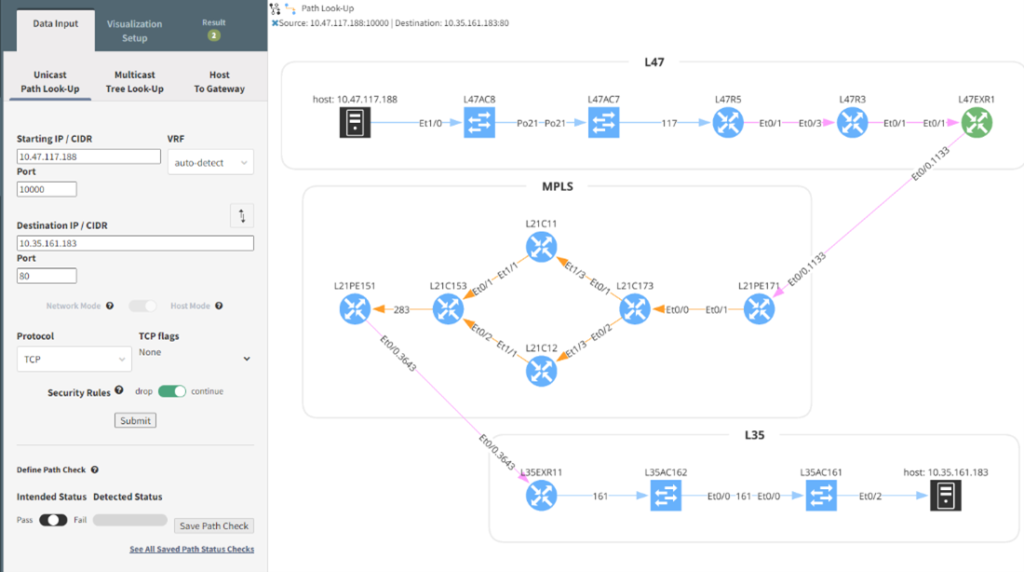
Perhaps you just deployed a change to allow port 80 and 22 through your Cisco ACL on L66ACC23 but connectivity is still not working. Using the Path Look-Up tool, network issues can be easily debug this in a multivendor environment. Above we see port 80 working as expected in all firewalls.
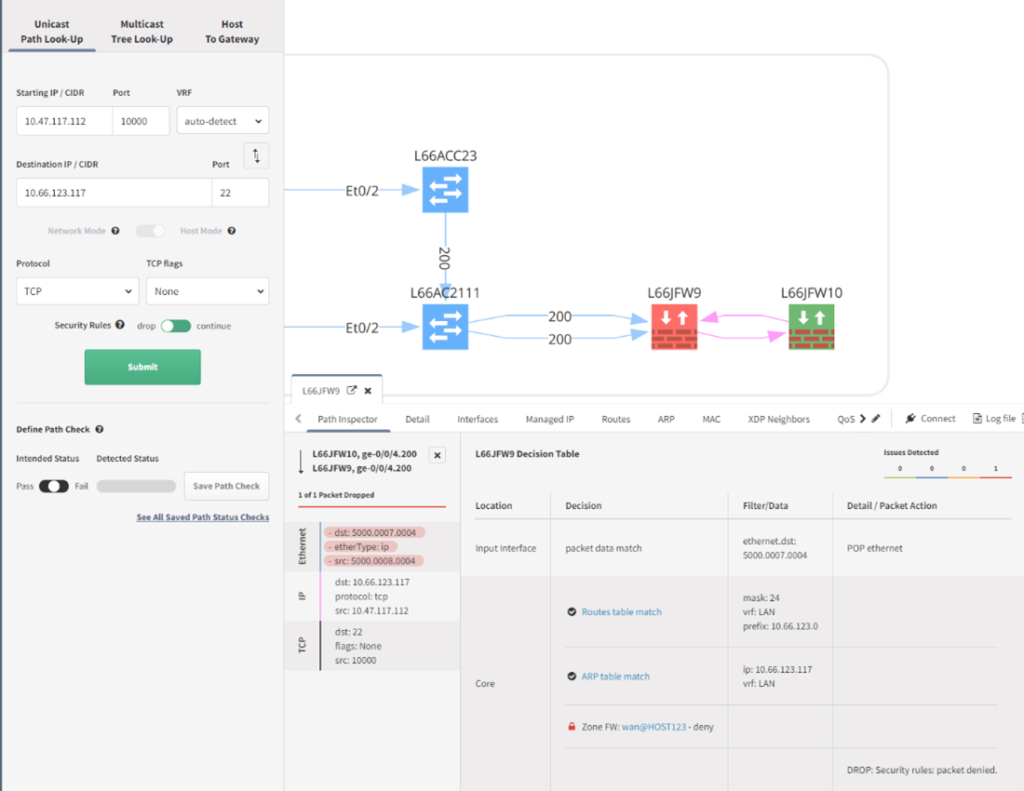
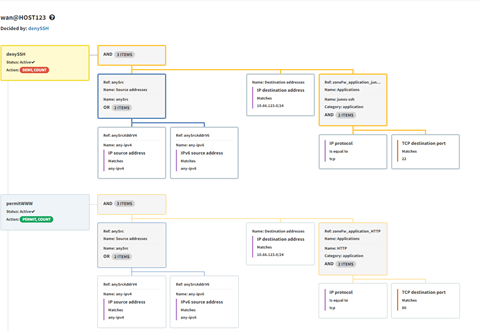
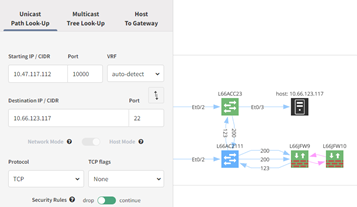
Switching to a destination port of 22; the Juniper firewall policy, wan@HOST123, is blocking all SSH traffic to the 10.66.123.0/24 subnet. You can further drill-down into the policy and see the denySSH match statements.
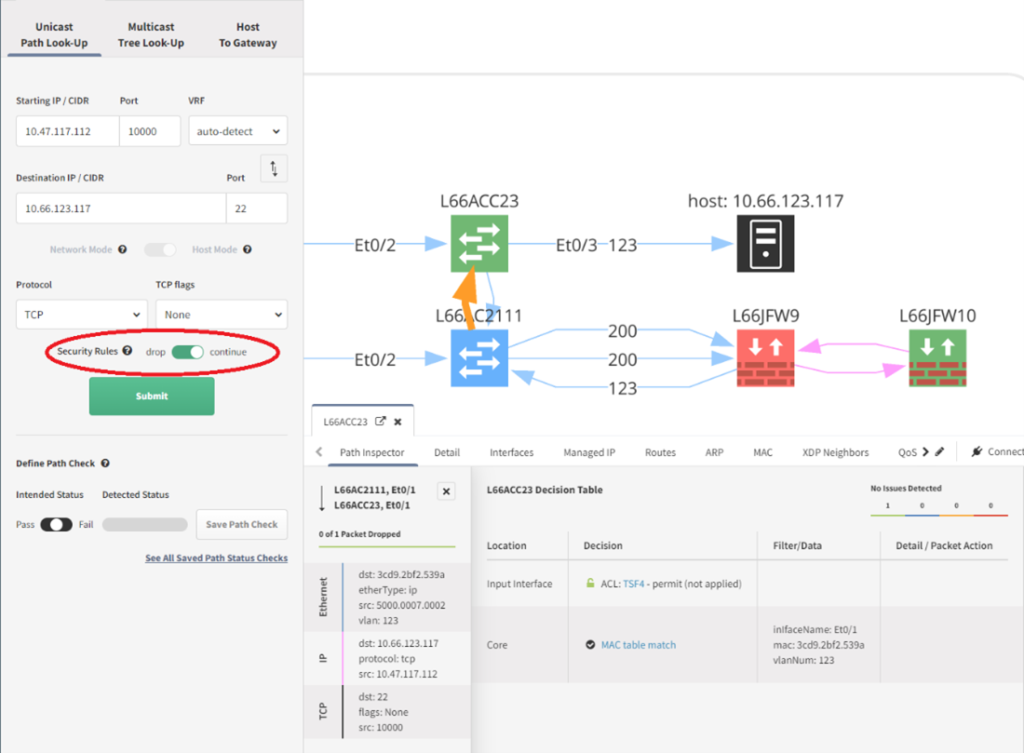
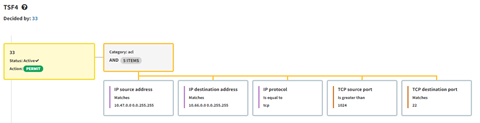
One last note before we move on. If you change the Security Rules flag from drop to continue (shown below), IP Fabric will not apply the firewall rules and show the complete topology, not stopping where the packet is dropped. This allows for verification of the updated TSF4 Cisco ACL which does allow TCP port 22.
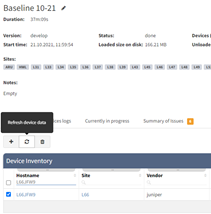
Once the Juniper firewall L66JFW9 has been updated to allow port 22 head over to your snapshot. In the Device Inventory list search for the host, select it, and click Refresh device data. Once the device snapshot is refreshed you can re-run the path look-up and ensure traffic is allowed. This is a great way to verify the network prior to contacting an end user to have them run a test.
All this information is also available using an API which allows your engineers to enhance this toolset even further. Perhaps you want to export all the devices in the path and then use this information to search in your change, incident, or security information and event management (SIEM) systems to further enhance your automation. In the below Python example, all devices are now available in a textual format which allows for easier manipulation and further processing.
import requests
from json import dumps
from tabulate import tabulate

params = {
    "parameters": {
        "destinationPoint": "10.35.161.183",
        "groupBy": "siteName",
        "networkMode": False,
        "pathLookupType": "unicast",
        "protocol": "tcp",
        "securedPath": False,
        "startingPoint": "10.47.117.188",
        "type": "pathLookup",
        "destinationPort": 80,
        "startingPort": 10000
    },
    "snapshot": "$last"
}

headers = {
    "Content-Type": "application/json",
    "X-API-Token": "TOKEN"
}

resp = requests.post(
    'https://demo3.wordpress-625423-2416527.cloudwaysapps.com/api/v1/graphs',
    dumps(params),
    headers=headers,
    verify=False
).json()

results = [['Site', 'Type', 'Hostname']]

for node in resp['graphResult']['graphData']['nodes'].values():
    results.append([node['boxId'], node['type'], node['label']])

print(tabulate(results))
---- ------ -------------------
Site Type Hostname
L47 switch L47AC8
L47 switch L47AC7
L47 router L47R5
L47 router L47R3
L47 router L47EXR2
L47 router L47EXR1
MPLS router L21PE172
MPLS router L21PE171
MPLS router L21C174
MPLS router L21C173
MPLS router L21C13
MPLS router L21C14
MPLS router L21C11
MPLS router L21C12
MPLS router L21RR2
MPLS router L21C153
MPLS router L21RR1
MPLS router L21PE151
L35 router L35EXR11
L35 switch L35AC162
L35 switch L35AC161
L47 host host: 10.47.117.188
L35 host host: 10.35.161.183
---- ------ -------------------
Deploying IP Fabric into your ecosystem is not just adding another tool to the hundreds you may already own but is The Tool to increase troubleshooting efficiency, network reliability, and security. With support for many different vendor platforms, IP Fabric takes the data you care about from your network devices and displays it to you in a vendor neutral format without requiring a dedicated development team writing complex automation code or parsers. Since our platform not only uses configuration data but also pulls in switching and routing information you can feel more confident about the architecture and decisions your network takes. All of this is then provided to you in a simple GUI and programmable API allowing you to visualize your topology and take quick action to remediate issues.
It's a typical Monday morning and you sit down with your coffee and log into work. The first call you receive is from a team stating that they can no longer access their application. From your previous experience, the tools you must work with, and the complexity of your network this may leave you thinking "There goes my morning."
Here at IP Fabric we have the operations and engineering teams in mind, but before we jump into our platform let's look at some challenges many companies face daily. Troubleshooting an issue, like the one stated above, in a mid-size to large enterprise environment can take anywhere from 1-3+ hours just to discover the root cause. After the problem is found, the operations team will also have to engineer a solution, open an emergency change control, get proper approvals, deploy the fix, and verify network stability which adds even more overhead to getting your users back up and running. Mean Time to X (MTTx) are key metrics in a network environment; just imagine if you were able to cut your troubleshooting time down to minutes. This would have an immediate effect on these Key Performance Indicators (KPIs) while strengthening your network compliance, reliability, and security.
Deploying IP Fabric into your environment can alleviate many headaches your network teams encounter and greatly reduce your MTTx metrics. Unlike other products, after installing the IP Fabric VM in your environment and running the simple setup you can be using the tool in a matter of hours, no complex configurations are required.
Today we will be discussing Path Look-Up Tool and how it uses network snapshots to visually create a diagram of your network.
Using a read-only credential, IP Fabric will create a snapshot of your network using device configurations, Layer 2, Layer 3, MPLS, and other routing protocol information. It will also pull ACL rules and firewall policies to ensure the security of your network and assist with troubleshooting connectivity issues. There is no longer a need to go to a database or static documentation to locate endpoints and then log into multiple network devices to verify the network topology between them. Also, since snapshots can be scheduled, you can ensure your network diagrams are always up to date without the need for tedious manual updates. All this data is graphically represented to you in a webpage by entering a source IP and port to destination IP and port. The traceroute data does not show the switches and MPLS routers which is where a possible issue may arise.
Right clicking any device in an IP Fabric topology diagram and selecting Show Detail will display all the information IP Fabric has collected on the device. You can view all the routes, security rules, ARP entries, interfaces, QoS information and even download the configuration without having to leave the web browser.
IP Fabric comes with many network verification checks out of the box, and you can create your own customized ones. These can be overlaid onto your diagram to ensure your network is operational.
In this example, BGP Neighbor State check has been selected and device L47EXR2 is highlighted orange. Right clicking the device and selecting Show Detail opens the device window at the bottom of the page where the table shows the BGP state is Idle not Established. Built-in checks include items like routing protocols, spanning tree, and configuration to name a few.
After searching for a path and verifying the intended network topology you can define it as a Pass or Fail check. An example of where this might be useful is if you have deployed a new firewall rule to block access to a device or subnet, IP Fabric will be able to calculate if there are any backdoors around the security policies that might allow unintended access.
IP Fabric supports multiple vendors. IP Fabric can consolidate all your ACL and firewall policies into a single pane of glass. This removes the need for logging into firewall controllers or networks devices and running troubleshooting commands. Some of these basic troubleshooting steps require you to not only know the source and destination IP and ports but also the source and destination zones which adds more time to your diagnosis. Once the policy is fixed you can refresh the data for that single firewall and verify your traffic will flow once again.
Perhaps you just deployed a change to allow port 80 and 22 through your Cisco ACL on L66ACC23 but connectivity is still not working. Using the Path Look-Up tool, network issues can be easily debug this in a multivendor environment. Above we see port 80 working as expected in all firewalls.
Switching to a destination port of 22; the Juniper firewall policy, wan@HOST123, is blocking all SSH traffic to the 10.66.123.0/24 subnet. You can further drill-down into the policy and see the denySSH match statements.
One last note before we move on. If you change the Security Rules flag from drop to continue (shown below), IP Fabric will not apply the firewall rules and show the complete topology, not stopping where the packet is dropped. This allows for verification of the updated TSF4 Cisco ACL which does allow TCP port 22.
Once the Juniper firewall L66JFW9 has been updated to allow port 22 head over to your snapshot. In the Device Inventory list search for the host, select it, and click Refresh device data. Once the device snapshot is refreshed you can re-run the path look-up and ensure traffic is allowed. This is a great way to verify the network prior to contacting an end user to have them run a test.
All this information is also available using an API which allows your engineers to enhance this toolset even further. Perhaps you want to export all the devices in the path and then use this information to search in your change, incident, or security information and event management (SIEM) systems to further enhance your automation. In the below Python example, all devices are now available in a textual format which allows for easier manipulation and further processing.
import requests
from json import dumps
from tabulate import tabulate

params = {
    "parameters": {
        "destinationPoint": "10.35.161.183",
        "groupBy": "siteName",
        "networkMode": False,
        "pathLookupType": "unicast",
        "protocol": "tcp",
        "securedPath": False,
        "startingPoint": "10.47.117.188",
        "type": "pathLookup",
        "destinationPort": 80,
        "startingPort": 10000
    },
    "snapshot": "$last"
}

headers = {
    "Content-Type": "application/json",
    "X-API-Token": "TOKEN"
}

resp = requests.post(
    'https://demo3.wordpress-625423-2416527.cloudwaysapps.com/api/v1/graphs',
    dumps(params),
    headers=headers,
    verify=False
).json()

results = [['Site', 'Type', 'Hostname']]

for node in resp['graphResult']['graphData']['nodes'].values():
    results.append([node['boxId'], node['type'], node['label']])

print(tabulate(results))
---- ------ -------------------
Site Type Hostname
L47 switch L47AC8
L47 switch L47AC7
L47 router L47R5
L47 router L47R3
L47 router L47EXR2
L47 router L47EXR1
MPLS router L21PE172
MPLS router L21PE171
MPLS router L21C174
MPLS router L21C173
MPLS router L21C13
MPLS router L21C14
MPLS router L21C11
MPLS router L21C12
MPLS router L21RR2
MPLS router L21C153
MPLS router L21RR1
MPLS router L21PE151
L35 router L35EXR11
L35 switch L35AC162
L35 switch L35AC161
L47 host host: 10.47.117.188
L35 host host: 10.35.161.183
---- ------ -------------------
Deploying IP Fabric into your ecosystem is not just adding another tool to the hundreds you may already own but is The Tool to increase troubleshooting efficiency, network reliability, and security. With support for many different vendor platforms, IP Fabric takes the data you care about from your network devices and displays it to you in a vendor neutral format without requiring a dedicated development team writing complex automation code or parsers. Since our platform not only uses configuration data but also pulls in switching and routing information you can feel more confident about the architecture and decisions your network takes. All of this is then provided to you in a simple GUI and programmable API allowing you to visualize your topology and take quick action to remediate issues.