Network teams, deeply engaged with the daily changes and mechanisms of their unique network, understand the general state at a given point in time - especially if they have the right visibility tools in place!
However, the network underpins the entire business, and thus network state is relevant across the organization, not just to network teams. There is, in particular, a need to understand how the network state affects outcomes - the risk and impact of the network state on users and applications is vital business information.
Business leaders and adjacent teams (for example, security or operations) acknowledging the relevance of the network begets the need for clear, condensed, and relevant network reports.
Simply put, if something is going on in the network, what impact does it have on my job and the work I need to do?
These users won't necessarily have the same requirements of network reports as network engineers (nor will they understand the intricacies of specific network tech) so simply passing on large amounts of network data isn't an actionable solution.
This means engineers have to spend time understanding the requirements of different users with different perspectives and priorities, and manually collate and correlate different inputs from the network. And after all that effort, these ad-hoc reporting solutions might still not meet these requirements, or be something that you can replicate regularly.
This mismatch of expectations and needs results in frustrating bottlenecks and friction between teams, not to mention the time and focus dedicated to translating specific network information to satisfy requests from different teams.
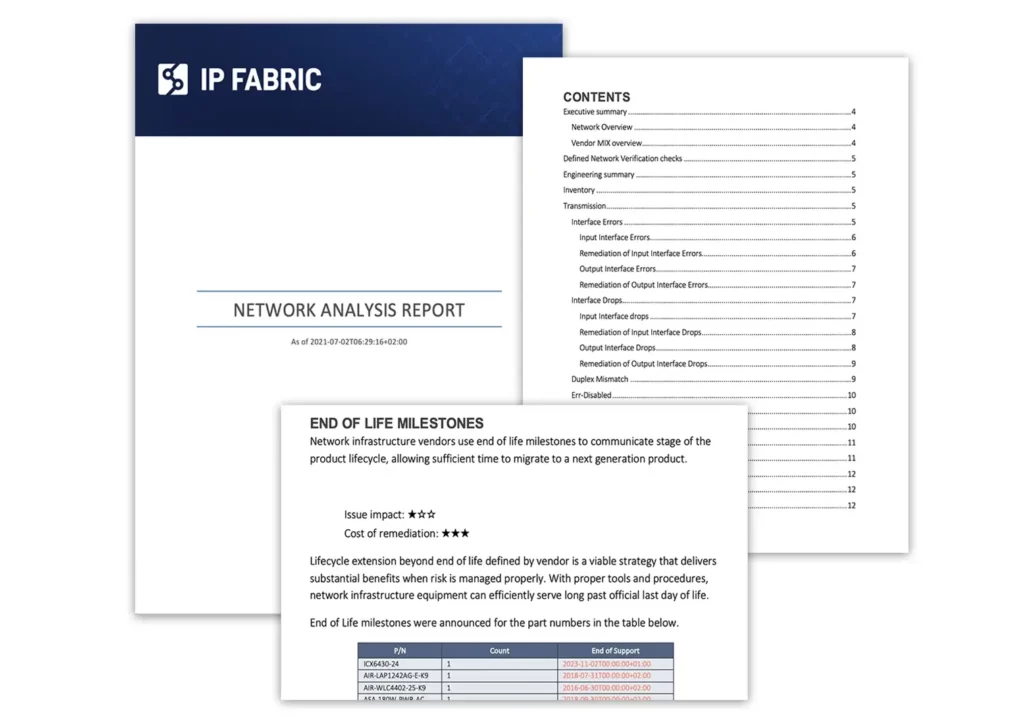
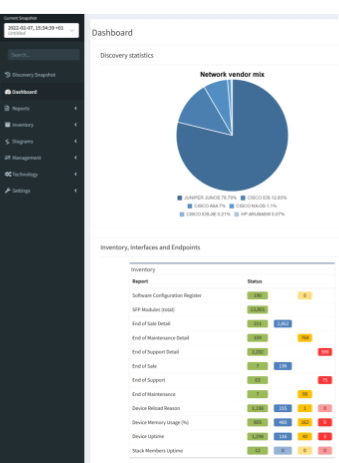
IP Fabric solves this frustration by automatically generating a network-wide analysis report of your network at a specific point in time, providing an invaluable resource to respond quickly and accurately to these requests for information.
This report includes summary information and perceived risks that may affect outcomes in a digestible format. Best of all, this is instantly accessible with a click, with no manual inputs needed. See the 6-second process here:
The cost and time of doing this manually would mean you can't just create these reports whenever you want. With a dynamic enterprise-scale network, regular reporting is crucial to ensure your understanding of the network is up to date so you can make well-informed decisions.
For tech purchasing teams who are ready to embrace a robust network tooling ecosystem, ensuring you pick right - that is - get real value from your tools, and quickly - is step one. Whether it's driving innovation through network automation or actualizing a successful intent-based networking strategy, one thing is clear: the unique DNA of every network dictates a unique set of network tools, influenced by the company’s strategic objectives, operational constraints, and available resources.
That said, there are some core criteria you can use as a compass.
Many teams find themselves ensnared in common, yet avoidable pitfalls: sprawling toolsets that offer little return on investment, glaring functionality gaps, and restrictive vendor lock-in, or even process lock-in, where tools are dictating how you operate your network.
In this post, we’ll share four critical ways to evaluate network tools to steer clear of these traps. That's not to say every tool you need will be able to fulfill these criteria perfectly and you can't wait around for every platform or tool to be perfect; but when it comes to decision time, these criteria can help you keep the future front of mind.

Remember, a network that's secure, observable, and agile doesn't just happen. It's underpinned by strategy, enabled by a carefully selected ecosystem of tools ensuring that no functionality gap goes unfilled. Here's how to pick network tools that don't just promise, but deliver tangible value.
In IT networking, the integration of different tools can make or break the flow of operations. An open approach, where network vendors encourage and support integration and make the necessary data readily available, can inform your network operations strategy as it determines how effectively your team can share and act upon network data. When selecting tools, consider the spectrum of integration methods available.
Open and robust API programmability sits at the forefront of this spectrum, offering a future-proof solution that allows for dynamic responses to evolving network demands. An API-first tool can seamlessly share data across various platforms, enabling automation and fostering innovation within your network infrastructure.
Blog Post: IP Fabric API Programmability - Part 1 - The Basics
On the other hand, pre-built integrations can indicate a vendor's foresight and readiness to integrate with the broader ecosystem of tools you employ. These integrations can be a testament to the vendor's commitment to user-friendliness and their understanding of the network management landscape. They save time and resources, providing out-of-the-box connectivity that can accelerate deployment and facilitate immediate operational efficiency. Maybe the tooling vendor you're eyeing up doesn't have every pre-built solution today, but how do they talk about their plans for this - do they regularly collaborate with others in the space, and actively put forth impactful partnerships where they know customers will benefit?
However, there will be instances where neither API programmability nor pre-built solutions meet the unique needs of your network. This is where self-built, for-purpose integrations come into play. While they represent a tailored fit to your specific requirements, they also come with considerations of maintenance and long-term viability. It's crucial to weigh the benefits of custom-built integrations against the potential for creating future bottlenecks or legacy issues that could turn a creative solution into a hindrance.
The goal is always to enhance capabilities without compromising on adaptability and growth.
For a modern enterprise network, diversity is the norm, with a mix of vendors, domains, and technologies - all essential to meet comprehensive business needs. This complexity necessitates network tools capable of managing the entire network ecosystem, beyond the limitations of vendor-specific or domain-restricted solutions. Relying on tools confined to single vendors or network segments can fragment your network management visibility - and therefore, strategy.
To circumvent the pitfalls of vendor lock-in and ensure transparency across network domains, it's prudent to invest in tools that embrace a vendor-neutral stance and aim to support all network domains. Such tools offer the flexibility, completeness, and extensibility needed to truly future-proof your network, fostering an environment that's prepared for the technologies of tomorrow.
The aim is true end-to-end control of your network.
Related Blog Post: A Holistic Approach to Network Discovery
When selecting network management tools, it's crucial to opt for solutions that do what they promise without becoming a burden on resources. From deployment to ongoing maintenance, if your team is spending hours getting a platform to produce the results you need, and growing frustrated in the process, then the juice is not worth the squeeze.
That said, it's not only about the effort you have to put in today; what about future strategy? Will this tool support your processes should it pivot?
As demands on the network shift and grow, you’ll likely be using a combination of legacy processes and tools as well as adopting newer strategies, like NetDevOps and CI/CD pipeline-based approaches to network management.
Flexibility is key; as network demands evolve, tools should adapt, avoiding process lock-in. The goal is to choose tools that serve as a seamless extension of your data infrastructure, allowing your team to remain agile and effective, not tethered to restrictive tooling.
Of course, when you’re purchasing a tool, you want it to fulfill a particular function. Some tools are only ever going to be one thing, and that’s okay if you feel you’re getting the promised value. For other tools, however, a bit of creative foresight can reveal endless potential and become a really exciting prospect of value that compounds. These tools – if selected carefully – can become your heroes, your Swiss Army Knives of enterprise networking that are beloved by not just you, but throughout an organization.
Generally, there are tools that 1) Do not create more data silos but are built to democratize access to valuable data. 2) Encourage and assist with creative use of that network data.
Download: IP Fabric's Baseline - Operate - Innovate Framework
All to say, while all network tools should fix an immediate problem, the BEST tools also lay fertile groundwork for future innovation.
It's quite easy for network professionals to understand the benefits of automating network operations, such as reducing manual errors and saving time, which provides tactical wins that quickly improve day-to-day operations. Yes, there is still distrust of automated processes, but with more discussion around how to properly de-risk and assure network automation (see, Jeremy Schulman's recent NANOG presentation), the switched-on network engineer of today understands the potential of automation and the importance of exploring and implementing it properly. Or at least, should be curious about what automation could do for them and their team and want to try it out in their network environment.
However, frustratingly, convincing leadership to invest in network automation can be challenging. They may be too removed from operations to properly see the business benefits, too risk averse, or stuck in a mindset that begets stagnation. As Itential's Kristen Rachels recently pointed out, the "biggest inhibitors to maximizing the business benefit of automation were not technical, they were cultural and organizational."
Individual-led automation efforts can be risky without proper buy-in, resulting in inefficiencies, errors, security risks, and team conflicts due to incomplete or inconsistent automation processes. Enterprises must prioritize network automation as a strategic business initiative that deserves the necessary resources and attention to ensure success.
And the fun part? If you're the one who understands this need, it’s on your shoulders to convince leadership that this should be a business priority, and not performed in isolated pockets. Advocating for the best solution can be uncomfortable when an organization is comfortable with the old way of solving problems. To overcome this, framing network automation as a business strategy is key. While a network team frustrated by out-of-date or incomplete documentation sounds like your problem, a user-impacting network outage because of a lack of insight into the network is everyone's problem.
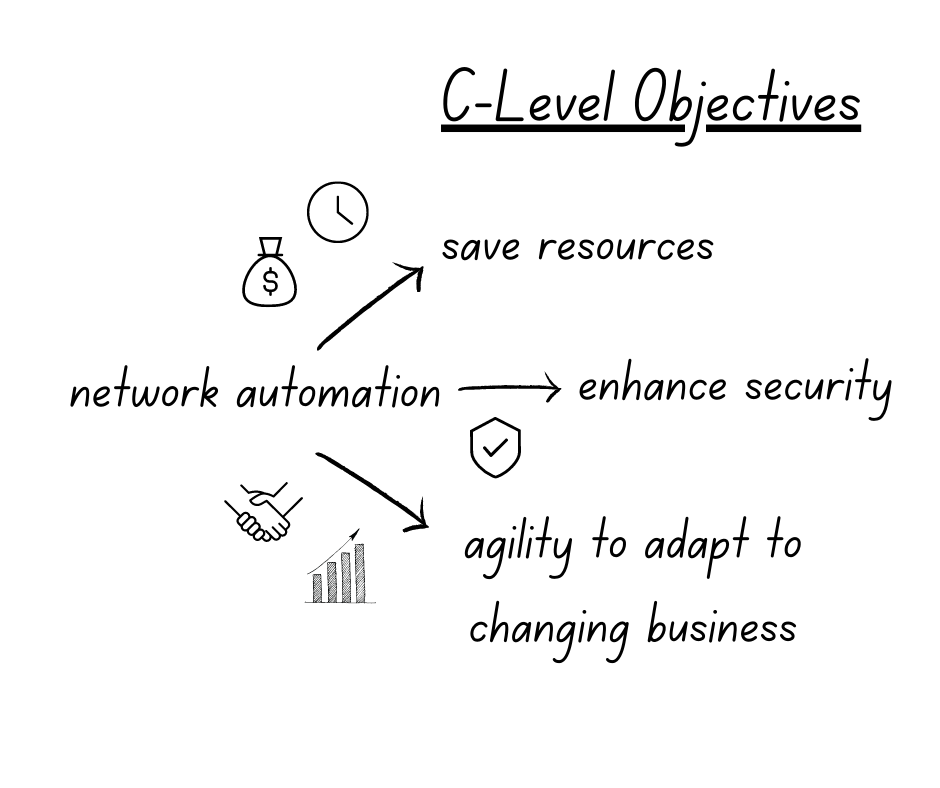
One of the most compelling arguments for automation, of course, is its impact on the bottom line. Significantly reducing manual errors and repetitive tasks, and increasing operational efficiency and productivity translates into substantial time and cost savings for your organization. Network engineers can focus on higher-value tasks, while automation takes care of routine operations. Automation prevents enterprises from misusing their most valuable resource - top talent - on repeatable tasks.
Additionally, automation minimizes the risk of human errors that can result in network outages or downtime, which can result in expensive lost revenue and customer dissatisfaction. On the higher end, the cost of downtime can hit $9000 per minute. When presenting a business case for automation to your boss, emphasize the tangible cost savings and increased productivity that automation can bring to your organization.
In today's ever-evolving threat landscape, network security should be a top priority for organizations. Automation can play a pivotal role in enhancing network security. By automating security processes such as patch management, configuration audits, and threat detection, you can ensure consistent security policies across your network and reduce the risk of human error. Automation also enables rapid response to security incidents, allowing for quicker detection and remediation of security threats. With automated security processes in place, you can strengthen your network's defenses and reduce the risk of security breaches, which can have severe financial, reputational, and legal consequences for your organization. Highlight how automation can bolster your organization's security posture when making a business case for automation to your boss.
Network assurance is a key part of this, and anyone looking into methods of automating their network security should take note of how network assurance can help prevent cybercrime.

Business is fast-paced, and organizations need networks that are agile and scalable to keep up with changing requirements. Automation can help achieve this agility and scalability. By automating network provisioning, configuration management, and deployment of new services, you can accelerate network changes and ensure consistency across your network infrastructure. This allows your organization to respond quickly to changing business needs, such as adding new branches, deploying new applications, or scaling up network capacity.
Automation also enables network engineers to test and validate changes in a controlled environment, reducing the risk of network disruptions. Emphasize the importance of agility and scalability in the modern business landscape and how automation can enable your organization to stay ahead of the competition when presenting a business case for automation to your boss.
S&P Global saw the value of this when faced with a huge merger - here, Guruprasad Ramamoorthy, Global Head of Network Architecture, Engineering, and Operations, explains how automated network diagramming and modeling helped: "We were able to quickly model the behavior that we needed to build a day 1 experience for our employees across companies working on a large and complex merger."
The bottom line
Reduce labor costs associated with firewall management by enabling engineers to work on more strategic tasks. Streamline the change management process, reducing the need for costly downtime during firewall rule updates which can result in increased productivity and revenue generation.
The secure edge
Minimize the risk of human errors resulting in misconfigurations or security vulnerabilities. Ensures the consistent enforcement of rules. Enables rapid response to emerging threats (e.g. malicious IP addresses or suspicious traffic patterns).
The agile future
When new network services are provisioned, firewall rules can be applied consistently and rapidly, regardless of environment (on-prem, cloud) or location.
The bottom line
Network engineers are highly skilled individuals who don’t generally enjoy the tedious task of updating network documentation. Their skills could be better used on strategic tasks.
New team members can understand the network quickly and bring value faster.
The secure edge
Manually updating documentation opens up an organization to a higher rate of human error and continuously out-of-date documentation. This can be dangerous when decisions need to be made quickly; teams relying on incorrect documentation may inadvertently introduce vulnerabilities into the network.
The agile future
In order to grow, or pivot a network management strategy, knowledge of the network must be accurate and easily shared. New team members need up-to-date and accurate documentation to ramp up confidently. A fully documented network makes mergers, acquisitions, migrations, and additions far simpler.
The bottom line
Key metrics like fault isolation time and Mean Time to Resolution will be lowered.
Not only does this mean less likelihood of expensive outages, but also more time for strategic tasks.
The secure edge
Incidents compromising security are solved faster. Fewer vulnerabilities in the first place thanks to consistency in security policy applications and automated updates.
The agile future
Proactive troubleshooting also means fewer network outages and more predictable business continuity as your organization grows and changes.
These are just simple examples to demonstrate how, through keeping (1) budget, (2) security, and (3) agility top of mind, you can succinctly create a compelling case for some simple automation wins that can help change the mindset of slow adopters.
An automated network assurance platform is key in providing the confidence that automation is having the desired effect. Want to try IP Fabric? Here's our free, self-guided demo. Or you can reach out to us to schedule a free tailored demo for a personalized look at network assurance to solve your specific challenges.
For all the tools and tricks the 2023 network engineer has up their sleeve, the modern enterprise meets them with a new challenge. Some are brand-new problems introduced by new technologies, and some are classic struggles exacerbated by the relentless pace of enterprise operations and innovation. Both mean constantly increasing demands on the network that underpins the success of your business. And of course, pressure on the network means pressure on network engineers, who must balance these business demands with a network that is secure, resilient, and agile.
The result is a living ecosystem, and just like a dense rainforest where the flap of a butterfly's wings might mean tomorrow's thunderstorm, your network is continuously subject to ever-changing influences and pressures. As these pressures stack up, so do the expectations that the network operates smoothly at all times - the network is, after all, business-critical. The network engineer of 2023 is something like a nature guide, protecting, learning, and guiding users through the network safely; anticipating changes and mitigating threats; maintaining balance for a successful circle of life.

In understanding how to navigate this on an organizational level – with the right tools, the right data shared between teams, and adherence to a stated network intent – we must trace how business demands translate to technical network complexity.
Only then can we ensure that the David Attenboroughs, Steve Irwins, and Eliza Thornberrys of enterprise networking have the tools they need to meet the challenge (ahem - pick your fighter!).
In our globalized economy, enterprises today are typically distributed, spanning multiple locations and supporting more devices, applications, and unpredictable users than ever before.
Different locations or business units may have different policies and regulations (bring-your-own-device, IoT, remote work) and the network team must account for all of it.
Enterprises are readying for this in general, with a recent survey revealing that with regard to “supporting a digital-ready workplace and hybrid work environment, 84% of all firms said they would invest in “future of work” initiatives.”
However, they may not yet understand just how central the network will be to their success here, as networking and associate infrastructures are ranked as low spending priorities.
It is essential that enterprises understand how investing in their network infrastructure will affect their business from every angle, including top priorities like cybersecurity.
Highly large, distributed networks mean the following for the engineers who manage them:
*IP Fabric helped solve this issue for Dr. Max - see how we did it.

Whatever platform or services an end user engages with, today they expect the same connectivity as if they were plugged into the wall on location. SaaS applications, hybrid IT environments, remote accessibility – the expectation is seamless and continuous connectivity. Managing this interconnectivity on an enterprise scale is not easy.
72% of organizations treat home offices as corporate endpoints that require network visibility and management using centralized enterprise solutions. (Enterprise Strategy Group, April 2023)
As more industries employ technology that relies on the network to function, meeting these connectivity expectations is not only a business initiative but essential for the provision of critical services like healthcare, education, and financial services for all.
This continuous network availability means that engineering teams need:
We’ve already mentioned Cloud connectivity, but the growing prevalence of cloud, hybrid, or multi-cloud networks also introduces a knowledge and skills gap in enterprises that increases complexity. Smooth team collaboration is essential for enterprises to operate at pace, and these gaps require a normalized, end-to-end understanding of the network for engineering teams regardless of the environment.
IDC predicts that “By 2025, to ensure data and workflow integrations spanning distributed clouds and edge environments, 50% of enterprises will deploy multi-cloud networking.”
For teams to navigate the modern multidomain network successfully, they need:
A single-vendor shop is becoming more of a rarity as enterprises have more options to kit out their network with specialized tooling. Though this spreads some risk and allows for more specific tool selection, it does add complexity to network management, with vendor-specific knowledge required to manage, maintain, and troubleshoot the network.
Recent EMA research cited four main pain points for multivendor SD-WANs: consistent security, skills gaps, costs, and poor cloud access. All of this stems from vendor variation in how network devices are operated and behave.
To have a useful network baseline, this heterogenous data:
With this in place, teams can successfully navigate or even mitigate the aforementioned pain points.
The growing number and sophistication of cybersecurity threats loom over enterprises, making cybersecurity a top priority. Securing the network involves deploying firewalls (from different vendors, next-generation firewalls), intrusion detection and prevention systems, encryption mechanisms, authentication protocols, and more.
Managing both internal security policies and ensuring compliance with industry regulations makes securing the enterprise network a complicated game and with all the previously mentioned moving parts, not a game that ever really ends.
To effectively secure a modern enterprise network, you need:
So, with all of these stated needs that are starting to seem non-negotiable for networking teams, how does a business provide the tools necessary to keep the network, and therefore business, running smoothly?
Step one is to understand your environment, from end to end. You cannot control what you do not first know; if your network is a rainforest, then network assurance is the GPS, aerial photography, and high-beam headlights all in one. Get exploring with our self-guided demo or reach out for a demo catered to your particular rainforest.
It’s clear we’re not putting the Artificial Intelligence toothpaste back in the tube. The last year has only seen an acceleration of AI concepts and experiments becoming applicable to enterprise workflows. If it’s improving outcomes and profitability, why not push forward, right? Uh… right? Well, this is not the place to argue for that philosophy and its potential realities. However, we can certainly speak on the complexity that AI/ML driven process adds to the network that underpins these applications and services. Network automation, artificial intelligence...with every amazing step forward, a new thread of complexity to weave into the fabric of enterprise networking. Somewhere, right now, a network engineer is grappling with the additional demands these processes place on an already massively complex system. Let's explore what's making their day more difficult.
Note: Most of the challenges discussed here apply across industries, but it’s helpful to frame these issues practically, hence the industry-based lens. Understanding the problem in its true context is the first step toward finding solutions.
We’ll start with where improving outcomes is most personal - our health. Hospitals, clinics, and other medical facilities have been jolted into embracing technologies they were more conservative about pre-pandemic. The strain on healthcare systems and growing patient needs and expectations spurred this embracing of technology-based solutions to medical problems.

Democratizing care access via more and better telehealth services, automated patient imaging and diagnostics, remote patient monitoring, robot-assisted surgery, automated drug administration, patient record updates… it’s clear that done right, these initiatives can take pressure off historically overworked doctors, nurses, radiologists, and technicians and improve healthcare outcomes. “Done right” is key, I’m sure you’ll argue, when you’re the one attached to an IV and a computer is selecting your medication and dosage.
So, what lies beneath these health-tech marvels? Here are just three points to consider:
Our frameworks for learning are fundamentally changing with the mainstream use of AI technologies. It can start with simply automating repetitive tasks – grading, scheduling, planning - to free up time for educators. However, it also transforms the way students learn and what they learn. AI can create personalized learning paths and curriculums based on student preference or ability, speed up tailored feedback, and use historical data to track progress and determine knowledge and skills gaps more accurately. Generating educational content has become faster thanks to AI, and access to education has improved with AI-powered translation. Chatbots available 24/7 means students can ask questions whenever they need to, and get valuable answers.

What does this mean for network engineers managing networks for universities, schools, and Edutech companies?
Though somewhat stymied by heavy regulation, Finance/Fintech enterprises have long sought to harness the power of AI to wade through data and make better predictions, optimize processes, improve customer experience, and enhance services.
There is a global move toward mobile-first banking, and it's key that banks rise to the occasion in terms of customer experience; AI can personalize and enhance these experiences with chatbots, customized product recommendations, and improvements based on customer analytics. AI is also used for better fraud detection and prevention, alerting teams to anomalies in transaction patterns quickly, and ultimately protecting the business.

So, what do these wonderful advancements mean for teams operating the IT networks that allow these financial institutions to run?
Artificial intelligence and machine learning are too powerful to leave any industry completely untouched. In just these three examples, the emerging patterns are clear. Enterprises need to understand the impact of AI/ML on their IT networks; the business-critical backbone of their operation. If we expect engineering teams to maintain resilience and performance to support the future-focused enterprise, they need tooling that is up to the challenge.
AI with network assurance as a measure to continuously validate network state is a tool network teams can use to meet this challenge. To see how IP Fabric can offer end-to-end enterprise network visibility without making your life more complicated, try a self-guided demo today or request a tailored demo from our team.
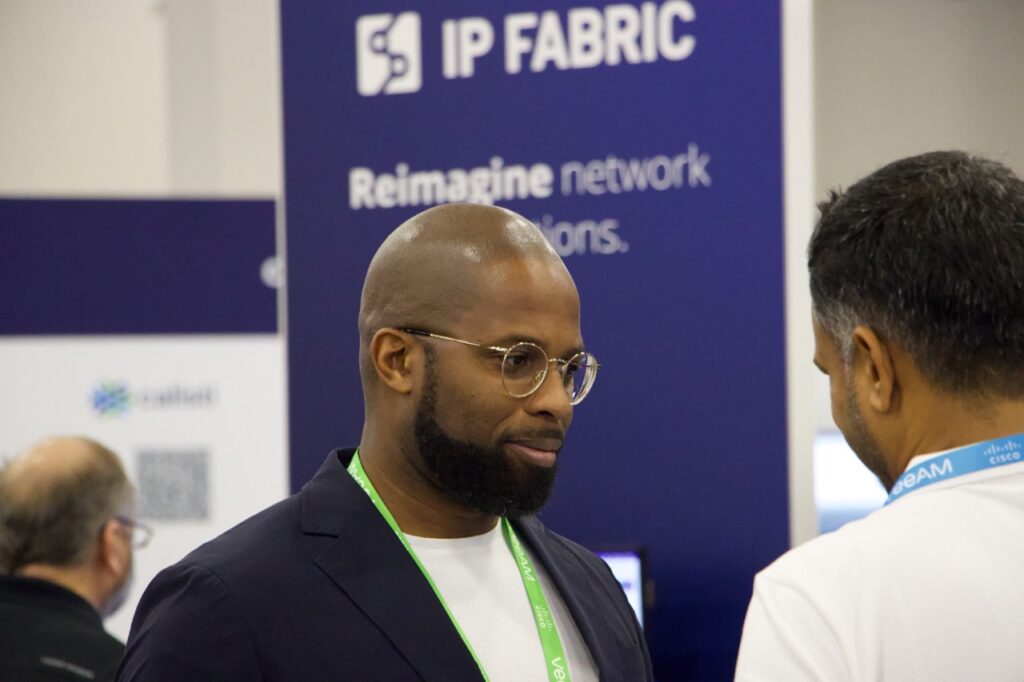
Team IP Fabric hit the Strip last week to enjoy the lights, sights, and of course, time with the horde of passionate technology professionals seeking out learning, connection, and a bit of fun at Cisco Live US 2023!
Our home in the World of Solutions showcased demonstrations of automated network assurance hosted conversations underscoring the value of IP Fabric to enterprise networks, and welcomed presentations from technology partners.
It's clear that network assurance is fast becoming central to the manageability of enterprise networks. With a palpable buzz around the possibilities that automation and AI/ML bring, it's key to acknowledge that a complete and accurate network baseline is step one in any of these pursuits. For more mature organizations, finding new uses for network data in operations, and the ability to query the network and get answers easily, rang through as a unique value add.
Read on for a recap of everything you may have missed, including our take on key announcements from Cisco.


Jordan Villareal and Jeremy Stretch from the Netbox Labs team joined us at the IP Fabric theatre. They demonstrated, along with Solution Architect Alex Gittings, the combined value of our integrated solutions.

Tim Shreyeck, a returnee to the IP Fabric spotlight, exemplified how to use Network to Code's source of truth and IP Fabric's automated assurance together for actionable network insights.

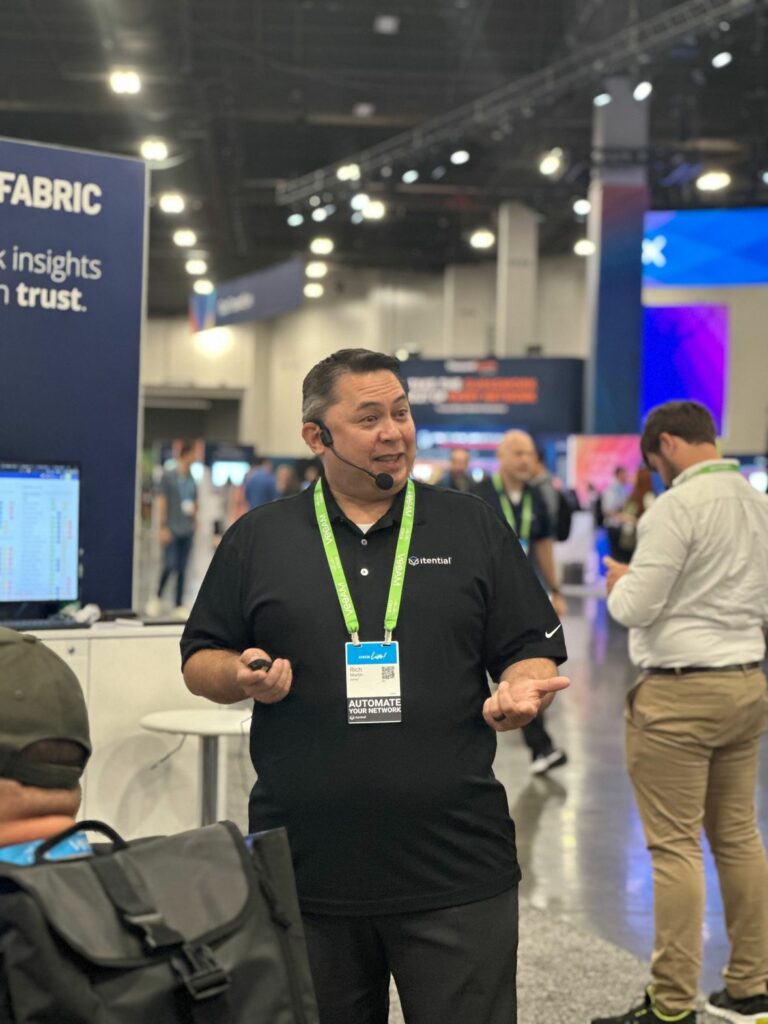
Rich Martin also took to our humble but mighty stage. He emphasized, once again, the powerful automation engine you can develop with fellow 2022 Gartner Cool Vendor in Network Automation Itential and IP Fabric.
Observability is something we've been thinking about a lot, so we were all ears when Cisco announced their Full Stack Observability platform.
A recent whitepaper - An Executive Blueprint for an Observability Platform - describes effective observability as "unifying, viewing, analyzing, and automating the entire end-to-end top-to-bottom digital infrastructure, encompassing core computing and cloud infrastructure, network, applications, security, and digital experience data to prevent downtime and negative impacts to customers." (IDC, May 2023).
In a network scope, our unified view of the network, automation focus, and open integration approach align with this vision of observability. IP Fabric could certainly offer the visibility and insights to effectively model the network underpinning an application and fit squarely into the network observability piece of Cisco's broader FSO project.
With our US presence rapidly expanding over the last year, Cisco Live was an opportunity for many of our EU and US-based team members to meet offline. Our international crew brings together perspectives from across the US and the world. We left Vegas with memories of real-life memes in action, and detours across half of Las Vegas for Thai food (involving questionable country music and a Google Maps mishap).


Our marketing team gained a new member, who we welcomed at Cisco Live! Abigail Jarin, who previously filled a Business Development Representative role, is our new US marketing specialist. Abby dove headfirst into the chaos with us! She embraced the opportunity to shake hands with IP Fabric customers and partners.
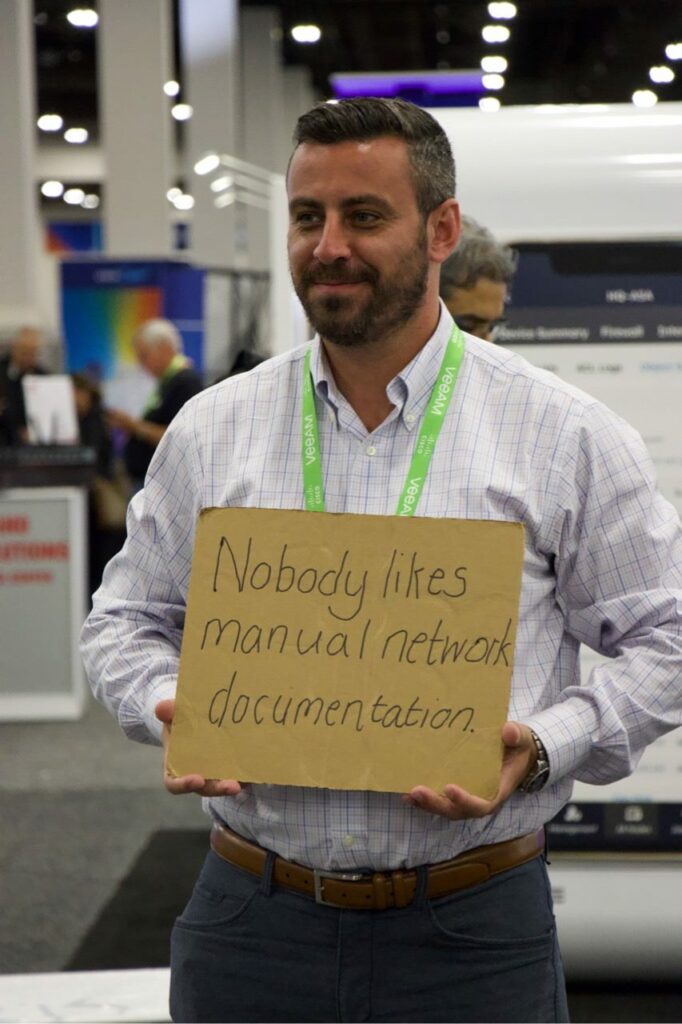
Reflecting on the week, Abby says: "I love getting that personal face time with people that are genuinely interested in our technology. Seeing eyes light up after mentioning the phrase “automated network documentation” is something I will never forget - that’s why I continue to do what I do here at IP Fabric."

See our LinkedIn for more updates on events that our team attends! Or, try our self-guided demo to see network assurance in action.
IP Fabric's GUI provides you with Excel-like tables for filtering and querying data, but sometimes engineers require data to be extracted for more advanced reporting or Power BI dashboards. In this blog, I will demonstrate how to directly connect IP Fabric to Microsoft Excel or Power BI without using CSV exports. This has been simplified into functions stored in template files allowing you to pull any IP Fabric table in seconds!
Documentation and template files are located in the IP Fabric Integrations GitLab.
You must have web API access to the IP Fabric server (default is port 443). If running these queries from Excel in Office 365 or Power BI in the cloud, your IP Fabric instance must be reachable from the public Internet.
Microsoft Excel and Power BI will only allow you to communicate with websites that have valid and trusted SSL certificates. The easiest solution is to install a trusted certificate on the IP Fabric server that has been signed by a CA in your Trusted Root Certification Authorities. If you are unable to create a signed certificate you are also able to use a self-signed cert and install it on your location machine. This must be done for every user/computer that will be running the Power Query and you will not be allowed to run these queries in the Cloud.
Finally, you will also need to have, or create, an API Token. This token will be saved within the file (or the data source on powerbi.com) so sharing is not recommended. We recommend either removing your personal token before sharing the file (or posting the file to a shared cloud space, i.e. SharePoint) or creating a limited read-only account and API token. If you need more information or assistance with read-only accounts and RBAC please reach out to your Solution Architect.
After opening either the Excel or Power BI template file there are two required configurations that must be done prior to accessing data. You may be required to accept some warning messages about communicating with external content prior to being able to continue.
In Excel open the Data Ribbon and click "Queries & Connections" and right-click the IPF_URL query and select edit. This will bring up the Power Query Editor where you are able to input your information. Example configuration:
12dd8c61-129c-431a-b98b-4c9211571f89If you are using Power BI when you open the template file you will be prompted with a pop-up to enter these variables. To access the Power Query Editor simply click "Transform data" in the Queries section of the Home ribbon.
Finally, you should be asked about data source settings prior to connecting, if not then select the Snapshots connection and in the Home ribbon in the Power Query Editor select select Refresh Preview. For the Credentials select Anonymous and for Privacy level either check the Ignore Privacy Levels box or select any level and press save. Once completed you should now see a table of the loaded Snapshots.
The queryIPF function simplifies the pulling of data with only one required parameter, the API endpoint of the table. This can be located by selecting the Table Description or the ? icon on any of the tables and copying the URL under the API Description. For example, I would like to pull my Inventory > Devices table into Excel.
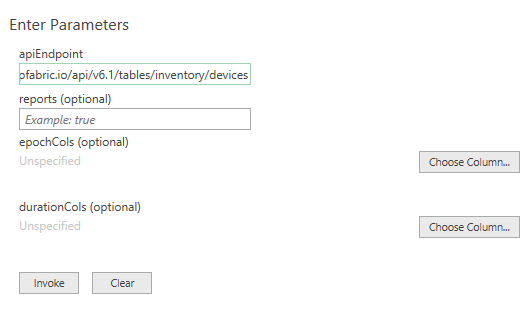
The reports variable defaults to false, setting to true will include the Intent Checks for the table if any are configured. This will be a new column named colname.severity where severity equals one of the following:
Once configured select Invoke (the epochCols and durationCols can be specified after invoking the function which will be discussed later).
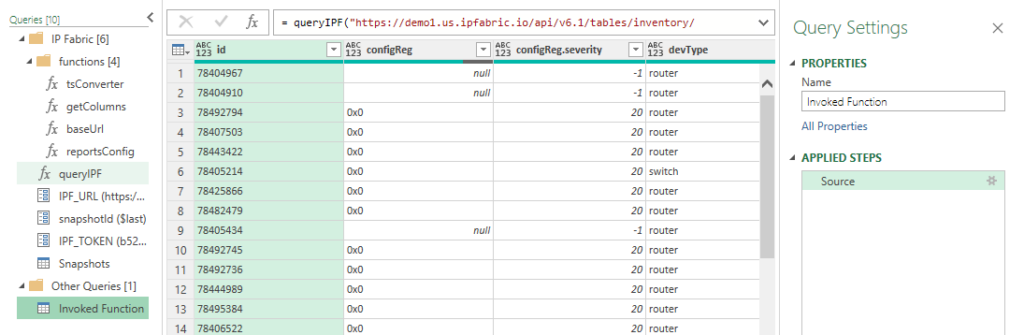
Now we have the Inventory > Devices table loaded. Changing the Properties > Name will change the Excel Worksheet name so it is recommended to update this value. In this example I specified reports=true and we can see the new configReg.severity column.
Finally, click the Home ribbon Close & Load which will update work workbook or to add more tables simply repeat this process for each table you desire! It is really that simple.
Times in IP Fabric are stored in two different formats. When you use the API you will see that an integer is returned unlike when you view it in the GUI. Let's take a look at these formats:
colnameAsDatecolnameAsTimeIn the Device Inventory, the uptime can be converted into a human-readable format in Excel. Simply change the query by adding a list and the column name.
Original:
= queryIPF("https://demo1.us.ipfabric.io/api/v6.1/tables/inventory/devices", true, null, null)
Modified:
= queryIPF("https://demo1.us.ipfabric.io/api/v6.1/tables/inventory/devices", true, null, {"uptime"})
This then converts 3435180 into 39.18:13:00 (39 days, 18 hours, 13 minutes and 0 seconds.)
Epoch example with the End of Life detail table:
= queryIPF("https://demo1.us.ipfabric.io/api/v6.1/tables/reports/eof/detail", true, {"endSale", "endMaintenance", "endSupport"}, null)
As valuable as contextualized network data is for your engineering teams, we know how insightful it can be also for adjacent teams, leadership, or third parties. Using our IP Fabric-developed Excel and Power BI template files, you can communicate directly with IP Fabric without exporting CSVs, seamlessly leveraging this data for high-level and detailed reports and presentations.
If you found this interesting and want to implement this in your environment, please look at the following quick videos for a visual demonstration and more advanced information. This includes how to work with nested objects and/or lists as well as joining tables. Reach out to your IP Fabric Solution Architect for more information or assistance!
Want to try out IP Fabric yourself? Sign up for our self-guided demo and see what automated assurance could do for your network teams.
Integrations between platforms and systems are essential to successful toolset management. It brings more value for both platforms that share data if done correctly. For my next integration journey for the IP Fabric, I chose one of the best tools on the market for log management - Splunk. I used Splunk extensively during my years in network operations. Its versatility for data visualization is fantastic. For example, I was detecting DDoS attacks and suspicious routing protocol flaps within areas, all while easily correlating with network changes. Let's break down how to successfully integrate IP Fabric with Splunk.
In general, there are two main types of integrations. The first is a one-way integration, where one system sends data to another. Here we use the power of the first platform (collect and manipulate data) to elevate the power of the second platform (ultimate data visualization). This is precisely what we will do to integrate IP Fabric with Splunk.
The second type is a two-way integration, where both systems use data from another and react. The second type requires either an intermediary system (or script) to create the integration logic, or both systems to be compatible.
A prerequisite for the data source (in our case, IP Fabric) is to have standard methods to read the data from the source. IP Fabric's API is brilliant for coders. It offers a full range of operations, and it's very well documented.
A prerequisite for the destination system (Splunk in our case) is understanding standard data formats - which Splunk is great for. With both conditions in place, let's start with the integration example.
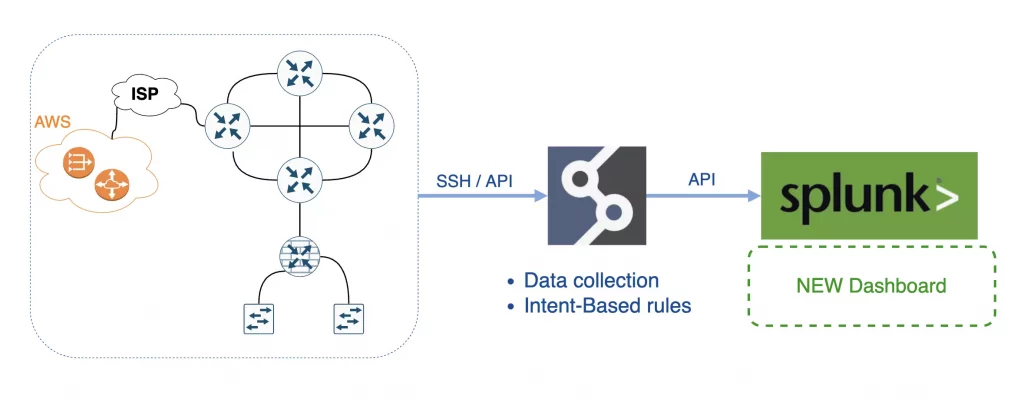
In short, IP Fabric is an Intent-Based Networking technology that serves as the foundation for network programmability, automation, and analytics by delivering critical information required to manage your network operations.
Splunk is the data platform that helps turn data into action for Observability, IT, Security, and more. And that's what we need.
I selected some of the essential metrics that IP Fabric regularly collects:
Then I included a couple of filtered data and intents:
Apart from the intent rules I picked from IP Fabric, 100 more default metrics provide valuable feedback from day 1.
First, I deployed IP Fabric, which took me about 30 mins to deploy on VMWare, and I could start the first discovery immediately! The goal was to regularly collect data from our virtual lab network (about 600 devices). The IP Fabric completed the first snapshot in about 18 minutes!
Second, I deployed Splunk with the developer license. I used a temporary license of the REST API Modular Input plugin to read the API data.
The next step was to configure Splunk to read IP Fabric's API. When I think about the whole integration, the only 'struggle' was to get proper API endpoints with the correct payload from the IP Fabric, which is no struggle at all! We have OpenAPI/Swagger available and dynamic API documentation on almost every page in the tool!
I created the Data Input in the REST API Modular Input plugin for each metric I needed to read in Splunk's GUI.
At the end of my journey, I created a new Dashboard in Splunk and combined all Data Inputs with more filters, for example:
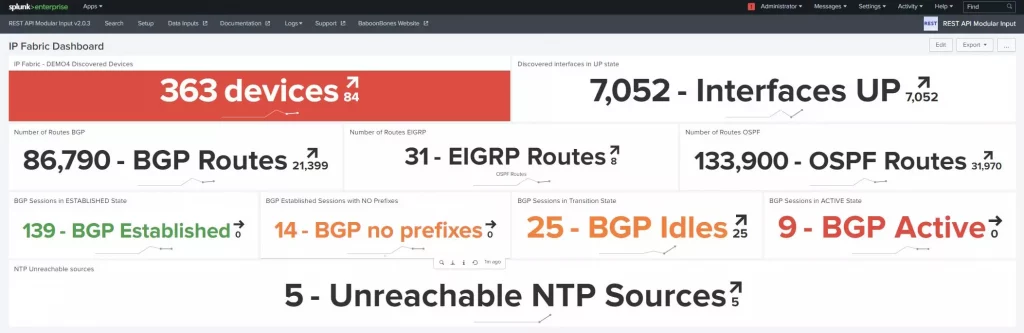
Then I configured regular snapshots in IP Fabric and let Splunk create a trending line for each input in its dashboard.
Everything is about data. That's where the power is. With IP Fabric, everyone has a unique opportunity to access any operational data from the network they need quickly and accurately. The only actual limit is one's imagination.
The ultimate goal for any network or security engineer is to use available data efficiently to keep the network up and running and avoid the unexpected - and that's where the IP Fabric's involvements stand out.
Are looking for more technical details about how to integrate IP Fabric with Splunk? Please contact me directly on LinkedIn or Twitter, as I am more than happy to provide more guidance on my struggles.
If you have found this article helpful, please follow our company’s LinkedIn or Blog, where more content will be emerging on useful topics like the Splunk integration discussed here. If you would like to test our solution to see for yourself how IP Fabric can help you manage your network more effectively, please get in touch - schedule a demo with IP Fabric.
The IP Fabric platform is a very unique and innovative system. It ultimately combines traditional approaches and new ideas, which may generate further misconceptions or simply misunderstandings. After hours or possibly days spent with first-time users of the platform, I decided to explain the most frequent issues or questions raised during the proofs of concept and customer enablement sessions. And here they are.
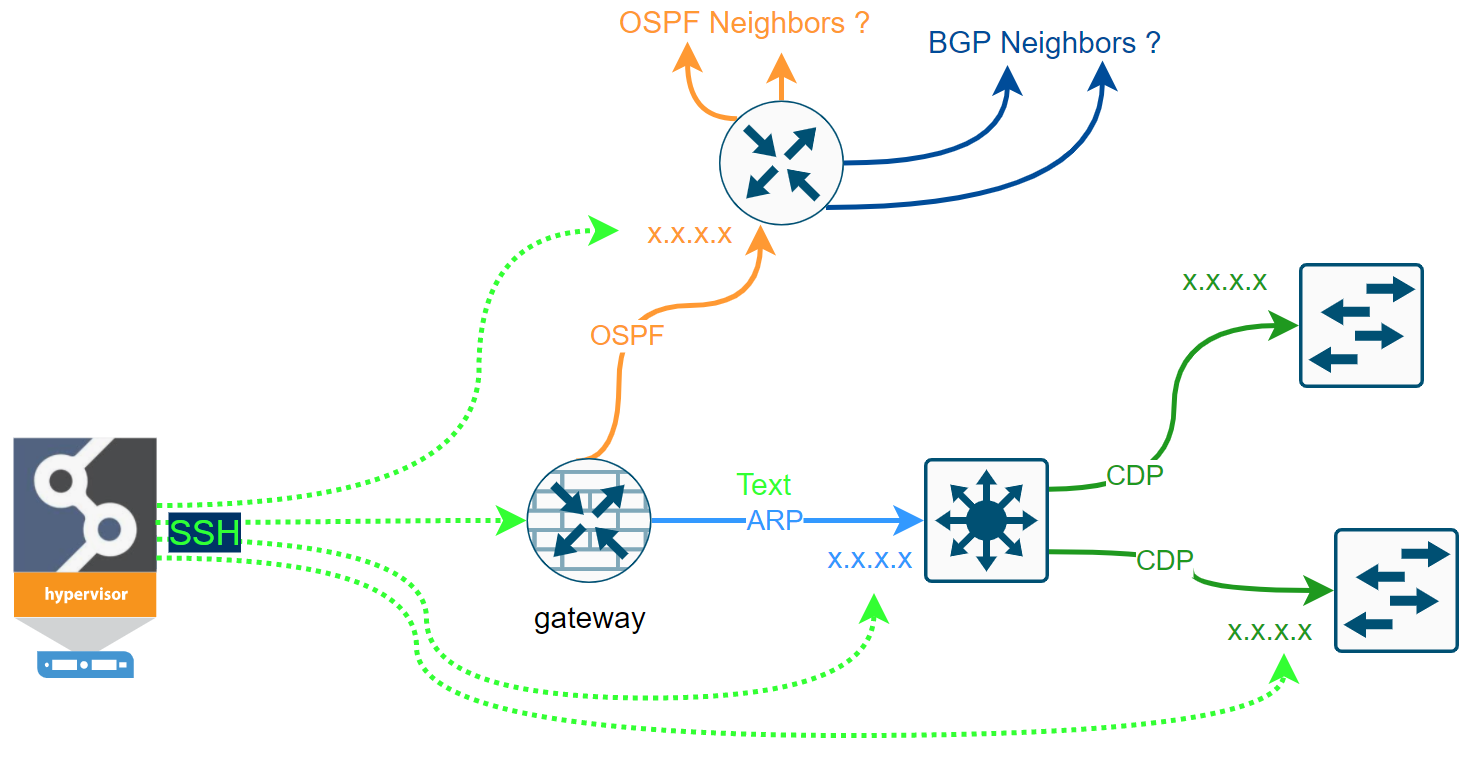
At first, let me discuss the IP Fabric's discovery process for a bit. We clearly cannot move forward until we touch on the core feature of the system, which the discovery process is. IP Fabric's discovery feature maps out the network infrastructure similarly as the network engineer would. What that means is that we only need credentials (or a set of credentials) and a seed device (router, l3 switch, or a firewall) to begin.
If we can log in successfully and read the data from the first device (ARP records, STP, CDP, LLDP, routing protocol sessions, or others), the system should have enough data to decide where to go next to repeat the process. For data gathering, the system only uses SSH (or Telnet) and API requests. The simplified discovery process can be seen in the flow chart below.
Some networks are more accessible than others. We may have issues with the first-time discovery of isolated network segments behind the router that we cannot authenticate to. But most of the first issues we can resolve by analyzing the logs and adjusting the discovery settings.
Once the discovery is complete, the admin can fully enjoy new data every day in the form of Snapshots automatically. Following video describes some of the use cases.
How is it possible that IP Fabric did not find anything? And that's an excellent question! Fortunately, this is very easy to troubleshoot. Here are viable reasons to think of:
There's Settings > Discovery Seed in the system, which is optional that appears during the Initial Configuration Wizard. However, if we don't provide any Seed IP, at first, the system will try to connect to its default gateway. If it fails to authenticate to its gateway, it will send a traceroute towards 'dummy' subnets hoping more IP hops will appear along the path as potentially the next starting points.
Now without any Seed IP configures (and without any previous snapshots available), and if IP Fabric fails to authenticate to its first gateway and when there are no other IP hops to test, there's nowhere to go next, and the discovery process stops.
To avoid this, I strongly recommend using at least one or two IP addresses of well-known devices that we safely authenticate to and can use as a starting point for discovering the rest of the network.
Now we provided the Seed IP correctly, we have the username and the password right, and we still don't have anything! How's that possible? Well, fortunately, that's easy to troubleshoot as well. Suppose we still do not have any devices discovered. We very likely couldn't authenticate or successfully initiate SSH connection to the Seed device, and we don't have any other IPs to test. Where to find the Connectivity Report for every snapshot is at following picture:
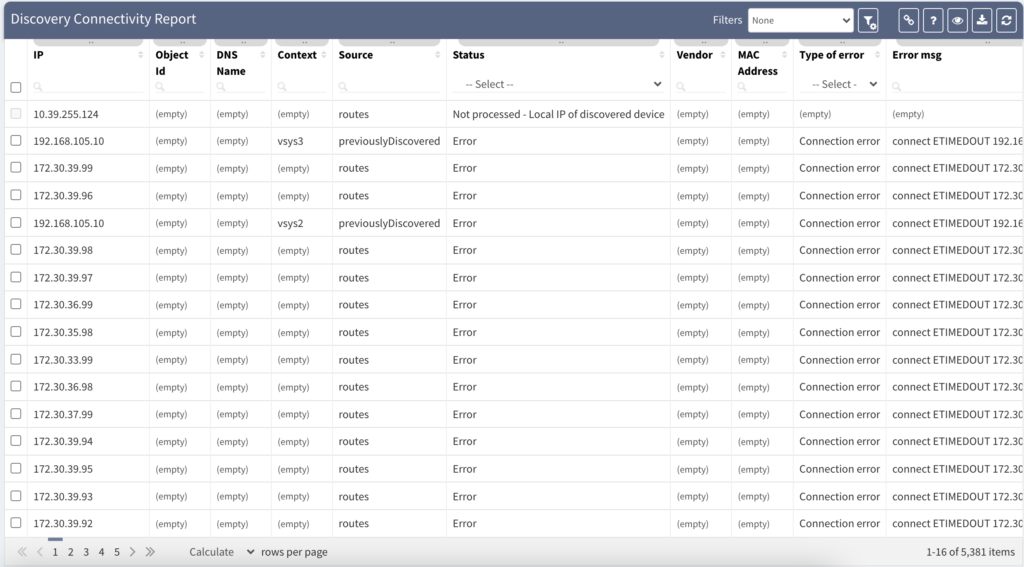
The platform is fully transparent. Every action, command, or testing is logged and available to the user. The best place to look at is the Connectivity Report. The Connectivity Report serves as a register for all outbound connections attempted with detailed data that either indicate success or failure.
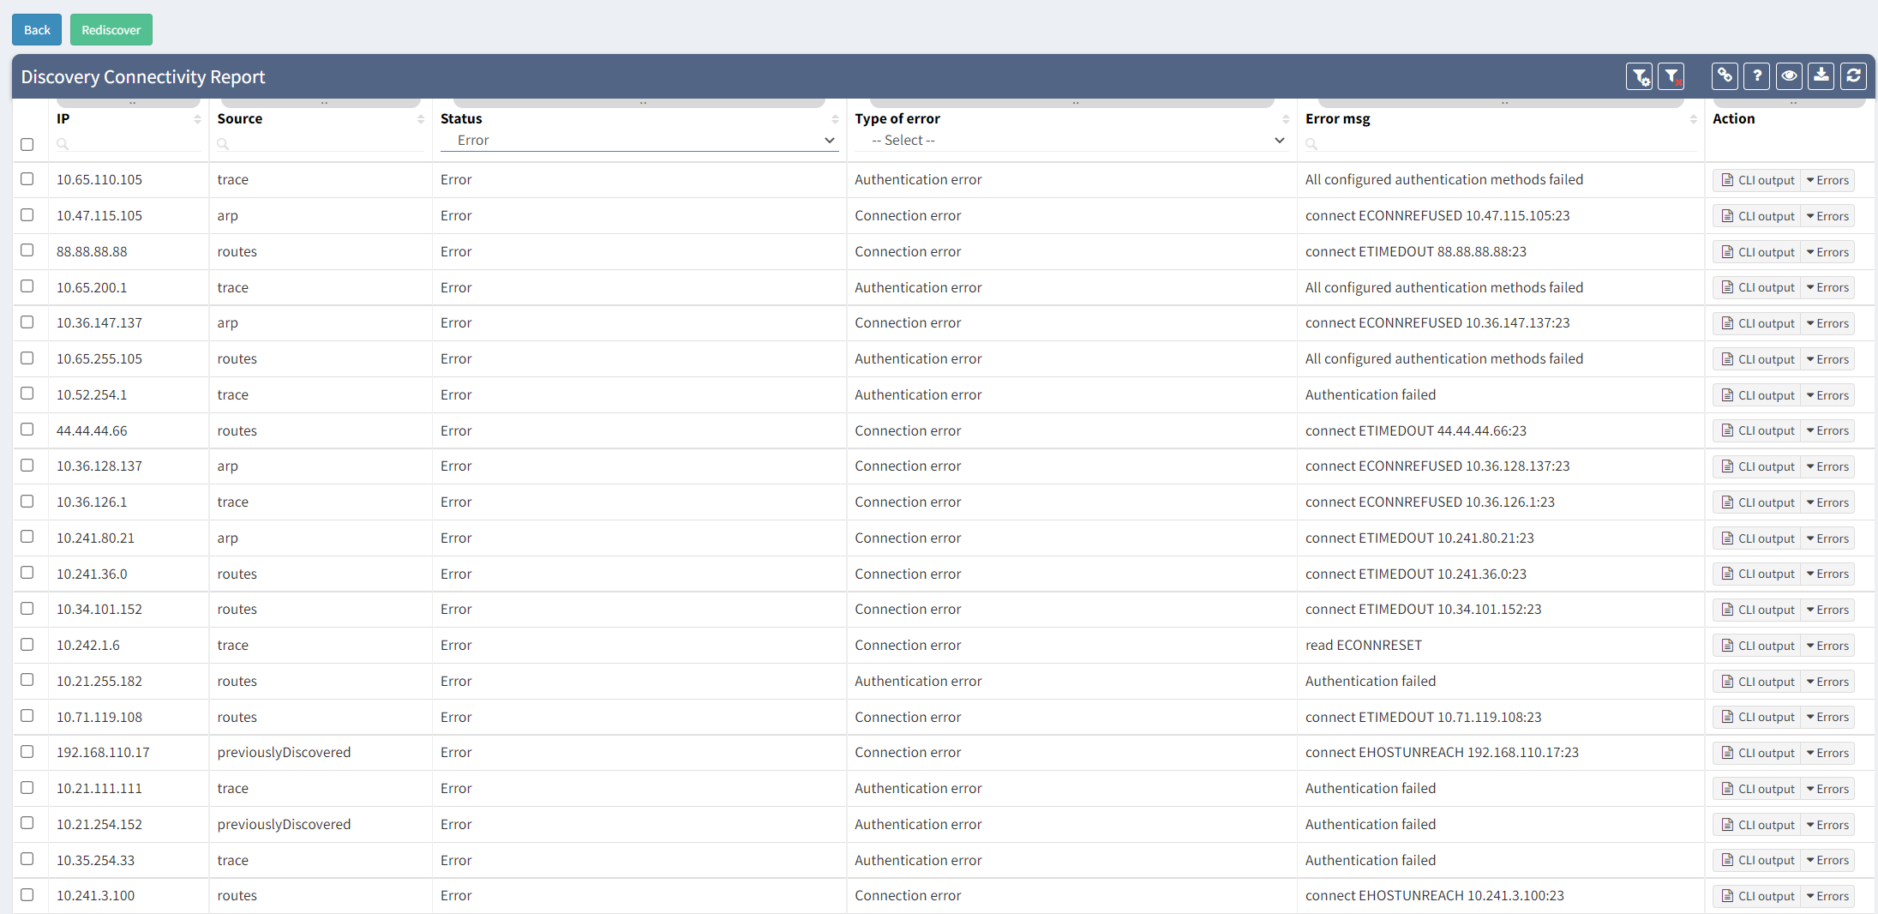
An example of the Connectivity Report output can be seen above. We can clearly observe which IP addresses were tested with an error and what was the main reason.
The most common issue during the first snapshots is the Connection Error or Authentication Error. The Connection Error indicates we were unable to initiate SSH/Telnet connection to the network device, and we didn't have any prompt for username and password. The main reasons are that we are either blocked by a firewall or by the device itself (Access-List or Firewall filter applied).
The Authentication Error indicates that we could initiate a connection and received the prompt for the username and the password. Still, our credentials are incorrect and need to be updated. We need to update our authentication database in Settings > Authentication and retest the discovery.
To successfully discover any network device and collect the data, we need to make sure that we understand the software. If it's IOS, Junos, or other operating-system among the most common – there are differences in operational commands used and, most notably, the responses provided. The IP Fabric platform has to be as accurate as possible and to ensure 100% accuracy. We need to support the vendor/platform or operating system that we ultimately ingest into our network model.
When IP Fabric successfully authenticates into an unsupported network device, it exits with failure after several attempts to detect any known operating system. The supported network vendor list is growing every release. If your current network equipment is not supported now, it doesn't necessarily mean it will not be in the future. Feel free to contact any IP Fabric representative for more information or request a trial.
Your business relies on IT to deliver services to your customer. But what happens when there is a failure, can you afford downtime?
Whether or not you can afford it, you should ask yourself this question: how to manage network risk to maximise service availability?
In this blog post, we are going to identify some risks you may be facing today, so you can understand better how to tackle them.
It is extremely important to have the full picture of your network. You cannot correctly manage devices or infrastructures you do not know about, or only have partial information.
The inventory is often used as the source to define the list of devices you will have under maintenance. What happens if a device fails and is not under maintenance?
You will need to order a replacement, which could take days, weeks, or more to arrive before you are able to restore the service. In the best-case scenario, the service is resilient, so only resiliency is affected, but while waiting for the replacement to arrive, you would be in a situation where you cannot afford for anything to fail.
In the worst-case scenario, if the service is not resilient, the service will be unavailable until the replacement of the faulty device.
So, we understand that maintaining an accurate inventory is crucial, but it can be very challenging:
We have a very similar problem with the documentation of the network and making sure it stays up to date. Otherwise, you are at risk of not being able to solve efficiently any issue arising on your network. A partially updated diagram could be very misleading for any change preparation or troubleshooting. This could cause unnecessary downtime which can be avoided.
Obviously, you may have processes in place to ensure diagrams and relevant documentation are accurate. But we all know that this is very time consuming, and let’s be honest, there are some more exciting projects you would rather be working on.
Monitoring tools are there to alert you of an issue, but what happens if there are some anomalies which are not considered as an issue, i.e., no SNMP traps are sent, nor syslog, and you have not experienced any symptoms because the problem is only on a backup link or device.
How do you detect these inaccuracies to fix them before they become service affecting?
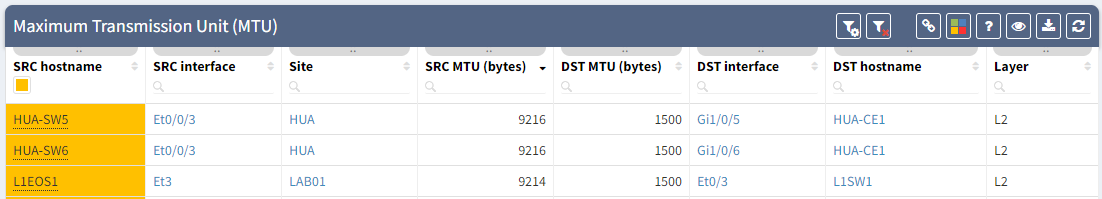
MTU can be the source of issues when the MTU is not configured consistently, for example, you have a primary path working as expected, but the backup is misconfigured. It means you will only notice the issue once the primary path fails.
It can be difficult to confirm MTU is correctly configured on all your devices: how long would it take you to collect the information for all the interfaces’ MTU, parse that data and analyze it so you know for each link how is the MTU configured on both end?
Having instant access to the links with inconsistent MTU, allows you to be proactive, so you can fix any links which could be causing issue on your network.
The second hidden issue I wanted to discuss here, has caused a major downtime in my previous experience: a BGP neighbor with no received-prefixes.
This is the situation we were in, two BGP neighbors to a service provider, but on the backup router, we were not receiving any prefixes. BGP session was still established, so no issue from our monitoring tools, everything “seemed fine”.
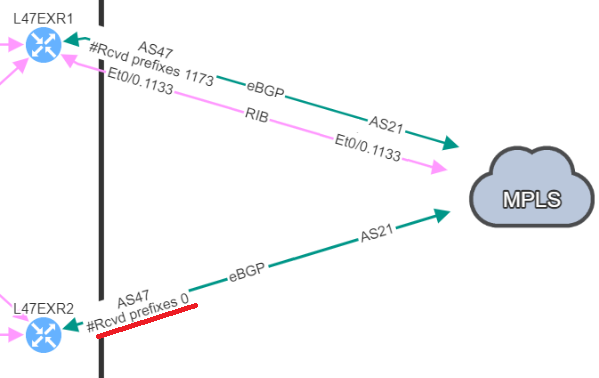
And one day, it happened: we lose our primary connection, and here starts our massive downtime. We no longer have access to this service.
We knew the resilient path had been working in the past, but what we didn’t know is that it wasn’t working anymore. How can we detect this so we can resolve similar issues before they cause downtime?
For further information on this point, you can check the following blog post: BGP resiliency and received prefixes | IP Fabric | Network Assurance
Those examples show how you could be facing an issue on your network and be totally unaware of the situation.
We want to be proactive as much as possible to avoid any downtime, but there are situations when issues happen. So, we need to be reactive and work efficiently in order to restore the service.
Using IP Fabric’s End-to-end path, will very quickly display all devices involved with passing traffic from a source to a destination. IP Fabric doesn’t just look at the network data, it includes firewalls in the path, so you can visualize any policies which may block the traffic.
With such a tool at disposition, it becomes easy to quickly pinpoint the source of the issue without having to connect to any devices, check the logs on different firewalls or spend time finding the latest diagram. Everything is available in one single and dynamic view:
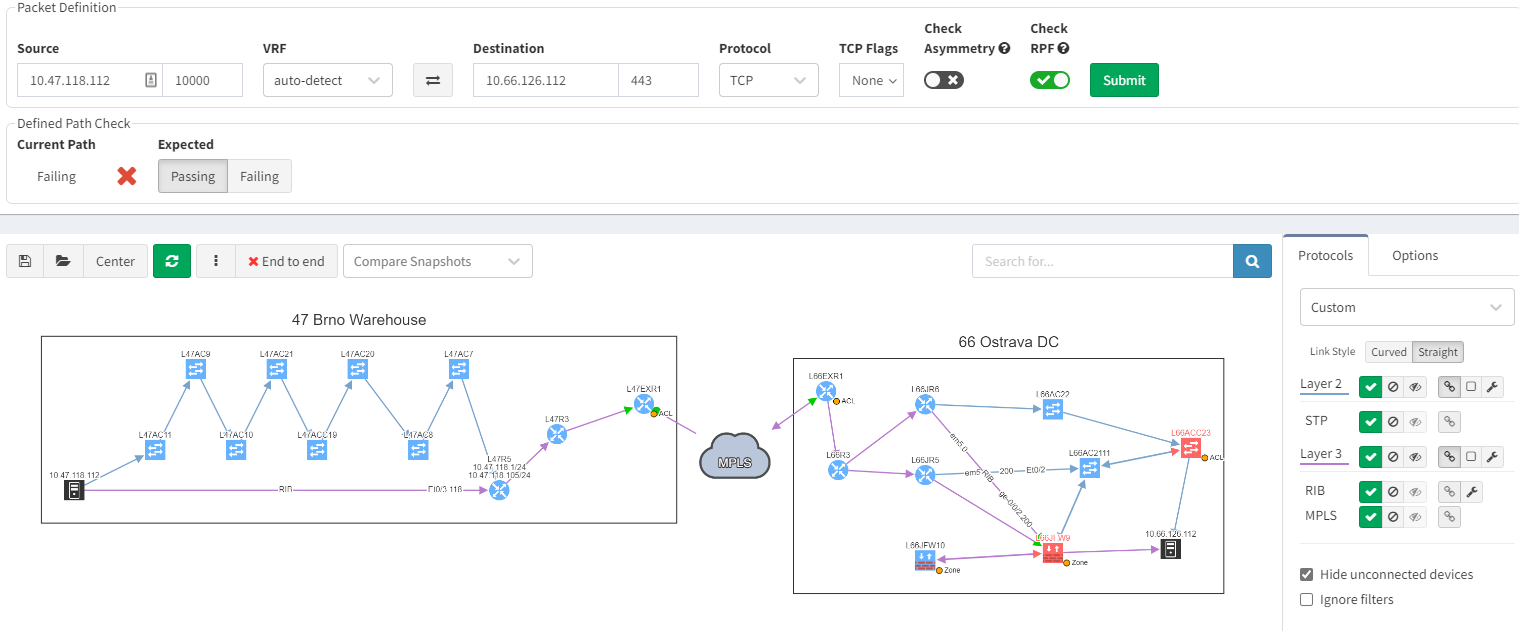
When you are troubleshooting, you often lack the understanding of how it was working before. It would be very useful to have a view of a previous topology, for example, from the day before. Then, by comparing both topologies, you can observe and quickly identify what has changed:
In the example above, you can see in the previous snapshot, there was only 1 link to the MPLS cloud, the 2nd one in red was not present, but is operational in the latest snapshot.
IP Fabric, as a network assurance platform, shines a torch on all those weaknesses and proactively inform you of potential issues existing in your network.
There is a lot more IP Fabric can help you with. To explore further, join our webinar on the 30th of June at 11am CEST: IP Fabric - FSI Webinar You can get in touch with us through www.ipfabric.io and follow our company’s LinkedIn or Blog, where more content will be emerging.


