Back in 2017, a report by Gartner stated that the trends in network evolution were being outstripped by developments in the rest of the infrastructure, with a view to delivering business services in an agile, scalable, and resilient manner. 4 years on and with developments in pockets of the network via SDN deployment, it seems the rest of the network is beginning to catch up, however only in concentrated pockets.
IP Fabric recently held our inaugural #CommunityFabric webinar with delegates from the EMEA network automation community representing architectural leadership, automation gurus, and renowned certification instructors throwing their hat in the ring for a discussion on all things network automation. The discussion highlighted the disconnect between technical teams and leadership on the importance of network automation and some clear takeaways for Technical and Business Leadership.
Resources – Engineers need to invest their time in adding network programmability to their arsenal of skills, but more so, businesses need to invest in their teams by aiding this transition however possible.
Top-down Strategy – A business hoping to reap the benefit of automation without a top-down strategy will end up with islands of automation, siloed teams and added complexity or worse, disenfranchised team members.
It's a Marathon, not a Sprint - Adopting network automation is not a silver bullet. Like any well actioned strategy it requires clear measurable goals, consistent and repeated communication and time to succeed, both financially and operationally.
Future trends and what is Network Assurance?
The introduction of automation into your strategy and technology stack represents an immense opportunity to deliver higher-value services to the business at greater speed and with improved security. Want to get the most of your hallmark investments in AWS or get the promised security improvements from your new policy and firewalls investment? Automation is the glue to piece together areas of specialised technology in a scalable and repeatable manner.
Manual processes are rife in network operations and whilst they dominate the time schedule of many of your engineering resources, deliver very little value back to the business. Automation promises to draw down these painstaking process steps, along with their associated cost and risk, allowing highly skilled and certified engineers to focus on what they were trained to do, architectural design, cybersecurity, and execution against your organisation's well-designed compliance framework.
Unfortunately, automation doesn’t represent a flick-of-a-switch investment and a clear path to value. It is a mantra and an ongoing investment particularly targeted at your engineering team members, their certification, skills, and mindset. Both mantra (read company mindset) and ongoing investment resonate with one thing, Top-down strategy. If you wait for automation to naturally flourish from individual engineers’ interests you’ll find yourself stuck in the laggard position in the market, not a good place to be from either an innovation or recruitment standpoint. If however, you build an organisation that not only praises engineers adding network programmability skills to their traditional network engineering knowledge and certification base, but creates an environment where automation-first is the prevailing mindset, you will be on the right path to reap the benefits.
Investing in an organisation’s technical Resources must be prioritised within the company’s strategy. IP Fabric’s lead partners either side of ‘the pond’ Axians in Europe and Myriad360 in the US, understand the value of automation both to their internal service delivery functions and externally to their customer-facing services and as such invest heavily in network programmability skills to help their customers along the journey to automation. This investment by your service provider partners will represent cost-saving on both sides of the fence, not necessarily in the overall invoice value but in how much of that invoice is being needlessly spent on low-value repetitive tasks as opposed to high-value transformational engagements.
As for Future Trends, well unfortunately the #CommunityFabric RoundTable discussion ran out of time before we got into the clouds of future possibility, however, do not fret, on May 27th the 2nd #CommunityFabric Roundtable will focus on exactly this, Next Generation Network Management (registration link below). What was clear from our delegates, however, was that automation isn’t a straight path with predictable trends, but a fluid community-based investment in greater networking practices and increasing returns from advanced technology, which requires fortitude from senior management to fully realise its true value to an organisation.
Some elements of the perfect automated network will be scripted from the ground up by the in-house resources and network programmability skills you’ve invested in. Some crucial functionalities will have already been built by commercial vendors of a different ilk. New-world vendors who’ll fit your Automation strategy will be interchangeable, subscription-based services with simple integration and rapid time-to-value, meaning that as the world of automation evolves the technology can flex to your needs and you can choose your vendors, partners, and crucial building blocks for innovation based on service quality, trust, and value-add.
So, closing thoughts. Network Automation is a crucial building block to your network strategy. Whether you buy it from IP Fabric, have your team build an equivalent in-house, Network Automation is the mechanism through which you can give speed and flexibility to your teams. With a centralised, compliant view on your production network made accessible to all those who need it, written in the language in which they can consume it, you deliver a unifying dataset for clarity, reporting, and future-proofing your technology investments.
To find out more, check out IP Fabric’s YouTube channel for demos of our PRTG integrations. Look at our other blog posts on the website to learn how our partners and customers are integrating IP Fabric with their wider operational ecosystem, and to join the #communityfabric webinar click here - https://ipfabric.io/webinars/webinar-ask-communityfabric-anything-2/#register
The network management platform is a universal tool, that should allow monitoring and configuring of all network devices. But there may be more pieces to the puzzle. We will try to unveil some of the options for network management and how well-targeted analytics can be complementary to the solution.
Every network management should include some kind of monitoring solution. But they are mostly only static tools based on information that the administrator provides. The monitoring is usually based on ICMP probes or SNMP data regularly collected from the network. Therefore, it answers many questions those including:
But there's one very important one that should be asked at the very beginning. What is in my network?
In any complex network, the automated network discovery should be answering just that. The IP Fabric analytic platform is equipped with a discovery algorithm that frequently collects data. It can identify new devices or technologies on the network and track changes in time. The frequency of snapshots depends on everyone's needs. It can be either once a day, four times a day or anytime on-demand.
With every new discovery snapshot, there are new data available and possibly new interfaces or devices to monitor. In conclusion, various monitoring or network management platforms are capable of reading data from other APIs. Imagine that after every discovery, you could automatically add new devices under the monitoring.
Network management and support systems can change in the process of every network development. For every change, the network needs to be adjusted. It can be either adding new SNMP servers for collecting data or change the Syslog server for security perimeter. After every implementation, we need to verify that all was configured or changed correctly.
This type of verification is usually not provided by standard support systems. The administrator has to either manually collect and verify a big amount of data or pray for the best. That's where the network analytics comes into place. With automated verification schemes, the IP Fabric provides compliance on the fly. he platform collects and verifies data periodically with every new snapshot. Users can adjust each individual compliance easily in the system and just watch the results.
CMDB (Configuration Management Database) is a must for any live network environment. If anything breaks one needs to have all possible config backups. Comparing the differences after any change should be standard as well.
The CMDB, Inventory and monitoring system should be always up to date and this should exclude manual intervention almost completely. The more the data reliant on manual update the more chances are it's never going to be 100% accurate.
Data collection from multivendor networks means to spend a lot of time on development and constantly troubleshoot output or you can simply use systems like IP Fabric that have been designed specifically for this task, hardened through time. Gathered data serve as a baseline for all operations and overall administration.
If you have found this article resourceful, please follow our company’s LinkedIn or Blog, where there will be more content emerging. Furthermore, if you would like to test our platform to observe how it can assist you in more efficiently managing your network, please write us through our web page www.ipfabric.io.
Enterprise networks should never have Single Points of Failure (a.k.a SPOF) in their daily operation. SPOF in general is an element in a system which, if stopped, causes the whole system to stop.
Single failure (or maintenance or misconfiguration) of any network device or link should never put a network down and require manual intervention. Network architects know this rule and design the networks like that — placing redundant/backup devices and links which can take over all functions if the primary device/link fails.
But the reality is not always pleasant, and today’s operational networks can include SPOFs without anyone explicitly knowing. The reason is that even though the original design put all SPOFs away, the network may have evolved in the meantime, and new infrastructure may have been connected to it.
For example:
Part of the network operation activities should take into account that SPOFs may appear unexpectedly. This require advanced skills and lot of time to go trough routine settings and outputs if the networks is still resilient and high available. It also requires expensive disaster-recovery exercises to be performed regularly.
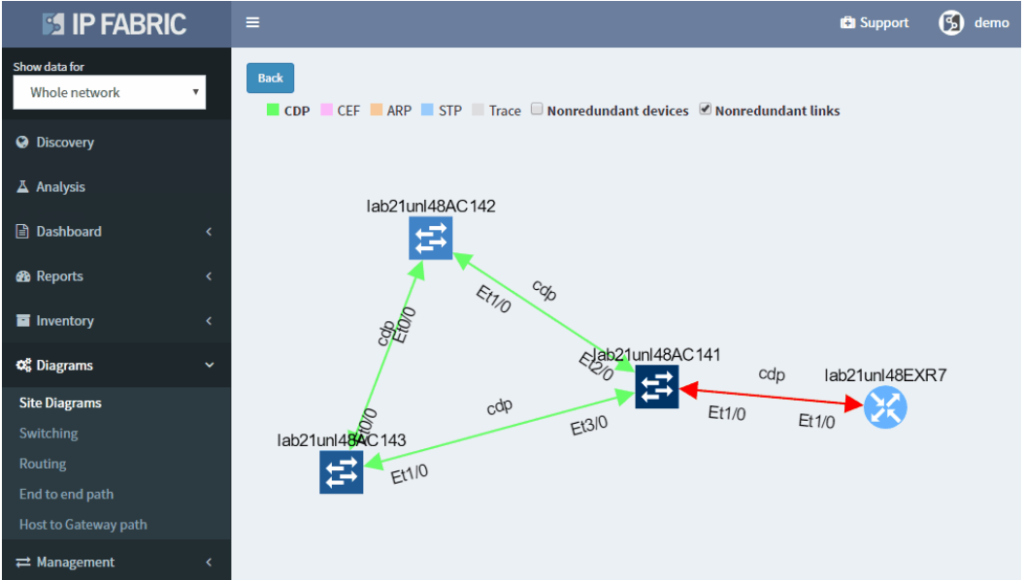
IP Fabric helps with finding of non-redundant links and devices in the network in its diagrams section.
It does not matter if the SPOF is Layer 2 switch or Layer 3 router — those are all in the critical chain of application uptime. Device and links which form SPOF will be highlighted.
Additionally, networks with many small sites have automatic grouping of small sites into redundant and non-redundant groups in IP Fabric. Groups allow to easily spot sites with non-redundant transit connectivity.
If you’re interested in learning more about how IP Fabric’s platform can help you with analytics or intended network behavior reporting, contact us through our website, request a demo, follow this blog or sign up for our webinars.
Network engineer/architect can use diagrams to speed up many of his routine tasks — from overview presentation of the network to the detailed troubleshooting of faulty data flow from the client to server. But regardless of the task type, there is always a requirement that the diagram uses the same “language” as other people do when depicting the network. It means that the diagrams follow:
If those requirements are not met, then the mental capacity of the viewer is consumed by mapping names and device positions from the generated diagram to the concept that he is familiar with. The layout can be adjusted for one time and the sites renamed but if next network discovery forgets those adjustments, it is pointless to do so.
The IP Fabric platform offers to assign any name to any location that it discovered and this name will stay the same even if the network is rediscovered again. Position of the devices in the diagram can be freely adjusted according to engineer or organization customs (ie. somebody prefers to have users on top, somebody on the bottom. Somebody prefers to place core devices in the center of the diagram, somebody creates a separate block, etc.).
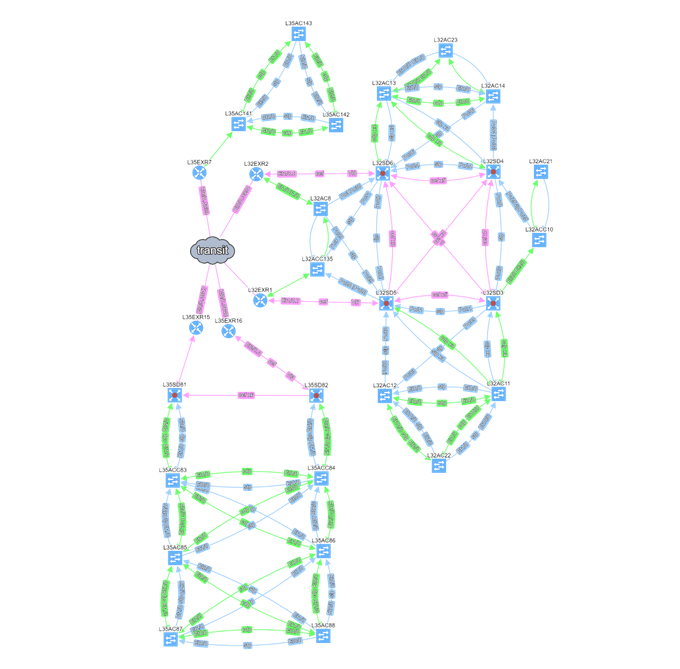
The final layout is saved and is thus persistent regardless of how many times the network is rediscovered. If something changes in the network, then it is reflected in the new diagram. But the global layout remains in the form which is well understood by all people around the network and most importantly by the network engineers/architects — without wasting their modeling effort put into the first diagram.
If you have found this article resourceful, please follow our company’s LinkedIn or Blog, where there will be more content emerging. Furthermore, if you would like to test our platform to observe how it can assist you in more efficiently managing your network, please write us through our web page www.ipfabric.io
The IP Fabric platform is a network engineer's best friend when performing deep network audits. For example, to verify root placement for overlapping VLANs in a LAN, I would normally need to look through the STP roots, and painstakingly trace L2 links, reconstructing the topology of each instance.
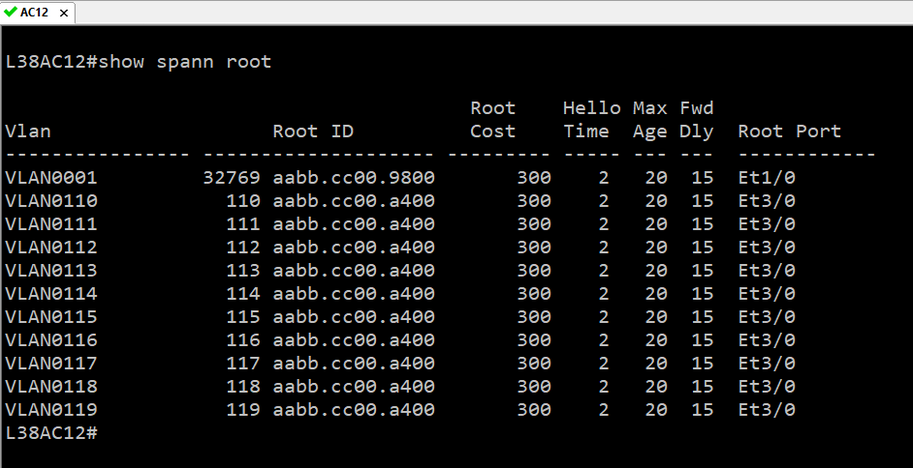
For example, to verify root placement for overlapping VLANs in a LAN, I would normally need to look through the STP roots, and painstakingly trace L2 links, reconstructing the topology of each instance.
With the IP Fabric platform, I can just grab the hostname of the device, and look it up in the device inventory to find the corresponding switching domain the device belongs to.
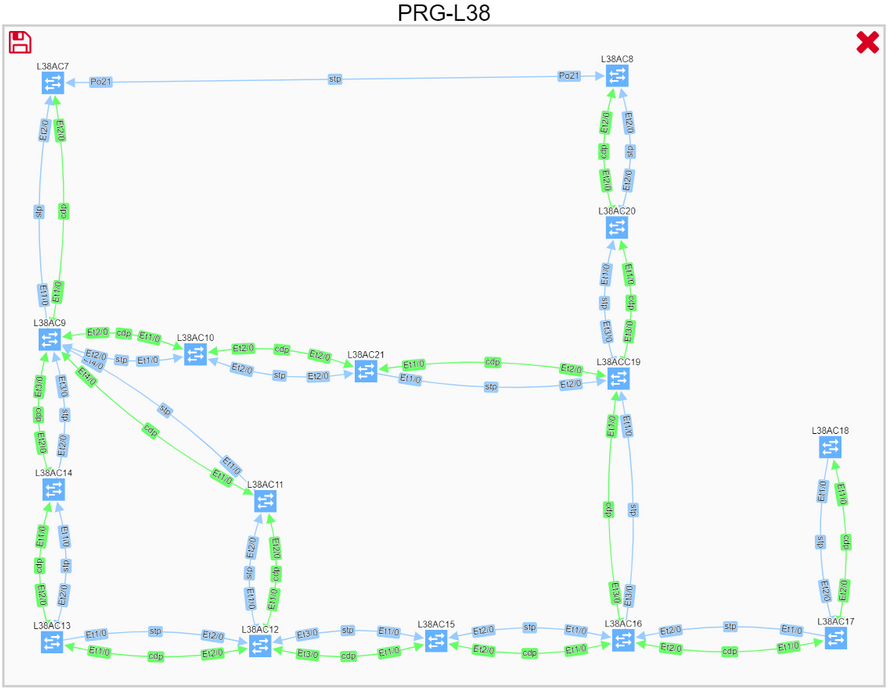
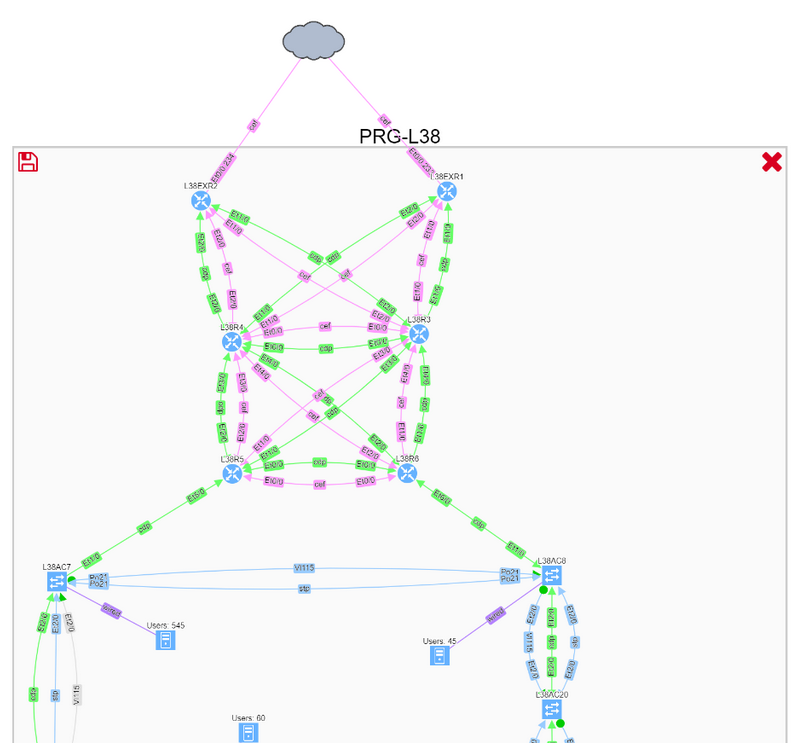
Click on the switching domain visualizes all overlapping spanning-tree instances. We can check the topology of a specific VLAN by adding the instance to the graph.
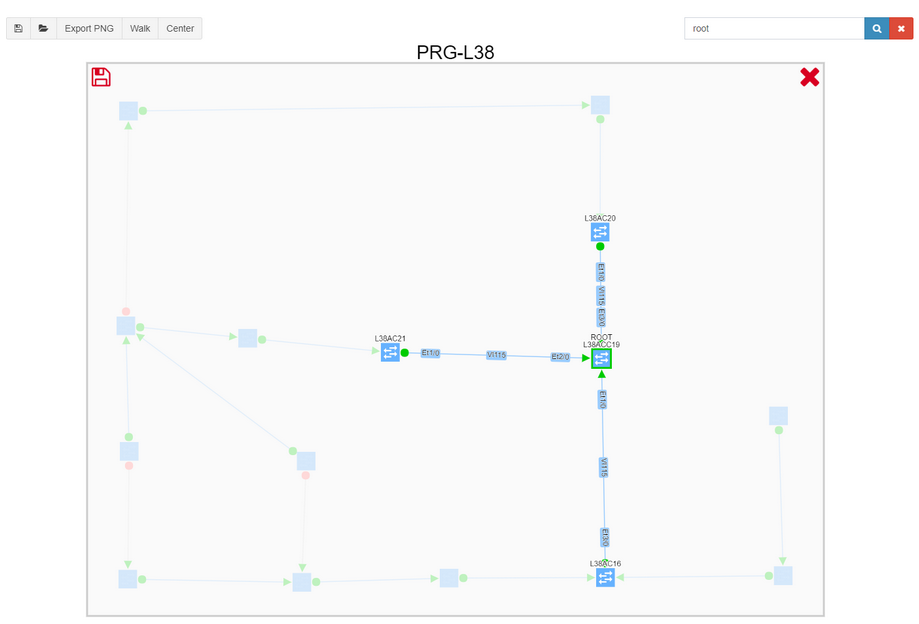
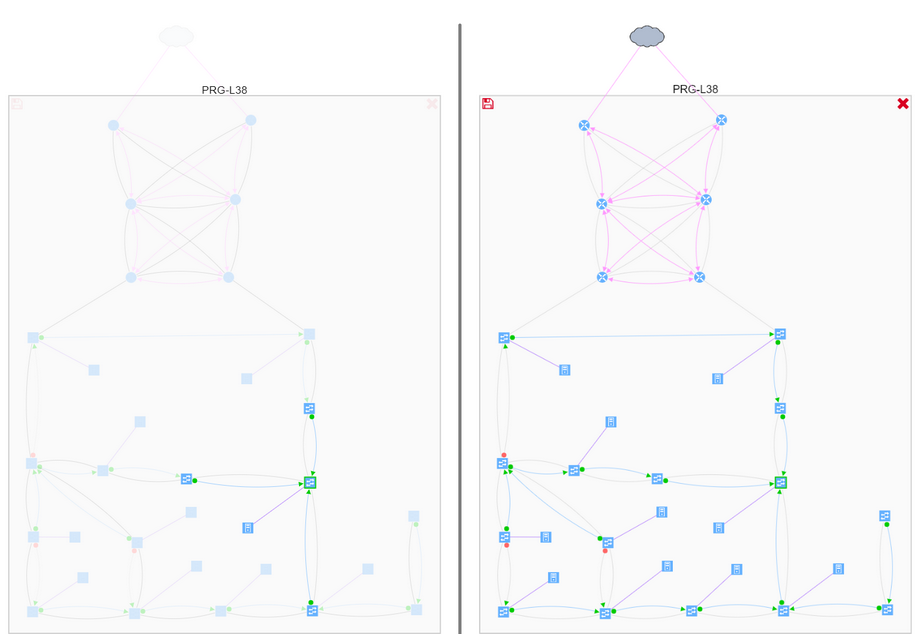
We can then search for root, and filter excess information to get a better understanding of the VLAN topology, including blocked links.
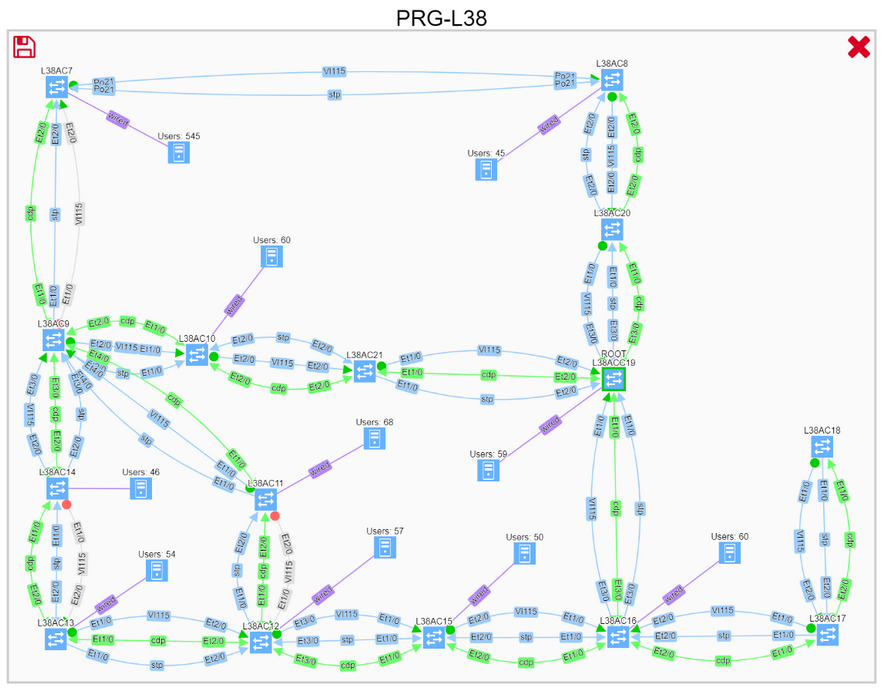
Thanks to graph math, we can instantly perform what-if scenarios, such as finding non-redundant links, displaying the location of the users, or adding a corresponding routing domain, to better understand communication needs, and see where the optimal root placement would be considering site’s edge.
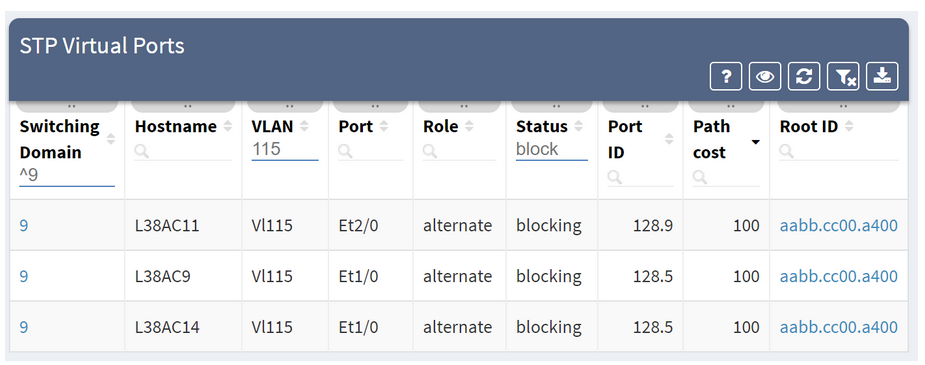
We can also drill down into further details all the way to the virtual port level, to make a sound engineering decision and understand any potential risks.
If you have found this article resourceful, please follow our company’s LinkedIn or Blog. There will be more content emerging. Furthermore, if you would like to test our platform to observe how it can assist you in more efficiently managing your network, please write us through our web page www.ipfabric.io
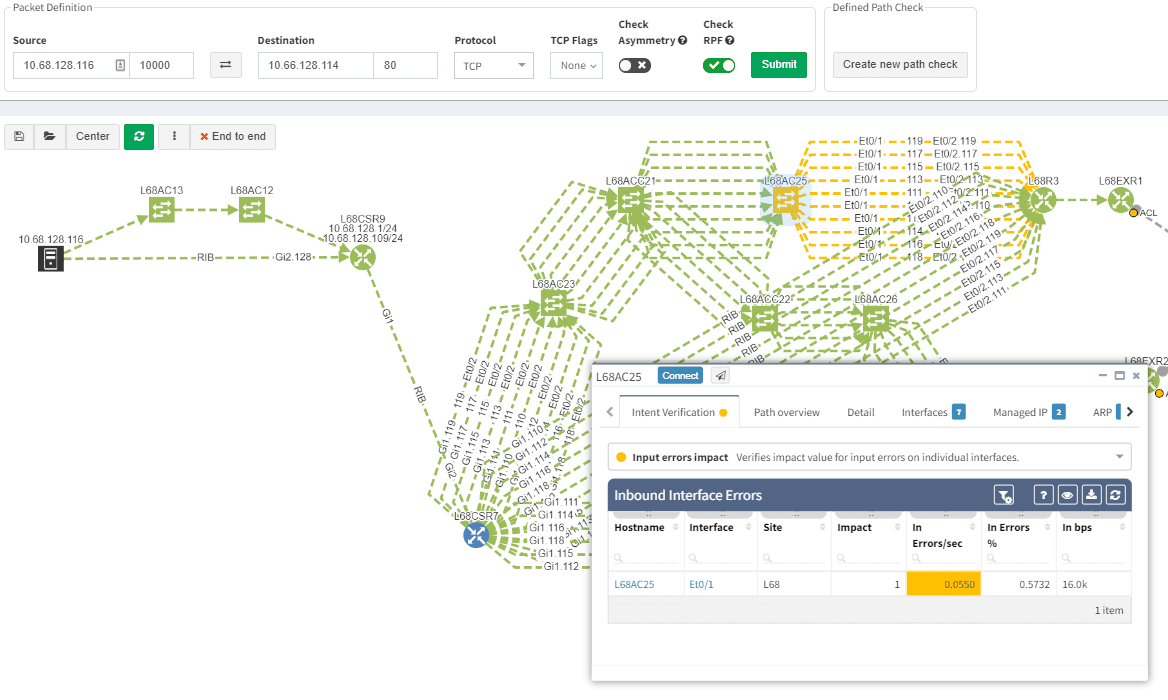
The feature I’ve been waiting for since the beginning of my Network Engineering career is finally here: Dynamic Change Monitoring. It’s finally possible to know the answer to the age-old question “What has changed in the network since yesterday?” and actually get a definitive response instead of the usual “Nothing has changed”. And not just the configuration change management, but I’m happy that we’re the first in the market to offer the overall network state change management — whenever a network path changes, if somebody plugs in a new SFP, if a network port goes up or down, or if IP address is starts being served by a new gateway due to a convergence event, the IP Fabric platform will report the change. It’s great for performing the changes as well because I can now perform a pre-change scan, in-flight scan, and post-change scan, and verify that pre-change and post-change do not differ or that they contain only the desired differences, validating change goal.

Dynamic change monitoring is not the only big improvement in version 2.0. Having had a number of large scale production deployments we’ve had a chance to listen to insightful feedback and significantly improve usability, add highly desired features, all the while simplifying product architecture to be able to deliver features more quickly. So here are some of the highlights from the big 2.0 release:
Now a single action discovers, analyzes, and calculates changes in the network. Based on a schedule or on demand, network insight is as current as you need it to be. The single combined action greatly simplifies usability, as it eliminates guesswork if a new discovery is necessary or not. From experience, we’ve found out that networks are so dynamic, that they need rediscovering every single time the network state is collected.
We strive to support all enterprise network infrastructure managed devices, model years from 1997 or 2017 and made by Cisco or anyone else. For version 2.0 we’ve added a driver system, where each vendor family only has to have a family driver for the IP Fabric platform to be able to talk to the whole family. We’ve also added support for HPE Comware v5 and v7 based switches such as 55xx and 59xx, Riverbed WAN accelerators running RiOS, and Cisco SG300-series SMB switches. Paradoxically, the Cisco SG300 had the most complex driver, because a number of key pieces of information are missing from the basic outputs, and multiple detailed outputs have to be painstakingly combined for a meaningful result.
While we started with Routers and Switches, our ultimate goal is to cover the end-to-end transmission path from the source to destination, which includes additional types of forwarding equipment. Wireless is omnipresent, so we’ve added WLC and AP support, so now wireless users connected to lightweight APs can be traced just as easily as wired users. We’ve also added firewalls and WAN accelerators. And because many users are connected through IP Phones, and IP phones are an important part of network infrastructure, we’ve added those as well.
We strive to support all major Enterprise networking technologies and protocols, and although we have some road ahead of us, we’ve expanded VDC, vPC, and FEX support with StackWise, PoE, and Optical Attenuation, added support for QoS classes and applied service policies, improved ACL workflows, and added many smaller improvements, like support for DMVPN tunnels.
Networks follow graph theory, and graphs are naturally visual, so it is not a surprise that diagramming and visualization capabilities are a big draw, for both the customers and internal teams alike. In version 2.0 we’ve moved from simple diagrams to a fully-fledged diagramming UI, which enables to display protocols or features on demand and show network topology from highest overview to the deepest. One of the great additions is persistent diagram saving feature, which stores the diagram layout even across multiple discoveries runs.
This one is my favorite. Network protocols create topological neighborship to form a forwarding domain and networks paths. Changes in protocol neighborships signify changes in the network topology. Changes in network topology connectivity may inadvertently affect network behavior and can affect a number of users. Tracking connection changes enables to quickly pinpoint non-administrative and administrative changes affecting topology and network paths, user connectivity, and performance, redundancy, resiliency and service availability. Along with configuration management changes, four types of changes are currently tracked: devices, network neighborships (CEF, ARP, RIB, STP, CDP/LLDP), modules and part numbers, and IP addresses. Changes can be displayed for any time interval for which the platform has collected network state information. Changes between last month and last week can be displayed just as easily for last week vs today.
Many other improvements have made it into the big 2.0 release, and although not all are polished, they are functional and can provide value out of the box. User interface now has integrated search, Live Support VPN option, and a status page. Users can now change their password, and we’ve added the enterprise-grade user management system with roles. We’ve added more granularity for CLI interaction, such as a hard limit on a maximum number of parallel sessions. There are also Jumphost, and REST API, and actually much more than can be covered in one post. We’ll be coming back introducing each major feature in more detail, but if you can’t wait, you can always contact us or requests a trial.
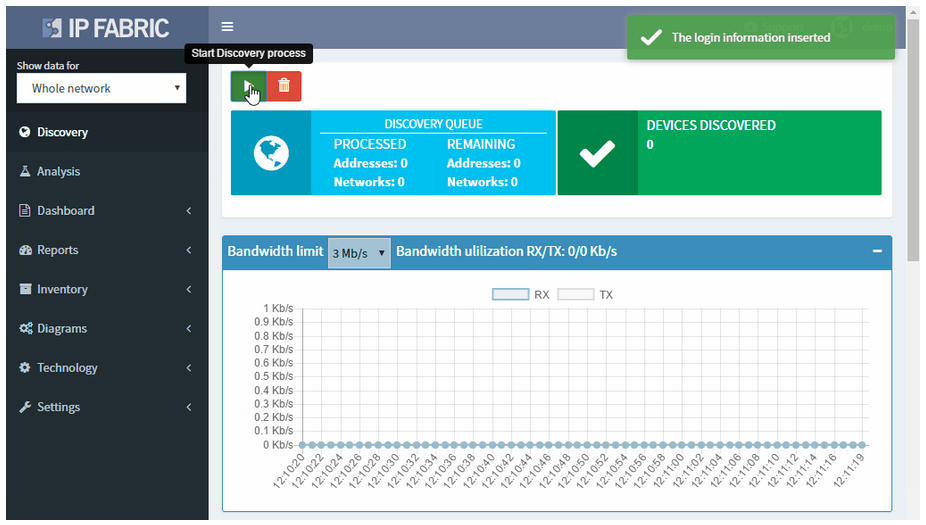
Discovery of existing IP network devices and links is essential to proper network management and control. How can you perform the discovery with the minimal initial information required?
While you are approaching an existing network that you know very little of, you usually spend a lot of time getting as much information as possible before you even look at and touch the network itself. You can study the documentation (if any), get the inventory lists, try to understand the topology and design, downloading configurations, gather IP ranges, ask for administrator privileges, etc. This can be a cumbersome process even if all involved people cooperate. And usually, the responsible people will not be happy about granting full access to the network for the discovery.
You can apply brute force reconnaissance methods as well — such as blindly scanning whole private IP ranges or trying to contact any IP address that goes around in your packet scanner. However, this is not something that you would like to see in a business critical network.
With the IP Fabric platform, you can start the network discovery right away without wasting any time or threatening your network by using a single set of read-only network access credentials only.
You do not need to define any seed devices or scanning ranges in most networks. You do not even need the full privileges as you are gathering operational data for the discovery only.
Discovery algorithms of the IP Fabric platform can use as little of initial information as available and still produce valid and useful results to support the proper network management and control.
If you have found this article resourceful, please follow our company’s LinkedIn or Blog. There will be more content emerging. Furthermore, if you would like to test our platform to observe how it can assist you in more efficiently managing your network, please write us through our web page www.ipfabric.io
UPDATE: We've published an updated post on this topic here: Generate Powerful Business-Level Reports. Please see this post for the most up-to-date information!
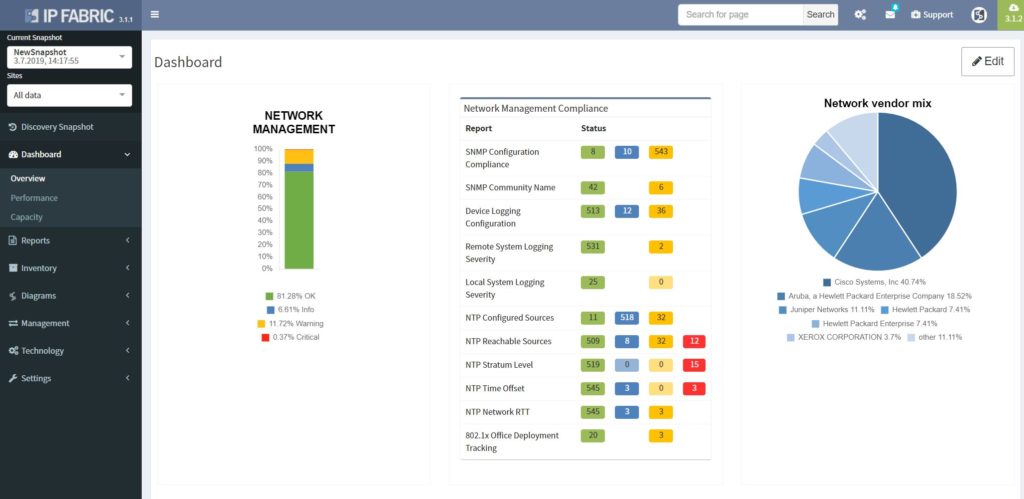
Overall state of the network often must be presented in condensed form to managers and non-it personnel. How can you create the reports focusing mostly on the risk and impact of the network state to users and applications?
The users of the network are interested in slightly different outputs than network engineers. Will I be still able to connect to my online application/data repository even if something breaks? If there is something going on in the network, what impact it has on my job and the work I need to do? Those kinds of reports are not easy to create from the engineering point of view as they require correlation of different inputs from the network, such as the assessment of redundancy, number of the user connections and the possible known risks.
A network-wide analysis report that IP Fabric creates without the need for manual input assists IT management in responding to user questions above and helps in focusing on what network issues must be mitigated first. The summary information and perceived risks are included in the document as well.

When done manually, such documents take weeks to prepare and incur significant costs, prohibiting frequent reanalysis. With IP Fabric, Network Analysis Report document can be generated instantaneously with a single click of a button for the current network state or any previous network snapshots, providing reports at the time they are needed.

If you’re interested in business-level network analysis reports for your network sign up for a trial or an online demo. Also, we’re hiring!
The high available network must stay up even if one of its components fail. Providing standby redundant device can achieve this. How can you verify if all requested redundancy was applied network-wide?
Each network with multiple users should have a redundant gateway implemented as an exit point. For the end users, some form of first-hop redundancy protocol such as VRRP, GLBP or HSRP should be implemented. But it that really true in your network?
Even more, the operational state of this protocol may differ from the desired one — caused either by misconfiguration or by Layer 2 communication issues among the designated gateways. Loss of one of the gateways may cause the network outage for the users in the connected network and thus pose a hidden risk which should be mitigated.
The IP Fabric platform shows the gateway redundancy summary where you can easily sort all managed network by the number of network gateways (exit points from the network). The attention should be put on those networks where only one gateway is a present and a significant number of users is located in this network.
The IP Fabric platform also offers a convenient way to summarize all configured FHRP pairs in the network and analyze them if their operational status is correct (which should be Active-Standby for most cases).
If you have found this article resourceful, please follow our company’s LinkedIn or Blog. There will be more content emerging. Furthermore, if you would like to test our platform to observe how it can assist you in more efficiently managing your network, please write us through our web page www.ipfabric.io
Since the invention of EtherChannels, link aggregation bundles provide a convenient way to increase capacity or reliability of network transport paths. How can you ensure that the traffic is properly balanced among links in a bundle and that individual links in a bundle are operating properly?
As with many things in life, aggregation bundles are a compromise. Combining multiple physical paths allow to increase capacity without forklift upgrades, but a single flow must be pinned to a single link to prevent packet reordering. Multiple links in a bundle increase the reliability of a link, but when a member link enters an erroneous state and stops forwarding traffic, the bundle as a whole remains healthy, hiding operational problems.
To help with the management of link aggregation channels, the IP Fabric platform shows outbound and inbound balancing variance for each bundle in the network and provides state analysis of each member of the link.
Uneven balancing will block the link, despite the fact that some of the links in the bundle are underutilized. Individual flows have different bandwidth, and proper balancing scheme has to be chosen for a specific network scenario. If the link aggregation channel hash algorithm uses input parameters that are shared among many flows, the link utilization in a bundle will be uneven, causing some of the links to become overloaded. Depending on your traffic patterns, as much as possible of the varied fields of the L2, L3, and L4 header values should be used to calculate the hash to provide maximum flow diversity.
Aggregation channels with the highest variance and highest utilization deserve the most attention, and should be addressed with changing of the hashing algorithm, VLAN arrangement, or replacing of aggregation channel with a native link of higher capacity.
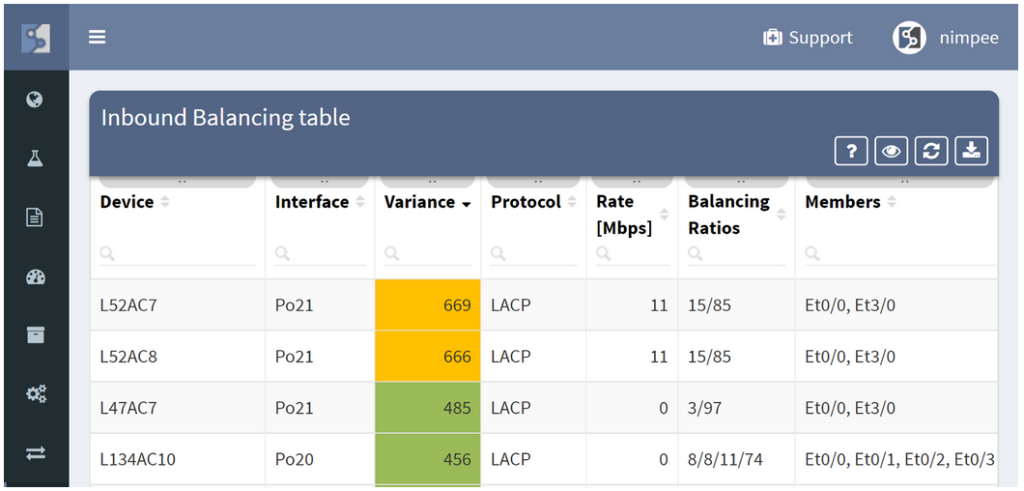
Outbound balancing metrics are of the highest values because that is where the balancing mechanism can be changed. High inbound balancing variance point to the problematic algorithm on the opposing side and help with troubleshooting of channel polarization.
Additionally, member state analysis point to the non-compliant or erroneous state of the individual link members, which helps to prevent aggregation channel outage ahead of time by fixing the underlying issue, and prevent operational problems by pointing to a sub-optimal path.
If you’re interested to see how the IP Fabric platform can help you to manage aggregation channels in your network, contact us for a demo or a trial.


