NetMRI has reached end-of-support and you need a new way to discover and model your enterprise network. Take note - a new way, not a replacement discovery tool that gives you the same fractured view of your network that you've been clinging to as some illusion of network visibility.
While traditional network discovery tooling might have offered insight into specific domains or tech, the complex enterprise network of today demands more. Much more. We propose a vendor-neutral, end-to-end network discovery and modeling approach – automated network assurance - as a new approach to enterprise network management.
It is only with this end-to-end view and network-wide visibility that network teams can enjoy benefits like:
Your modern enterprise network spans on-prem and cloud, is vendor-diverse, and embraces software-defined networking technologies (and if you plan to maintain security, compliance, and connectivity requirements amidst increasing demands, you’ll continue seeking out new tech that helps your network support business growth). Your legacy tech sits beside these new innovations, creating an ever-changing, complex brownfield ecosystem to contend with.
So why are you afraid of losing end-to-end network visibility when you never really had it? Use this opportunity to break free of the devil you know - a fragmented view of disparate parts of your network - and embrace a network-level approach. Has your traditional discovery approach resolved the burning issue of siloed (and inaccurate) documentation? Solved cross-team friction? Given you the means to surface and codify tribal knowledge?
Your problem isn’t vendor-specific. Your problem isn’t domain-specific, or technology-specific, or device-specific. Your problem is a need to understand and validate network behavior, with a network-wide scope. So why would you limit your network discovery with a one-to-one replacement of NetMRI? Device-level solutions may solve an immediate compliance issue or connectivity issue, but they don’t solve a long-term reality issue. The reality is your network teams need more - they need an end-to-end network model to be effective.
They need an end-to-end view of your network that includes inventory, state, configuration, and topology information and allows you to run network-wide intent checks to ensure the whole network is operating as intended. It must be built with your tech ecosystem in mind, and support API calls to access and use this essential network data where needed. It must support your SDN projects and your multi-cloud instances. It must be efficient, scalable, and flexible enough to support and future-proof your network as it evolves.
It’s called an automated network assurance platform. IP Fabric.
With Cisco's recent announcement of End-of-life and End-of-support dates for the Cisco Prime Infrastructure network management tool, users are now faced with the task of finding suitable alternatives to ensure seamless business continuity during the transition away from Prime.
While a shift towards Cisco DNA Center may seem the automatic answer, it's crucial for users to take this opportunity to evaluate what truly aligns with their team's specific requirements. Is DNAC capable of meeting your needs while providing better value? The price tag associated with Cisco DNAC and limitations in scope may cause teams to pause when making the leap. For instance, if you're managing a complex multi-cloud or multi-vendor network, DNAC won’t address all your requirements effectively.
There’s also something to consider in a completely new approach to how you manage and operate your network. Traditional tooling views validation of your network as a device-level challenge. While it is certainly useful and necessary to validate the state of each network device, having the big picture – an end-to-end, complete network model – is where traditional tools fall short. Automated network assurance platforms like IP Fabric bring insight to the network as a whole and validate network health rather than just device state. The vast and complex nature of modern IT networks makes this big-picture view all the more necessary; you need to know the outcome of change across your entire network, not just per-device.
So, depending on how you use Prime, there could be other avenues to explore. Automated network assurance, for example, while not pushing config to devices, provides much of the necessary end-to-end network insight that teams rely on Prime for. In fact, a vendor-neutral, cloud-inclusive platform will prove a welcome one-stop shop for business-critical data collection and validation tasks.
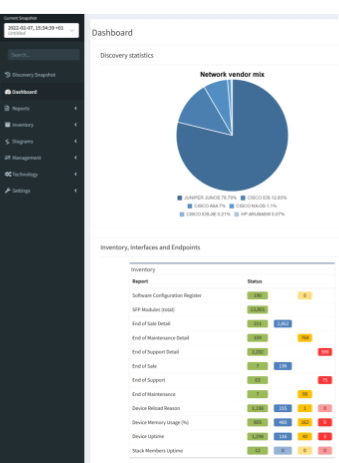
Cisco Prime Infrastructure allows users to define custom compliance policies, such as those needed to maintain ISO 27001 compliance and perform audits, evaluate the results, and run a fix job if necessary. Even if this is only done a few times a year, having a method to surface this information automatically avoids a time-intensive process of manually collecting configuration information from individual devices. Simply not a feasible way to work with a large network!
During the network discovery process, IP Fabric uses SSH to collect configuration and state data from supported network devices (there are hundreds of supported models across an always-expanding list of vendors). This is interpreted, normalized, and visualized in flexible snapshots of your network that provide both a holistic overview and allow users to dig into granular detail where needed.
Additionally, for this use case in particular, you can make use of 150+ built-in or custom intent checks (in this case, compliance checks) to highlight drift from network intent, which is informed by your compliance rules. Every time you take a network snapshot, you can easily see misconfigurations that violate your own organizational standards or that of specific industry regulations like PCI or ISO 27001.
Once the correct config has been pushed, IP Fabric can take another snapshot to validate that the whole network, regardless of vendor or domain, is operating as intended. IP Fabric runs end-to-end path simulations and can validate that your security policies are being applied as you intend.
This means fast, accurate, and continuous compliance, giving you confidence when those security or regulatory compliance audits come around year after year.
Regularly scheduled backups of your switch, router, and firewall configurations are standard best practice to ensure easy rollbacks after that “oh no” moment when a change has unexpected consequences, for routine device upgrades, for disaster recovery, and of course, to ensure compliance. Cisco Prime Infrastructure allows users to backup and restore switch, router, and firewall configurations on a customizable schedule, and seamlessly migrating this process over to a new platform is essential.
Since all the network state and configuration info is collected in an IP Fabric network snapshot, and these snapshots can be scheduled as often as your team prefers (or be made on-demand), you’ll have access to a historical database of your switch and router backups at different times whenever you need them.
Note that this is for your whole network, end-to-end, all vendors, and through to the Cloud. Additionally, unlike platforms that offer similar functionality, IP Fabric has the benefit of keeping all these snapshots available on the platform for you to query at any time, making it a perfect resource for historical troubleshooting.
You can’t escape that your enterprise network is subject to change, and as daily demands ebb and flow, you need to have a pulse on system health and performance. Cisco Prime Infrastructure collects real-time and historical data from network devices. It then presents key device health indicators like CPU and memory use in dashboards. Users can set thresholds for alerts and quickly identify potential issues.
Network engineers can leverage IP Fabric in a similar way to ensure their network infrastructure is performing optimally and swiftly address any anomalies that might affect performance or uptime. The in-depth, normalized data that IP Fabric collects via snapshots can be integrated via open API with real-time monitoring tools to contextualize and prioritize incoming alerts, ensure that you’re monitoring everything in your network, and give engineers what they need to proactively solve high-priority incidents. And, of course, this utility extends beyond just Cisco devices.
As Cisco sunsets an essential resource for key network data and operations, there’s no need to feel backed into a corner and buy an expensive, vendor-restrictive solution to cover these gaps. Automated network assurance gives you a normalized and consumable bank of network intelligence that allows you to cover many Cisco Prime Infrastructure use cases more comprehensively at a fraction of the cost. In addition, A move toward a network model-based approach can also open new doors to innovation that previously, traditional tooling focused on device-level validation simply didn’t consider.
Consider this moment – which could be a frustrating headache - an opportunity to optimize your network tolling ecosystem with a solution that grows in value over time with straightforward, per-device licensing and an open API.
Observability - the ability to measure the internal state of a system using its outputs - has long been a goal for application and DevOps teams. It's a necessary pursuit to control any complex system. You can't truly know what you can't observe.
At present, this concern is rapidly spreading to enterprise network teams. There's an uptick in interest in network observability more specifically, which involves a lot more than the logs, metrics, and traces generally considered the pillars of observability.
This seems a natural trajectory for modern enterprises in 2023, whose networks are sprawling ecosystems. These networks of networks, seemingly with a life of their own as they dynamically change, make knowing your network from one day to the next all the more difficult.
The more complex your network, the more critical that you have tools and practices in place to understand its behavior. Without this, unknown misconfigurations, or unintended consequences post-change may have a disastrous impact on the network. With the benefits ranging from improved network security to lowering MTTR and adding proactivity to troubleshooting, it's clear that an effective network observability practice will become imperative for enterprises.
An observability practice ensures that network operators have clear insight into network health and behavior, and understand how the current, actual state of the network will affect the end user. This understanding of network behavior means that teams can take active measures against unwanted effects of change in the network. This must span all environments and vendors, and bring together information from a multi-domain network together into a consumable manner.
To achieve this, network data delivered via an observability practice must be 1) contextualized, 2) consumable, and 3) centralized.

The first instinct one may have when considering how to attain network observability is to rely on traditional monitoring tools available on the market - they're designed to tell you exactly what's happening in your network, right? Well, while these are surely vital for real-time alerting of issues on the network, it's becoming obvious that typical network monitoring is insufficient for true, holistic network observability, and may actually hinder network operations in some regard. What's holding monitoring tools back from servicing enterprise observability needs?
According to an Enterprise Management Associates survey of over 400 enterprise stakeholders, only 47% of alerts from monitoring tools are actionable, or represent an actual problem in the network. However, network teams still have to take the time to investigate the other 53% - a massive waste of resources and contributor to alert fatigue. Customizing monitoring tools to avoid this noise requires an investment of time - more overhead.
It's quite usual for modern enterprise networks to be multi-domain and multi-vendor, and this is only becoming more of the norm. If this complexity prevents a monitoring tool from monitoring parts of your network (e.g. cloud instances) then you're in the dark about vital parts of your network that could have an effect on the network as a whole. Complexity should not mean sacrificing visibility.

Once again, the overhead necessary to sift through, interpret, and analyze network data produced by traditional monitoring platforms may prove more of a burden than an asset to network teams looking to strengthen their observability practice. If the data produced is normalized, and visualized in a manner that complements the goals of network engineers, the value immediately skyrockets.
Monitoring tools are generally designed to flag that something is wrong, but rarely give the context of the issue upfront, i.e. How is this problem affecting the rest of your network as a whole? Where can I start looking for the source of this issue? This means more time spent on every alert investigated.
This might be the way it's always been, but we know that better is possible. More than possible, better is necessary for enterprise network teams to be effective. Whether it be an evolution of monitoring tools or a combination of tooling that achieves full-stack observability, the point is that network operators need solutions that eliminate these inefficiencies and blind spots to properly manage dynamic networks.
Stay tuned for our next exploration of network observability here on the IP Fabric blog, where we'll look at different options of actual tools that will help set up enterprises for observability success.
Follow us on LinkedIn, and on our blog, where we regularly publish new content, such as our recent Community Fabric podcast on understanding the buzz around network observability:
In Part 3, we discussed using the python-ipfabric SDK to interact with IP Fabric's API - did you know that you can also use it to create diagrams using the API?
Find a coding example on GitLab at 2022-05-20-api-programmability-part-4-diagramming.
Blog post updated 2023-11-15 for ipfabric SDK version 6.5.0.
There are four options for returning data in the Diagram class.
IPFClient().diagram.png(): Returns PNG image as a bytes string.IPFClient().diagram.svg(): Returns SVG image as a bytes string.IPFClient().diagram.json(): Returns the raw JSON from IP Fabric.IPFClient().diagram.model(): Takes the raw JSON and converts it into a python object with type hints.Each of these methods has five input parameters, and only the first one is required:
This is the most basic diagram as it takes a single IP address. The imports will differ depending on the type of graph.
# 1_host2gateway.py
from os import path

from ipfabric import IPFClient
from ipfabric.diagrams import Host2GW

if __name__ == '__main__':
    ipf = IPFClient()  # IPFClient(base_url='https://demo3.ipfabric.io/', auth='token', verify=False, timeout=15)

    # Get Random Host
    host = ipf.inventory.hosts.all(filters={"ip": ["cidr", "10.35.0.0/16"]})[3]['ip']

    with open(path.join('path_lookup', '1_host2gateway.png'), 'wb') as f:
        f.write(ipf.diagram.png(Host2GW(startingPoint=host)))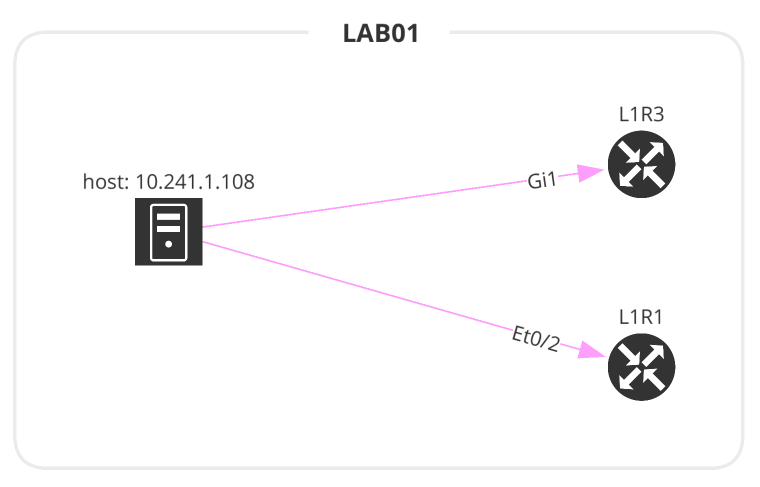
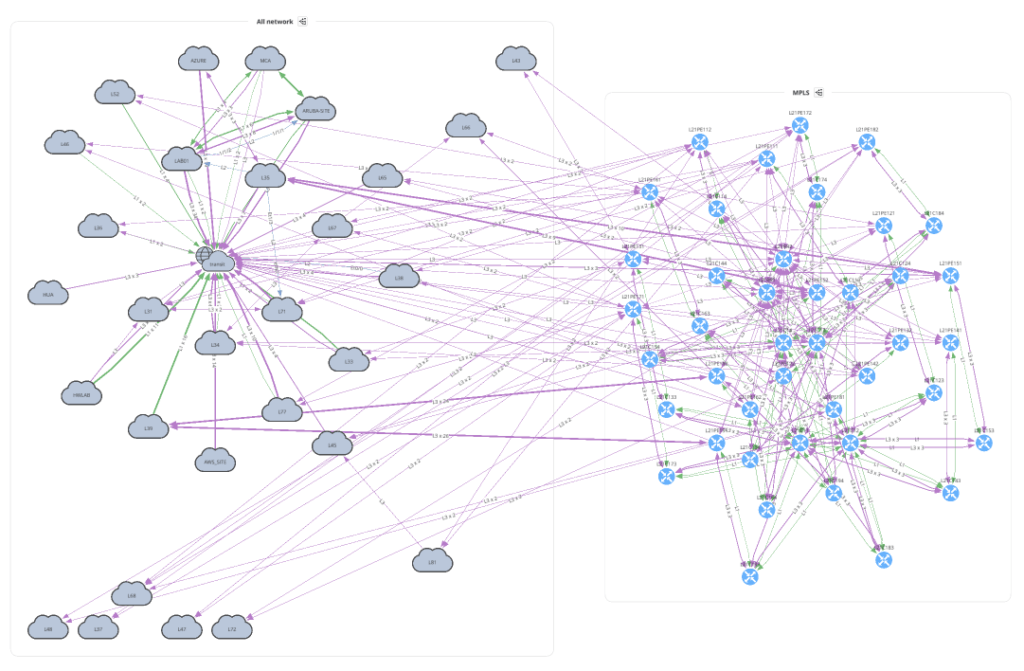
The Network class accepts 3 input parameters. If no parameters are defined, this will create a graph similar to going to the UI and Diagrams > Network.
site name or a List of site names.# 2_network.py
from os import path
from ipfabric import IPFClient
from ipfabric.diagrams import Network, Layout
if __name__ == '__main__':
ipf = IPFClient() # IPFClient(base_url='https://demo3.ipfabric.io/', auth='token', verify=False, timeout=15)
with open(path.join('network', '2_1_network.png'), 'wb') as f:
f.write(ipf.diagram.png(Network(sites='MPLS', all_network=True)))
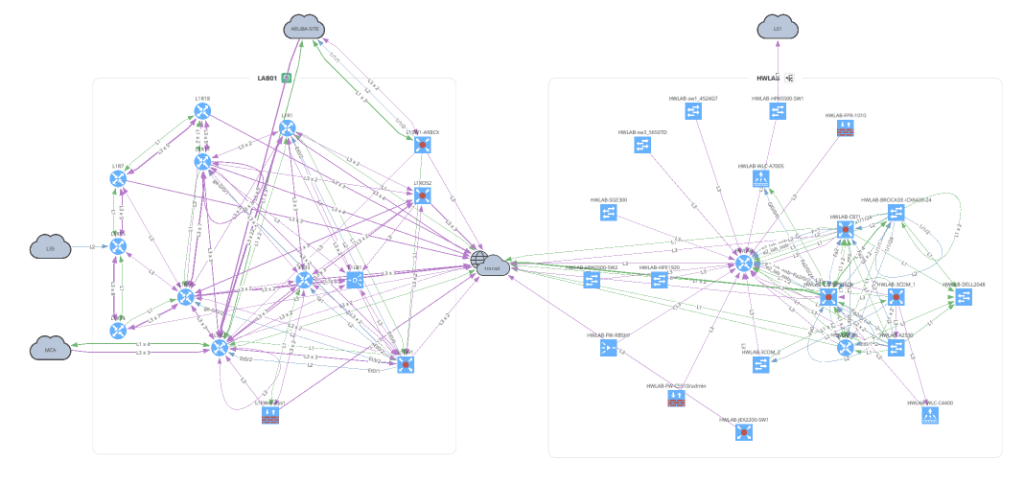
with open(path.join('network', '2_2_network.png'), 'wb') as f:
f.write(ipf.diagram.png(Network(sites=['LAB01', 'HWLAB'], all_network=False)))
with open(path.join('network', '2_3_network.png'), 'wb') as f:
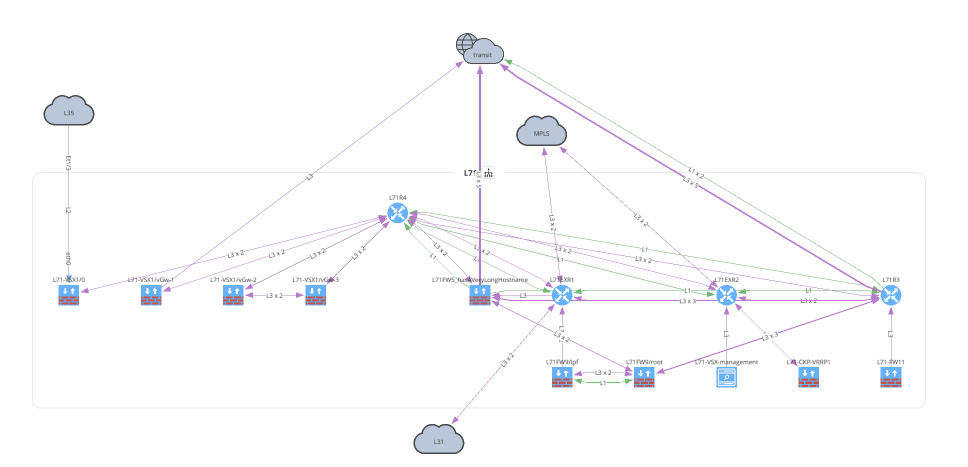
f.write(ipf.diagram.png(
Network(sites='L71', all_network=False, layouts=[Layout(path='L71', layout='upwardTree')])
))
Before moving on to Unicast and Multicast let's take a look at how to overlay a snapshot comparison or specific intent rule onto your graph. You can apply this to any type of graph.
# 3_network_overlay.py
from os import path

from ipfabric import IPFClient
from ipfabric.diagrams import Network, Overlay

if __name__ == '__main__':
    ipf = IPFClient()  # IPFClient(base_url='https://demo3.ipfabric.io/', auth='token', verify=False, timeout=15)

    with open(path.join('network', '3_1_network_snap_overlay.png'), 'wb') as f:
        f.write(ipf.diagram.png(Network(sites='MPLS', all_network=False),
                                    overlay=Overlay(snapshotToCompare='$prev')))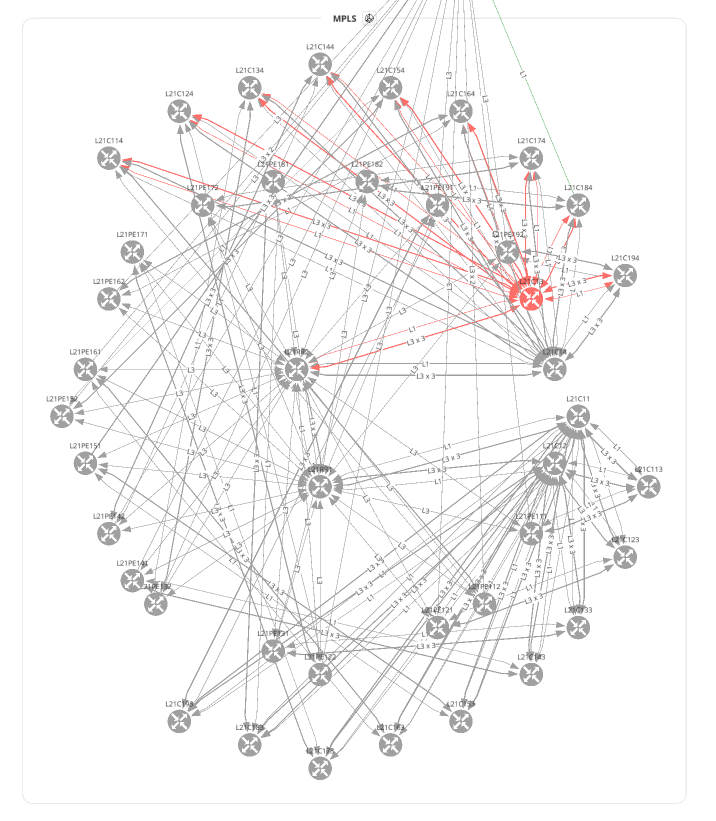
To overlay an Intent Rule you must first get the ID of the rule to submit. In this example, we are using the ipfabric package to load the intents and get a rule by name. Find more examples of extracting intent rule IDs here.
# 3_network_overlay.py
from os import path

from ipfabric import IPFClient
from ipfabric.diagrams import Network, Overlay

if __name__ == '__main__':
    ipf = IPFClient()  # IPFClient(base_url='https://demo3.ipfabric.io/', auth='token', verify=False, timeout=15)

    # Get intent rule ID
    ipf.intent.load_intent()
    intent_rule_id = ipf.intent.intent_by_name['NTP Reachable Sources'].intent_id

    with open(path.join('network', '3_2_network_intent_overlay.png'), 'wb') as f:
        f.write(ipf.diagram.png(Network(sites=['L71'], all_network=False),
                                overlay=Overlay(intentRuleId=intent_rule_id)))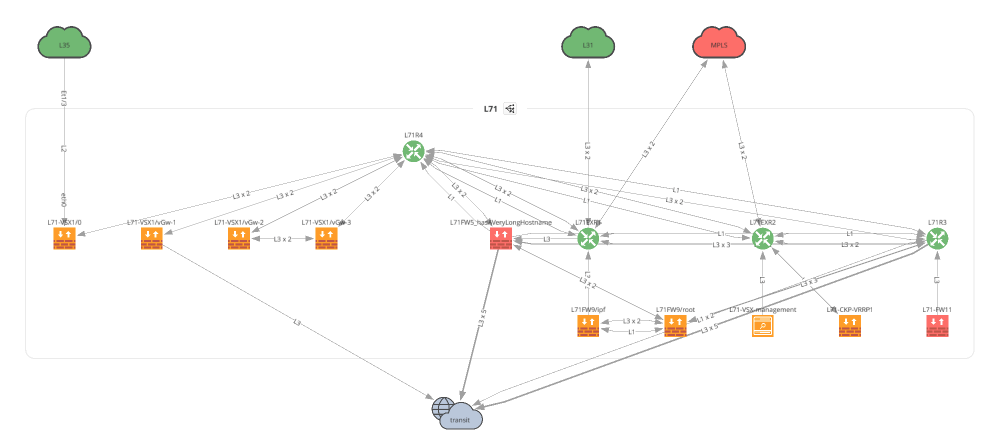
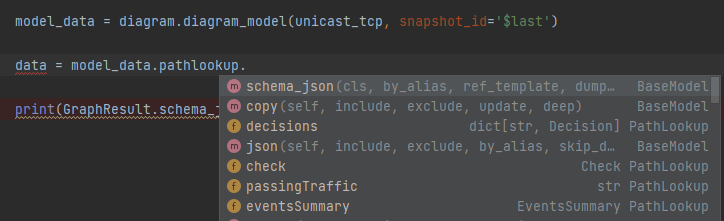
The next two examples make it a bit clearer why we first create a python object and then pass it into the diagramming functions. The amount of options required are quite lengthy, and this keeps your code cleaner and provides great type hints (see below). Additionally, it has many built-in checks to ensure you provide the correct data before submitting the payload to IP Fabric and returning an error.
For all valid ICMP types please refer to icmp.py.
# 5_unicast_path_lookup.py
from os import path

from ipfabric import IPFClient
from ipfabric.diagrams import icmp, Unicast

if __name__ == '__main__':
    ipf = IPFClient()  # IPFClient(base_url='https://demo3.ipfabric.io/', auth='token', verify=False, timeout=15)

    unicast_icmp = Unicast(
        startingPoint='10.47.117.112',
        destinationPoint='10.66.123.117',
        protocol='icmp',
        icmp=icmp.ECHO_REQUEST,  # Dict is also valid: {'type': 0, 'code': 0}
        ttl=64,
        securedPath=False  # UI Option 'Security Rules'; True == 'Drop'; False == 'Continue'
    )

    with open(path.join('path_lookup', '5_1_unicast_icmp.png'), 'wb') as f:
        f.write(ipf.diagram.png(unicast_icmp))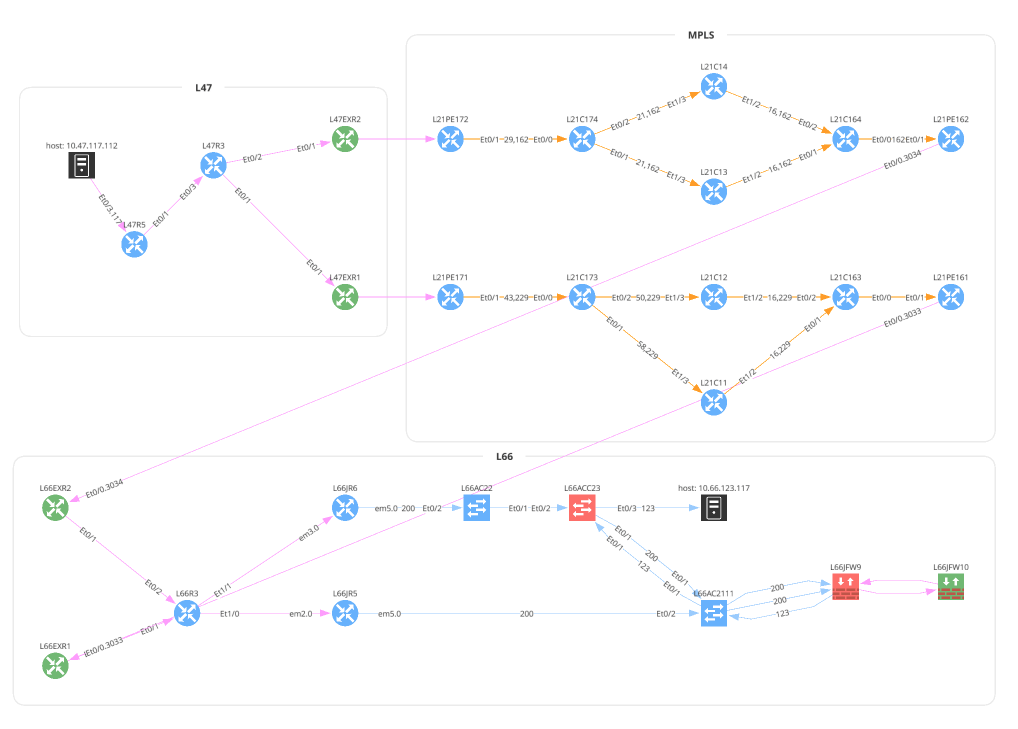
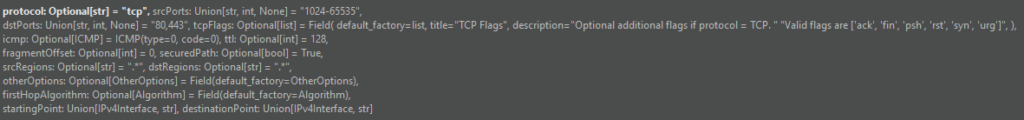
TCP and UDP accept srcPorts and dstPorts which can be a single port number, a comma-separated list, a range of ports separated by a -, or any combination of them. The applications, srcRegions, and dstRegions arguments are used for Zone Firewall rule checks and these default to any (.*).
# 5_unicast_path_lookup.py
from os import path

from ipfabric import IPFClient
from ipfabric.diagrams import Unicast, OtherOptions

if __name__ == '__main__':
    ipf = IPFClient()  # IPFClient(base_url='https://demo3.ipfabric.io/', auth='token', verify=False, timeout=15)

    unicast_tcp = Unicast(
        startingPoint='10.47.117.112',
        destinationPoint='10.66.123.117',
        protocol='tcp',
        srcPorts='1024,2048-4096',
        dstPorts='80,443',
        otherOptions=OtherOptions(applications='(web|http|https)', tracked=False),
        srcRegions='US',
        dstRegions='CZ',
        ttl=64,
        securedPath=False
    )

    with open(path.join('path_lookup', '5_2_unicast_tcp.png'), 'wb') as f:
        f.write(ipf.diagram.png(unicast_tcp))

    with open(path.join('path_lookup', '5_3_unicast_tcp_swap_src_dst.png'), 'wb') as f:
        f.write(ipf.diagram.png(unicast_tcp, unicast_swap_src_dst=True))

    # Subnet Example
    unicast_subnet = Unicast(
        startingPoint='10.38.115.0/24',
        destinationPoint='10.66.126.0/24',
        protocol='tcp',
        srcPorts='1025',
        dstPorts='22',
        securedPath=False
    )

    with open(path.join('path_lookup', '5_4_unicast_subnet.png'), 'wb') as f:
        f.write(ipf.diagram.png(unicast_subnet))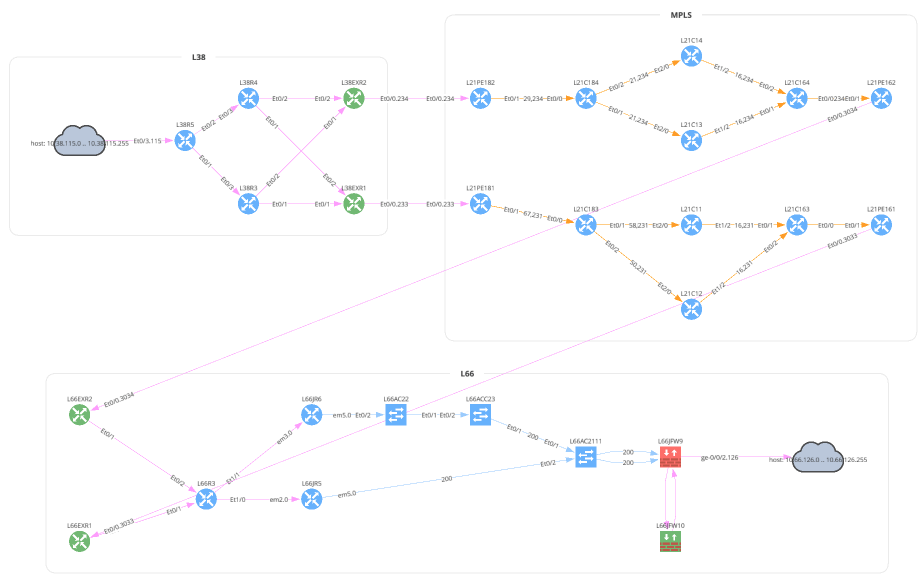
This is a new graphing feature in version 4.3 and above that allows you to specify a device and interface a packet enters your network. Perhaps you have a firewall rule to allow a certain IP address or subnet and want to verify that this is functioning correctly. The sn value is the IP Fabric unique serial number, iface is the intName or Interface column (not to be confused with Original Name), and the hostname is also required. The easiest way to collect this information is from the Inventory > Interfaces table. The sn is not a visible column in the UI, but is available from the API.
# Example pulling Interface Inventory table
from ipfabric import IPFClient
ipf = IPFClient(base_url='https://demo3.ipfabric.io/', token='token', verify=False)
interfaces = ipf.inventory.interfaces.all(columns=['sn', 'hostname', 'intName'])
# 5_unicast_path_lookup.py
from os import path
from ipfabric import IPFClient
from ipfabric.diagrams import Unicast, Algorithm, EntryPoint
if __name__ == '__main__':
ipf = IPFClient() # IPFClient(base_url='https://demo3.ipfabric.io/', auth='token', verify=False, timeout=15)
# User Defined Entry Point Example
unicast_entry_point = Unicast(
startingPoint='1.0.0.1',
destinationPoint='10.66.126.0/24',
protocol='tcp',
srcPorts='1025',
dstPorts='22',
securedPath=True,
firstHopAlgorithm=Algorithm(entryPoints=[
EntryPoint(sn='test', iface='eth0', hostname='test'),
dict(sn='test', iface='eth0', hostname='test') # You can also use a dictionary
])
)Multicast is very similar to Unicast except some of the parameter names have changed. You can also specify a receiver IP address but this is optional.
# 7_multicast.py
from os import path

from ipfabric import IPFClient
from ipfabric.diagrams import Multicast

if __name__ == '__main__':
    ipf = IPFClient()  # IPFClient(base_url='https://demo3.ipfabric.io/', auth='token', verify=False, timeout=15)

    multicast = Multicast(
        source='10.33.230.2',
        group='233.1.1.1',
        receiver='10.33.244.200',
        protocol='tcp',
        srcPorts='1024,2048-4096',
        dstPorts='80,443',
    )

    with open(path.join('path_lookup', '7_multicast.png'), 'wb') as f:
        f.write(ipf.diagram.png(multicast))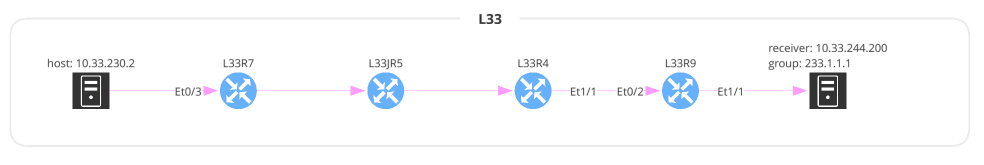
One of the great advantages of using this package is returning a Python object instead of returning the raw JSON. This allows a user to more easily understand the complex textual data returned by IP Fabric that represents how the edges (links) connect to the nodes (devices, clouds, etc.) and the decisions a packet may take. You can accomplish this via the JSON output but returning an object provides type hints along with the ability to export the model as a JSON schema. Please note that the model is not the exact same as the JSON output and some structure has been changed for ease of use. It also dynamically links some internal objects to eliminate the need to do extra lookups and references.
# 6_json_vs_model.py
from ipfabric.diagrams.output_models.graph_result import GraphResult

if __name__ == '__main__':
    print(GraphResult.model_json_schema())
"""
{
  "title": "GraphResult",
  "type": "object",
  "properties": {
    "nodes": {
      "title": "Nodes",
      "type": "object",
      "additionalProperties": {
        "$ref": "#/definitions/Node"
      }
    },
    "edges": {
      "title": "Edges",
      "type": "object",
      "additionalProperties": {
        "anyOf": [
          {
            "$ref": "#/definitions/NetworkEdge"
          },
          {
            "$ref": "#/definitions/PathLookupEdge"
          }
        ]
      }
    },
...
"""The ability to create diagrams using the API allows for greater automation and integration into other applications. Many of our customers use this feature to create chatbots to speed up troubleshooting, as shown below. This example is from the Network to Code nautobot-plugin-chatops[ipfabric] plugin.
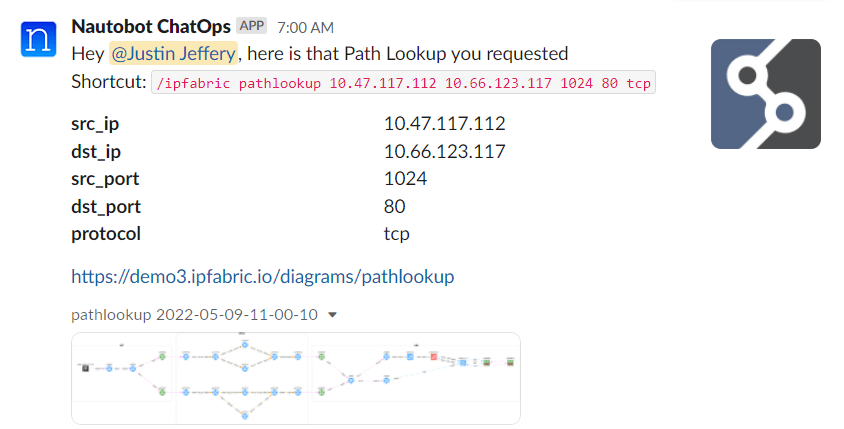
Another useful feature is performing a Path Lookup and parsing the JSON output to ensure traffic is flowing apart of a review process. We have partnered with Itential to demonstrate how using their low-code automation platform can automate ServiceNow requests and ensure that a newly deployed IP has access to correct network services during a Change Control review. Keep an eye out for a video of this exciting demonstration!
If you have any questions, comments, or bug requests please send an email to [email protected] or open an issue request on the GitLab repository.
The fundamental purpose of a data network is to connect users with applications, data producers and consumers with storage. The most desirable feature of a network is to maximise availability of those services to the endpoints that consume them. In order to achieve that, we need to consider (amongst other things):
To be sure we can deliver availability then, we should design our networks with these tenets in mind.
Sometimes though, organic growth in your IT environment means that the original design principles can't be upheld. You need to change your network to fulfil a new requirement and fast! And so you build a change to your network that compromises the original design principles but provides a solution.
Often, this means connecting a new link to a new device which is not big enough, fast enough or resilient. Or some unseen configuration issue prevents redundant links from being available for use. Then, when an issue occurs later, you and your users suffer because the principles you laid out for maximising availability haven't been upheld and systems fall over. You are then left trying to trace the reason why things have failed.
Where do you start? Your diagrams and design documents were great when you built your network, but no one has kept them updated. And so, you have to start where they end, and:
then you sit down with your network team to analyse where your single points of failure are and what you can do about them. Don't forget that they might not be immediately obvious in the physical topology, but in the logical configuration!
Alternatively you could give the job to IP Fabric.
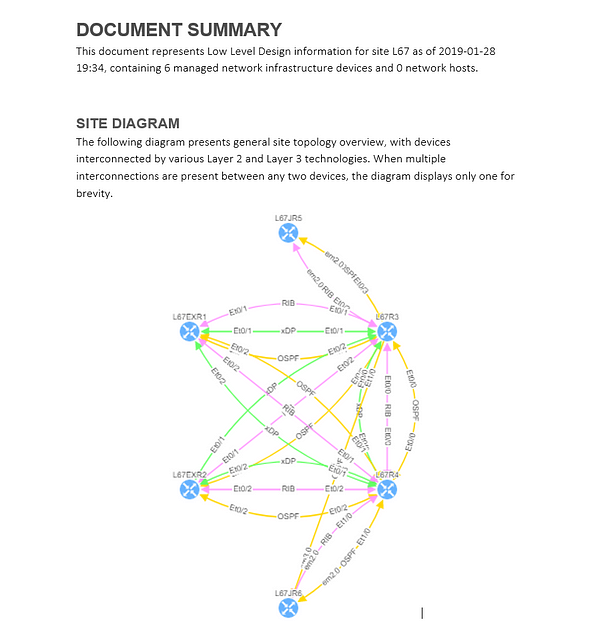
Each time IP Fabric runs a snapshot, it rediscovers the network topology from the physical layer upwards. Clicking through the Diagram | Site Diagrams menu shows a visualisation of the topology:
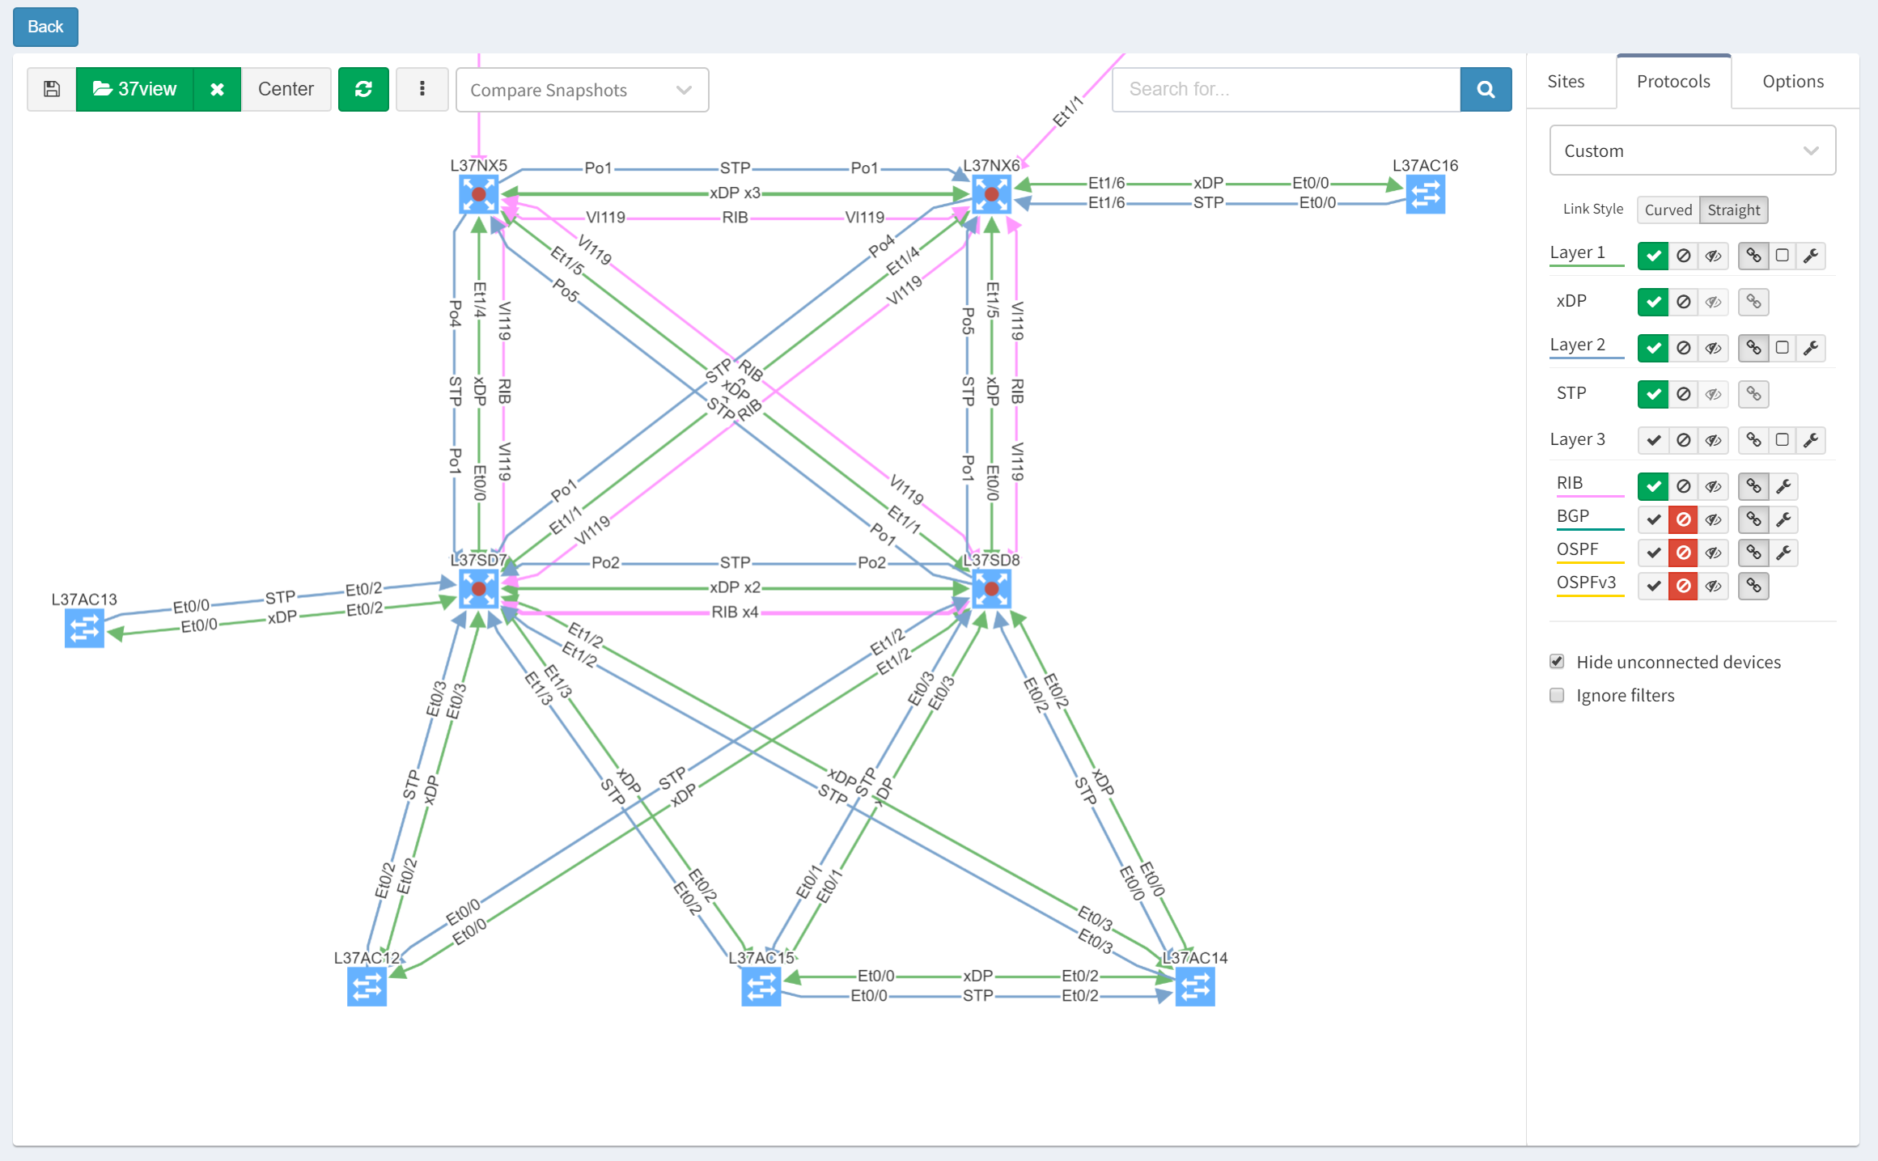
After turning off Layers 1 and 3 for clarity, then selecting the Options tab and clicking "Single Points of Failure", IP Fabric highlights them with red outlines:
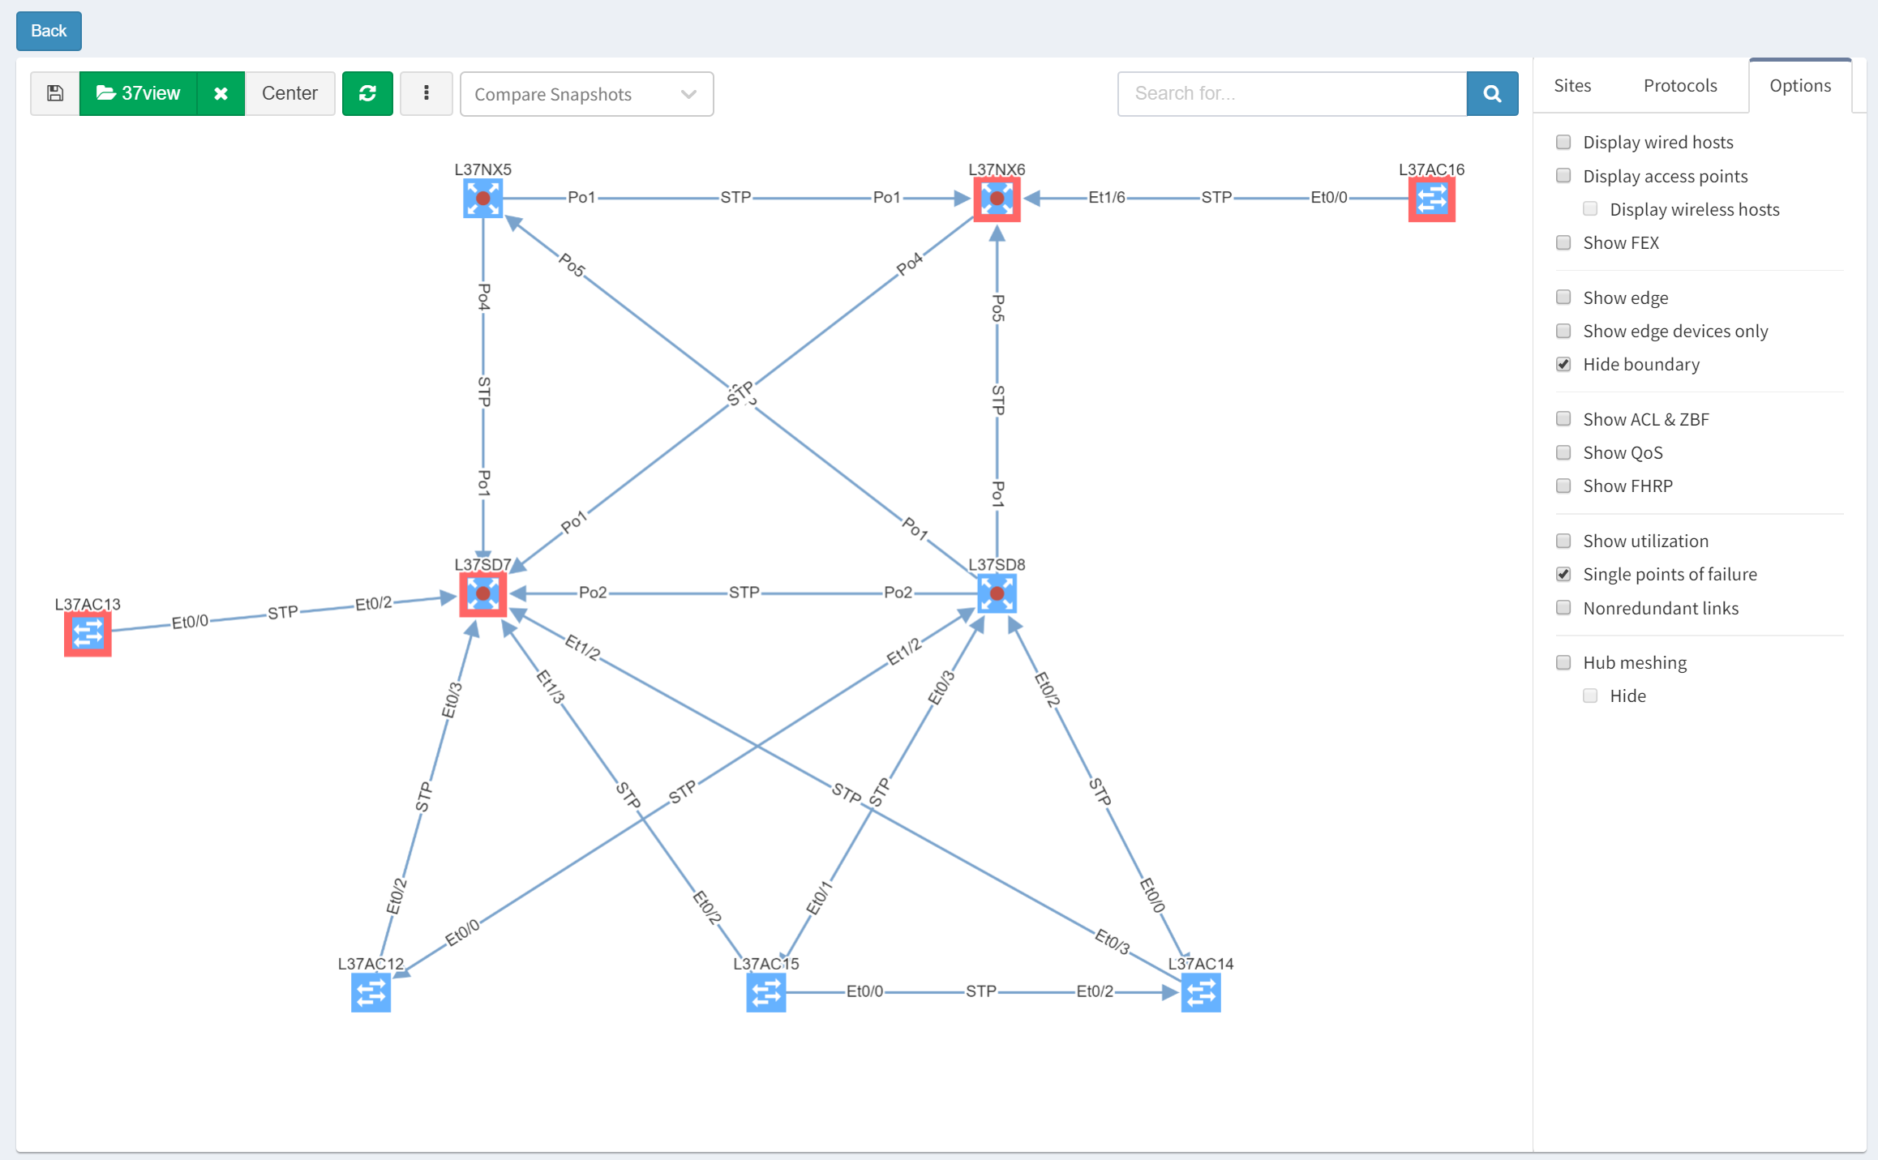
IP Fabric is able to analyse and interpret relationships between devices both upstream and downstream. In this case, switches are shown as SPOFs because they are the sole upstream devices for some access switches.
As we've seen, IP Fabric's powerful visualisation helps us appreciate problems in topologies, but there are alternative and equally powerful views of the network. For example, you can check a simulated path between hosts for single points of failure. Select Diagrams | End-to-end path. After submitting source and destination IPs, non-redundant devices can be highlighted along the path.
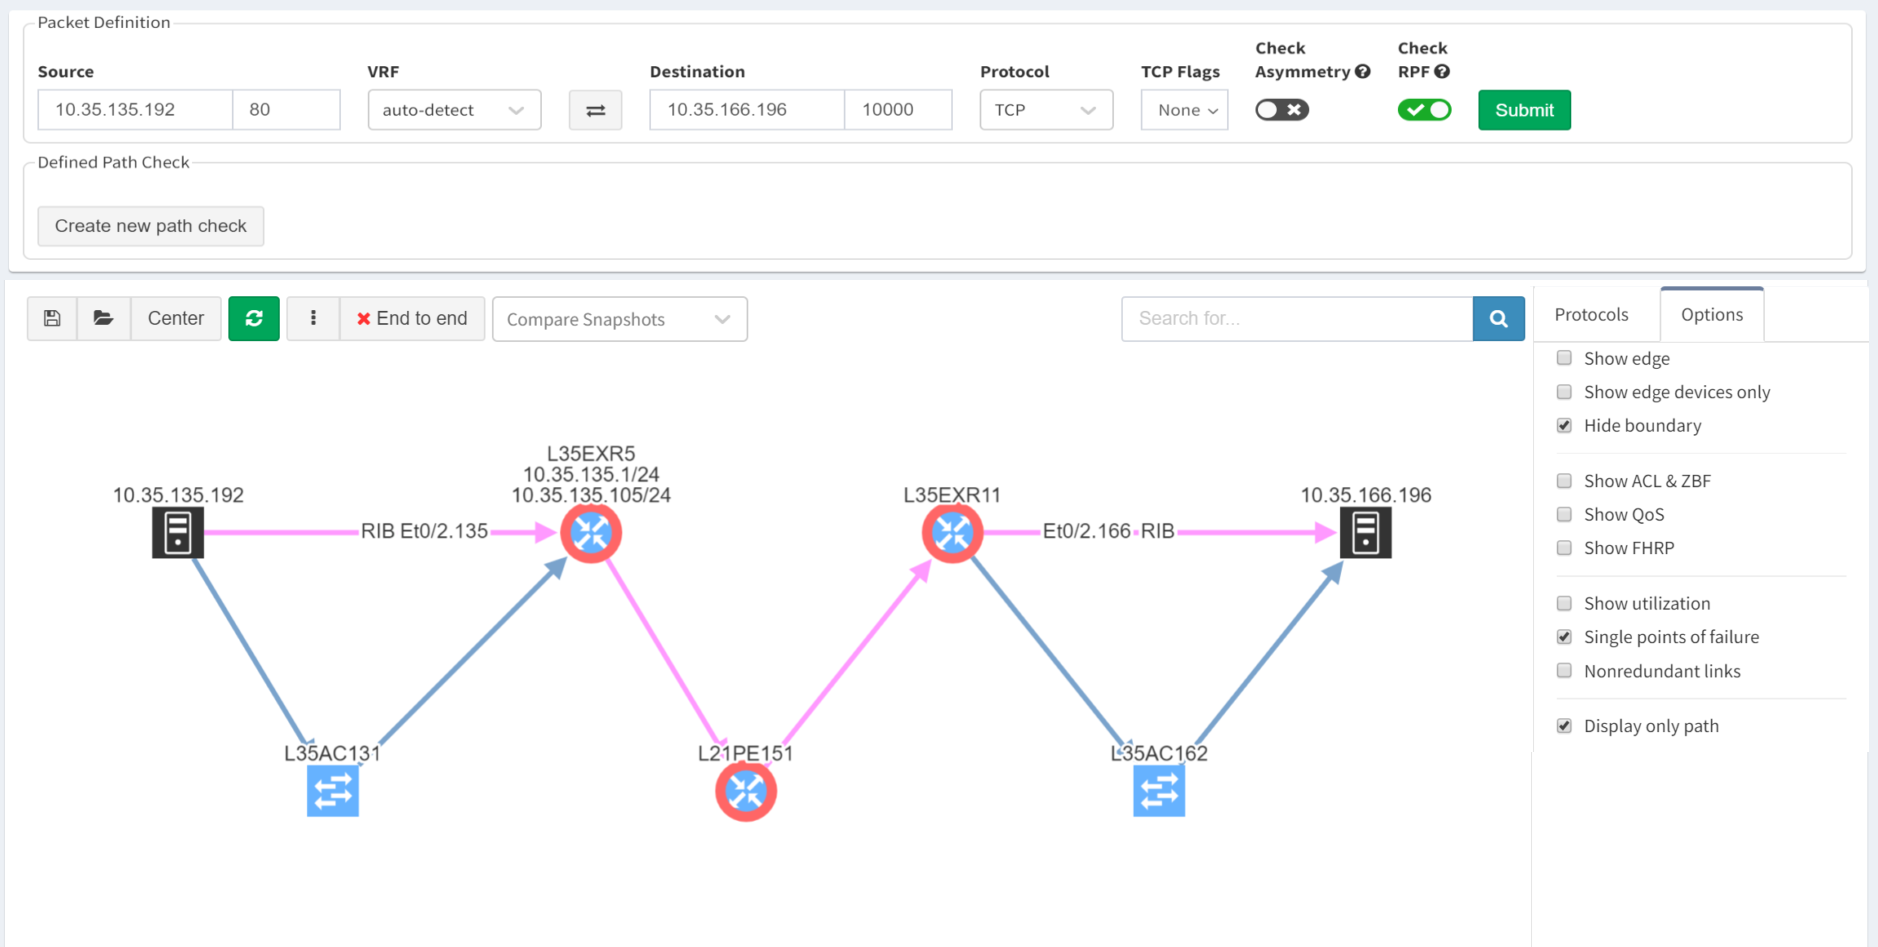
Subtly different, you are also able to highlight non-redundant links, showing where there is a strict dependency on the link to ensure an end-to-end path between the hosts.
So you can see how IP Fabric has saved you huge amounts of time and effort spotting single points of failure in your network topology. And now you are in a position to proactively remediate before this becomes a problem!
If you have found this article helpful, please follow our company’s LinkedIn or Blog, where more content will be emerging. If you would like to test our solution to see for yourself how IP Fabric can help you manage your network more effectively, please contact us through www.ipfabric.io.
Good news everyone, another version of the IP Fabric platform is officially out. We have added more freedom to users in terms of platform configuration and above all, the intent-based network verifications can now be visually represented directly in the diagrams.
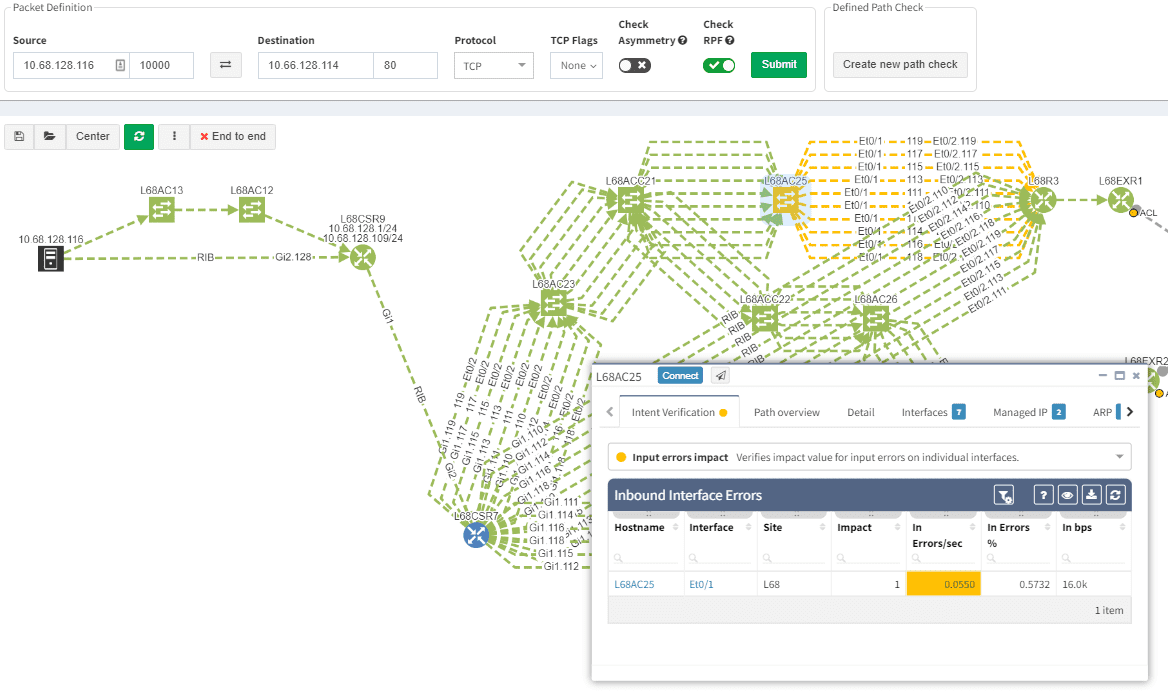
This greatly helps in many scenarios when specific part of the network is of interest. For example, one of the frequent scenarios in troubleshooting is finding an issue on the path. Now all paths between any two endpoints can be visually verified for a presence of an issue in an instant.
This includes paths with significant complexity, such as paths including Stack, FEX, vPCs, VXLANs, WAN accelerators, Lightweight Wireless and others.
Imagine troubleshooting a path for a performance issue, and trying to narrow down a problem, because it’s not feasible to check everything at once. Techniques such as resolving a balancing hash for a particular flow were utilized to know which link to focus troubleshooting on. These techniques were necessary to narrow down the issue, but not in finding the underlying cause. Well, now it is feasible to check all path elements at once, and see all affecting issues.
Now it’s even possible to “Check everything at once”. Not surprisingly there will be a lot of red.
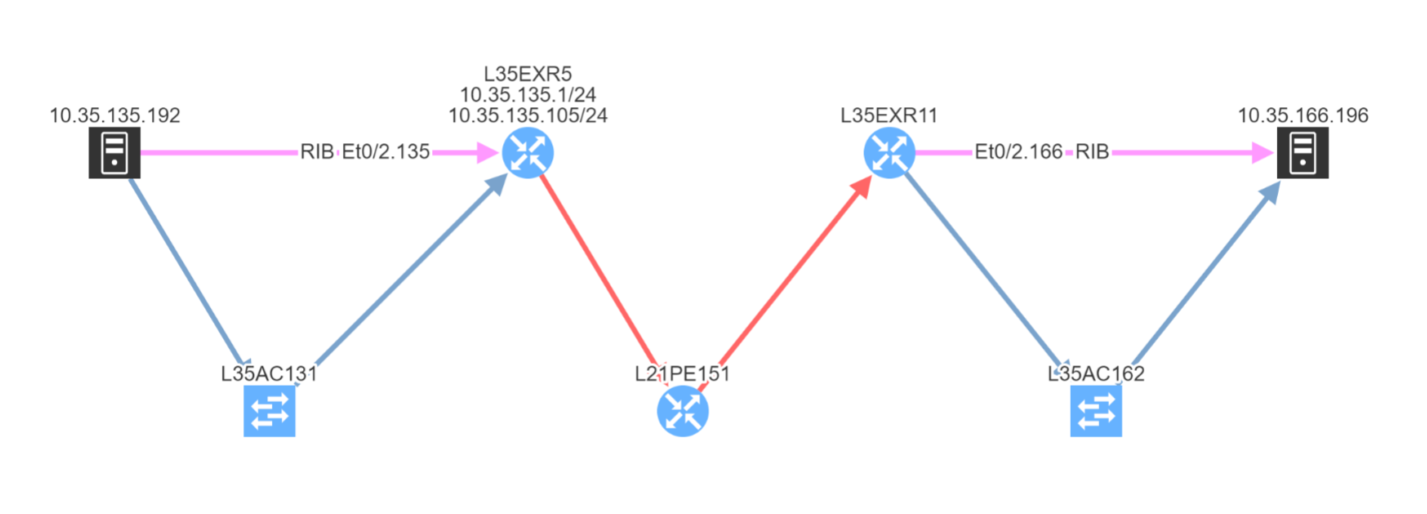
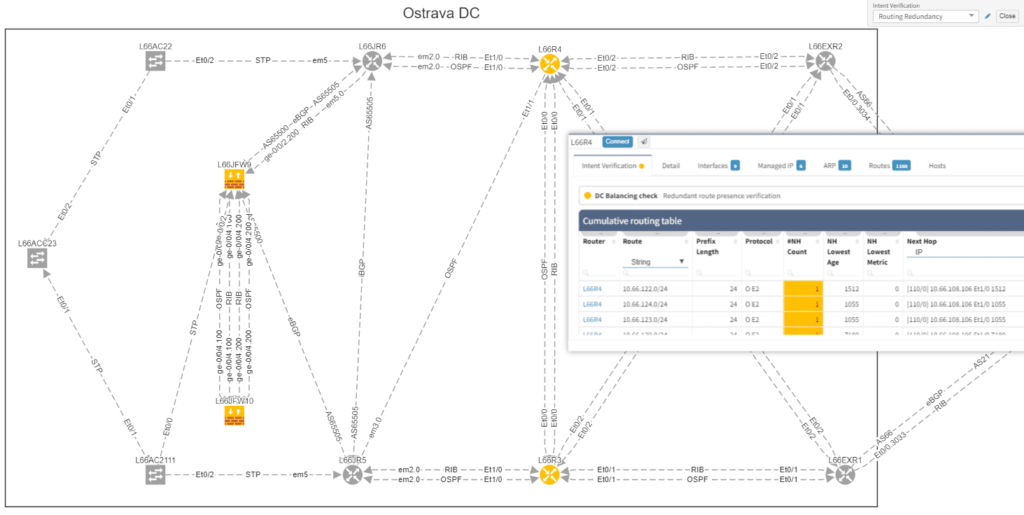
Of course, any intent verification group can be displayed separately. For example here we want to see only specific routing table entries which have routing redundancy issues in our datacenter.
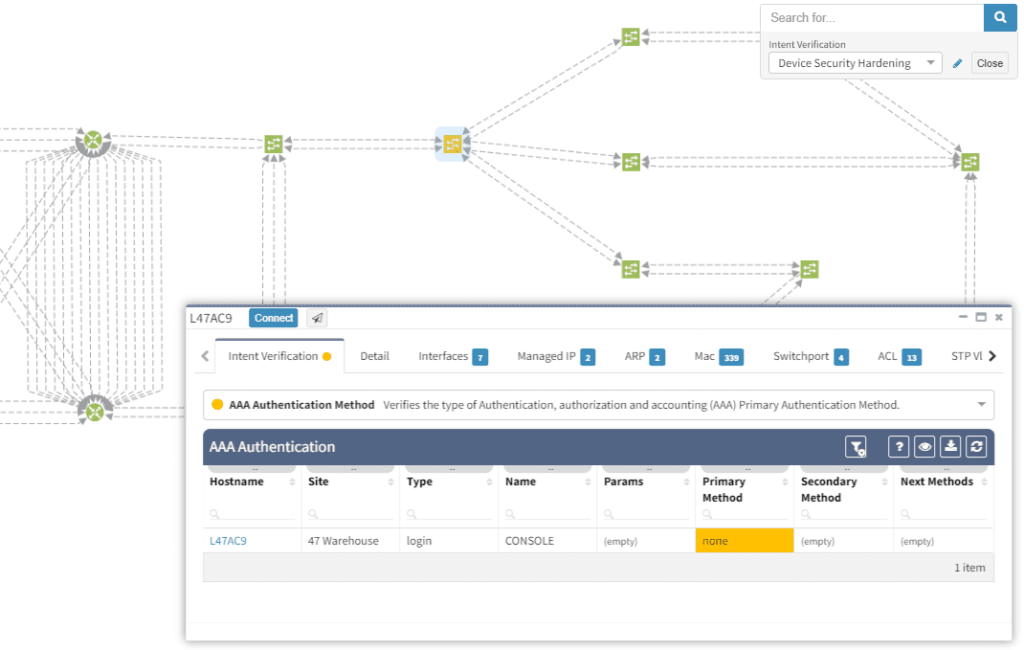
Or here we want to visually verify device security hardening for compliance checks, and suddenly see that one of our devices has AAA Authentication configured with method "none" allowing privileged access without any authentication.
Visualization is available for any type of Intent verification, and can be combined with visual snapshot comparison. Here we verify neighborship compliance, and once we see that there is an issue with OSPF neighbors, we compare Monday's network state with the network state at Sunday, to see if the network has changed.
This visual issue representation is available for any type of Intent-Based Verification which can be associated with a link or a device.
The intent-based networking (IBN) or intent-based verification (IBV) buzz word has been around quite some time. However, to this day, not every engineer from security or network operations is familiar with the concept. Apart from that, people with diverse backgrounds may have a different understanding of the approach.
The goal of any computer network is to transfer information based on multiple variables. The Intent-Based Networking (IBN) is focused on network automation and better aligning networks with operational goals or 'intent'. Intent is what we want networks to do. It differs from classical monitoring goals in that we can express advanced operational concepts or even business goals. In classic monitoring we might have checks such as "IP address X must be reachable" while 'operational intent' could be "Authorized users must be able to redundantly reach application servers".
Verifying reachability via ICMP from the monitoring center is one thing, but verifying specific path availability and parameters from a specific set of sources to specific set of destinations is significantly more complex and has usually required a lot of manual effort to complete. This is extremely important to understand, because 'intent' advanced next level of visibility and shifts operational notion from "up/down" to predictive analytics.
As networks move towards IBN, the IP Fabric platform is here to help automate a significant part of the process.
In the platform, we have already created the Assurance Engine that is capable of tracking protocol inconsistencies or providing feedback on network health. The IPF administrators have the power to create their own system-wide controlling mechanisms that fit their needs for IBN.
We decided to take this powerful feature to another level, and with version 3.3. we have introduced Intent-Based verification for the diagrams. Imagine you are viewing any available network topology or the end-to-end path, while you can apply any previously defined IBN rule directly.
In the new version, the platform collects and analyzes DHCP Snooping information for supported devices. The information includes normalized configuration and state, including trusted ports, option82 and the binding database amongst other parameters. You can find the new DHCP snooping tables at /technology/security/dhcp-snooping/configuration-v4 in the platform
The VLAN summary information is now compiled from the network specifically from VLAN point of view. Previously VLAN information was compiled and available only from point of view of the Spanning Tree Protocols, however VLANs without any STP association were not available in the platform. Now any VLAN that exists in the network can be found, analyzed, and visualized, even if it is suspended, broken, or exists on a single device without any STP capabilities. Definitive VLAN information can be found at /technology/vlans/device-detail in the platform
Detailed SSID radio information was already available for mapping each SSID on each wireless Access Point in the Network. This information was present for each unique AP-SSID pair, and therefore was inherently presented from the AP point of view. In this release we have added SSID summary table which provides information from the point of view of SSID, and should help in consistency verifications of SSID deployments in the network. The table is located at /technology/wireless/radios/ssid-summary in the platform
With a single double-click (all clap for an amazing self-contradiction) one can ungroup the links in diagrams. So far it was only available with the help of the 'group/ungroup' button in the protocols menu.
Every release we tend to update the vendor list per requests from our customers and IPF version 3.3 is not an exception. We’ve seen a somewhat surprising venture of Mikrotik platforms into enterprise environments, primarily for advanced routing and MPLS capabilities, so we have added support for the Mikrotik platform. Please keep in mind that Mikrotik routers require longer session timeout, otherwise they will be not discovered.
The Extreme routers and switches have been among supported vendors for some time but not the Enterasys devices which Extreme has acquired back in 2013. Starting with 3.3, the basic discovery has been added.
Discovery attempts to contact devices using Telnet or SSH, which is useful especially for very large networks or networks with significant history. There is always an occasional forgotten device with Telnet enabled which IPF platform could help to identify. However, not everyone is particularly happy by having Telnet sessions around with every discovery. In the new version, the Telnet can be disabled for discovery.
Transceivers on NX-OS platform are now available in the inventory, for the ASA the support for system-defined object groups was added and much more.
Big thanks to our supporting customers, who are constantly helping us to improve the platform. Full details of the release could be found in our Release Notes.
If you have found this article resourceful, please follow our company’s LinkedIn or Blog, where there will be more content emerging. Furthermore, if you would like to test our platform to evaluate how it can assist you in managing your network more effectively, please let us know through www.ipfabric.io.
Transcript
Today we will go through a quick demonstration of the IP Fabric platform and its main features. The IP Fabric platform is the network management system that helps companies to empower network engineers and teams to discover, verify, and document large scale networks within minutes.
IP Fabric's lightning-quick processes intelligently discover over 3,000 network infrastructure nodes an hour and collect more than 2,000 configurational and operational state data per active network device.
The system then generates a digital model of the entire network with the switching/routing and security logic built-in. Since IP Fabric can identify both known and unknown devices, it eliminates the need for manual inventory processes in the company.
To initiate the IP Fabric platform successfully, it first needs to be installed on VMWare 5.0 or later and have an access to all infrastructure devices via SSH or Telnet with correct credentials.
Of course we can apply additional settings, such as IP subnets to include or exclude from discovery, limit the bandwidth or the number of concurrent sessions during and many other.
Once the discovery is finished we have a complete digital image of the entire network, which we call the snapshot. In every snapshot, we can run end to end path simulations, view all operational data about the network, analyze network topology maps or verify the network’s overal state with the Assurance Engine.
That is all for the introduction, now let’s get started with the demo.
We are currently in the Snapshot management area. We have 4 snapshots loaded in the RAM memory and they are available to be explored immediately. Historical ones are stored on the Hard drive and can be loaded to RAM anytime. We can decide to add more devices to currently active snapshot or reinitiate discovery on selected devices and get the newest data.
We have the Connectivity Report which contains all IPs that the platform interacted with during discovery process, which is great for troubleshooting purposes and it underlines complete transparency that the user has when using the platform.
With our current snapshot, we discovered almost 600 devices and it took us about 10 minutes. We have the list of sites that serve as a logical groups for network devices. The user has full control over the Site Separation mechanism, sites can be based on devices’ location or function, it’s up to administrator to decide.
Now we will examine the inventories. We have full and very detailed visibility into all types of inventories: Devices, Interfaces, End-points or End-Of-Life milestones, which are very important for lifecycle management.
In any inventory or technplogy tables Sorting and Filtering tools are available. For example, in case I want to find all Juniper SRX devices within the inventory, I will fill in the vendor and the platform field and I have results available in seconds.
I can choose which parameters will be visible or change the columns’ order. Any filtered output is easily exportable to a CSV document and can be shared with the team. By the way, all search or filter functions available in graphical user interface are obtainable via API as well, with full documentation available online or in the platform.
MTU
Because the platform is the tool not only for viewing static data but also for analyzing behaviour of variety of protocols. Addressing any inconsistent states is very easy. As an example we can explore data for the Maximum Transmission Unit (or MTU) on all links just by few clicks.
I will search for an MTU, where we have all the information available. To discover any issues, we’ll just click on available verficiation and we have results in seconds.
Detecting inconsistent MTUs on all transit links in large scale networks can be a really time consuming to get, there can be tens of thousands links to verify.
After discovery, we only export the data and send it to operations team immediately. This type of proactive network management will help us to decrease the number of network issues in the future.
If we desire to have a visual representation of MTU results in diagrams, we will click on the site button and check for MTU in there.
OSPF
Similar applies if for any other supported technology. In the platform we can research routing and switching protocols, stacks, clusters, 802.1X, PoE, Quality of service and many many more. The IP Fabric platform is a search engine for any network.
As an example may be OSPF protocol.
We are very quickly seeing all OSPF sessions with all details on the network. By a single click we can tell if there are any sessions down or in transition state and use it for documentation purposes or for troubleshooting.
In addition we can go back in time, switch the snapshot and see historical results, which makes it an amazing tool for root cause analysis.
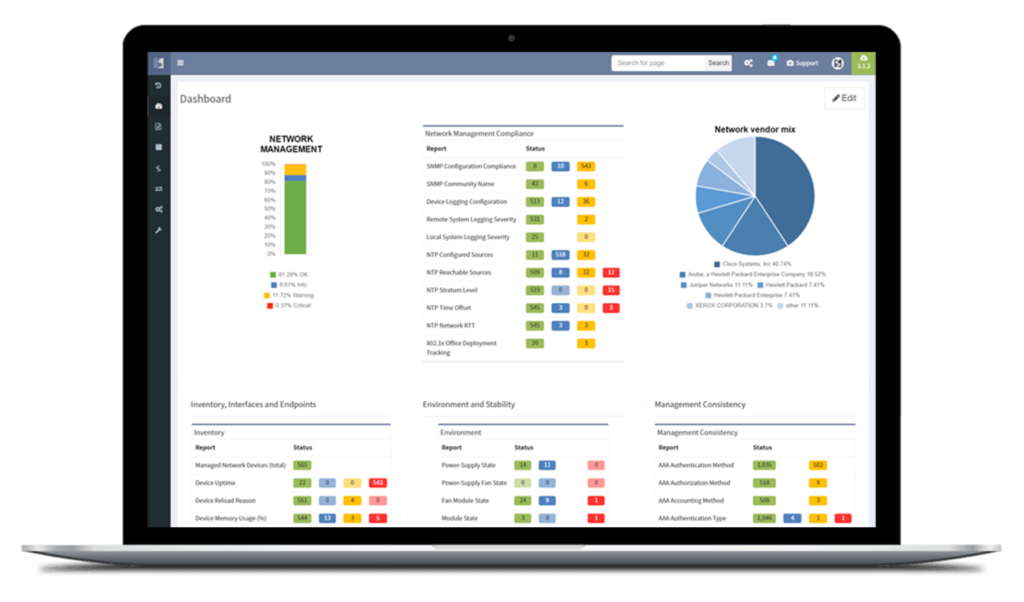
Assurance Dashboard
Last feature we would like to delve into, before we move on to diagrams, is the IP Fabric’s Assurance Dashboard, where all these verifications are displayed in one place.
IP Fabric is supplied with dozens of predefined network verification checks. These checks can be altered based on your needs, or you can create your custom ones very easily.
There are many focusing on Management protocols, Performance, Stability, Routing and Switching protocols, and we can go on..
All verifications are provided with explainers and all these results can be exported to the Network Analysis Report, which can be generated by the platfrom on demand.
Diagrams
And now the Diagrams. With the IP Fabric, you have full and detailed visibility on a protocol level. There are not only physical links between devices in the topology maps but all relations between devices. If it's OSPF or BGP session, Spanning-Tree or discovery protocols.
All views and layouts can be easily modified or built from the scratch with the amazing View Builder feature. All available in a multivendor environment.
The network devices can be repositioned freely and the layout can be saved for future analysis. And the same diagram appears in the Low-Level design document, which can be also generated by the platform.
What we can quickly explore in terms of layers is Discovery protocols, which can be considered as physical layer mapping, Spanning-Tree or Mac layer and Routing protocols, all separately or together at once in a diagram.
In case we desire, for example, to track a single VLAN in the topology, we will click on any trunk link, select the VLAN number and immediately analyze which ports are in forwarding or blocking state for any particular VLAN or examine where the root bridge is.
The same we can do for any previous snapshot, we may go back in time and analyze any topology from the past!
Now a quick look at routing protocols. In the current topology, we have OSPF and BGP present, apart from that we support all mayor routing protocols including EIGRP, RIP, IS-IS or Label Distribution protocol from the MPLS environment.
By interacting with any link or node we get more detailed data, we can add the cost on OSPF links if we want to and export the topologies.
In addition we are able to visualize connected servers, IP phones or PC or wireless access-points if they are present. Then visualize QoS, Access-Lists or First Hop Redundancy protocols, detect single points of failure or non-redundant links.
End-to-End
Now we will move on to the E2E path testing. The End to End path testing can be essential for root cause analysis, verifying the post-migration state of selected application paths across the network or any ad-hoc testing related to client’s portion of the network. The IP Fabric platform enables seamless and extremenly fast path testing on the created mathematical model.
It takes literally seconds to complete standard end to end simulations for switching, routing and security portion. It is also possible to test end-to-end in MPLS networks based on labels.
So let’s test on our own:
With the path check feature, selected paths can be saved and continuously verified by the platform with every new discovery automatically.
Documentation
Maintaining network documentation may be a tedious and difficult process, that requires a vast amount of time. Which is the main reason why many companies are necessarily hiring external resources to complete the task.
To simplify the process, IP Fabric platform automates network documentation. There are currently two types of automated documents. The first one is the LLD document, which provides a detailed network overview for each business location, including topology visualization.
The second one is the Network Analysis Report, which will give you an overall report of your network, including network state checks.
If you’re interested in learning more about how IP Fabric’s platform can help you with analytics or intended network behavior reporting, contact us through our website, request a demo, follow this blog or sign up for our webinars.
As networks become increasingly complex, the job of network administrators becomes more and more demanding. To understand the sheer amount of effort that the role takes, you only have to look at the task of analyzing the enormous amounts to status information within a network.
With the methods that most organizations are using, analyzing network status, preventing link capacity and node overloads, and having enough information to take immediate action within your network is virtually impossible.
If network admins were able to harness the power of network visualization and dynamic network mapping regularly, instead of it being a long, laborious process that takes months to create, they’d suddenly be able to visualize the relationships between network elements and have an accurate representation of the network’s graph structure.
Network visualization helps clarify and define the relationships between network nodes and the links between them and displays them either as an online (live) diagram or an offline diagram.
When dealing with network visualization, several rules need to be considered.
For this example, we’re going to use seven rules from Eugen Goldstein, the German physicist that is often credited with the discovery of the proton, and apply them to network visualization software.
Also, as another example, other basic rules which can be good to consider, are:
These rules were given by Ben Shneiderman (an American computer scientist).
Network visualization helps users connect the dots more quickly than just staring at a spreadsheet of data. With visualization, reports can be more straightforward and can be far more effective. These easy to follow reports provide network engineers the intelligence for monitoring, troubleshooting and gathering reports of the network, which helps them to analyze and understand the status of their networks nodes, links, and more.
Network visualization tools can also help network security engineers handle security issues and more easily observe the status of their systems.
The monitoring software helps network engineers visualize the patterns within their complexed network, which enables them to troubleshoot issues and make informed decisions much more quickly, minimizing downtime during outages. Visualizations can be used in offline mode, giving you the flexibility to view a static picture, or online mode, which lets you see changes as they’re discovered in real-time.
If they were armed with network visualizations, admins would soon find that troubleshooting, assessing, and planning out their networks would be a piece of cake! Unfortunately, features like these go far beyond what any legacy network tools are able to provide.
That’s where IP Fabric comes in.
IP Fabric’s platform uses visualization to provide users with detailed tech visibility and drill-downs on dynamic network maps. The system visualizes individual technology and protocols, which enables network engineers to plan changes, troubleshoot connectivity issues, and document the network.
Mapping out and verifying end-to-end paths, from switching through balancing to firewall and cluster policies, enables network engineers to troubleshoot issues much quicker, and to communicate with other engineers about the network.
Using visualization, IP Fabric maps out complete active network paths between any two endpoints. The map shows you the routing and switching forwarding decisions, including the results of all of the security decisions of all active path filters for the specific source-destination pair.
End to end path mapping
As a network engineer, it’s incredibly important to be able to see your site-to-site connectivity or your individual sites, including all of your managed and unmanaged devices (including wired/wireless users, or IP phones). IP Fabric visualizes the details of individual protocols or aggregate links and topologies into a representative view.
IP Fabric helps you delve into active QoS, applied Access Control Lists, or transmission issues on any of the diagrams. Use the platform to verify links and device redundancy, or visually analyze specific protocol topology.
Try IP Fabric for yourself and see just how useful network visualization and network dynamic diagrams can really be.
Documentation is a critical part of any project or technical environment. If we don’t jot down some important information along the way, we end up repeatedly asking the same basic questions over and over again, completely draining our team members. We’ve heard from many team members that have admitted that the most annoying part of their day is answering those same repetitive questions day after day.
To begin with, when it comes to documenting computer networks (or other similar systems) we tend to use programs like draw.io or Visio. These programs are fantastic for outline ideas during the creative process of designing a new network. Furthermore, tools like these help us visualize our concepts, present them to others, then easily update those ideas as they evolve into a more cohesive plan.
For these tasks, these tools are great, but when the environment goes live… we quickly discover that we need something more.
Content updates to documentation can be a pain to maintain, especially for some of the more extensive networks — and the larger the network, the more changes an organization seems to want to make per day.
One solution to this issue is to appoint a dedicated team member (or, depending on the size of the network, an entire team) with the task of maintaining documentation. Whether they’re frequently updating the documentation themselves, or pushing the engineers to update the documentation after each update, this becomes quite the labor-intensive task.
Before we built the IP Fabric platform, we knew that there had to be some way to save time during time-consuming network operations processes. After simplifying that process through automation, we then took that same logic and turned our sights on the documentation process. Hence, we added a feature to the platform that gathers more than 1000 parameters from a single network device.
Now, on top of generating breathtaking interactive network diagrams, the platform can generate low level design documents. After every discovery snapshot, the platform creates a report that includes all the information needed for an audit, including device inventory details, physical layer, data-link layer details, routing and switching details.
These documents full of fancy diagrams can be generated whenever needed, and can easily be modified or compared to previous versions. This feature is an excellent timesaver for any Network Engineer or Network Engineering Manager, which helps them become a much more productive team member. Instead of wasting time working on mundane tasks, they can focus on tasks that create value. For example, examining overall network architecture, increasing stability, or having some spare time to enjoy their cup of coffee.
If you’re interested in learning more about how IP Fabric’s platform can help you with analytics or intended network behavior reporting, contact us through our website, request a demo, follow this blog or sign up for our webinars.
Routing, one of the most important features in network world. It’s been at least a two decades since most of ISPs rely on Border Gateway Protocol (BGP) in their core, supported by Interior Gateway Protocols (IGP). Local area networks are running and routing with use of IGPs on their own and it’s already being utilized as an underlying protocol for other features like Virtual Extensible LANs and more. There’s no question that routing as a feature is holding technological world together, but as networks grow, it’s more and more obvious that administrator are more likely to miss an issue.
Command line interface is fast but when we try to see a bigger picture, we can easily miss the point while interacting with ten routers at once. That’s why routing protocol visualization itself become one of the most wanted features in IP Fabric since its start.
Routing table discovery has been implemented for a long time now and it’s not what will be discussed. Very recently we have been working on various parameters discovery for routing protocols, it started with OSPF support, while RIP support is in progress (and yes it’s still out there), Cisco native EIGRP and of course BGP. All have full Virtual Routing and Forwarding (VRF) instances support, which makes it a much more powerful as a feature for larger networks. The very next in line may be IS-IS, but I don’t want to speculate for now.
Open Shortest Path First (OSPF) may be one of the most used IGP protocol at this time. Again, I haven’t seen all networks in the world but my guess is, it would be so. It’s very wide-spread within vendors, easy to implement. IP Fabric currently supports OSPF on Cisco, Juniper and HP/Comware all with VRF support. Let’s have a quick tour in our lab.
In our virtual lab environment we ran discovery from IP Fabric and if in search of OSPF data, the best is to visit Technology > Routing > OSPF from the left-side menu.
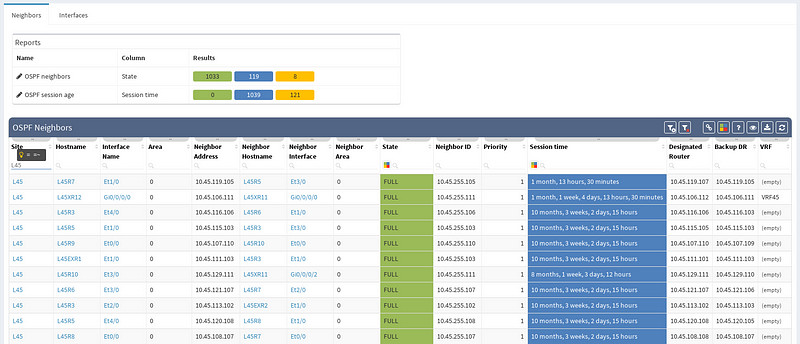
It’s very neat set of information, clear to all techs and the view is vendor neutral. For example the ‘Area’ information is formatted/translated to single integer, also for Juniper boxes where it’s standardly represented in IP/CIDR format. Again you can manipulate the view, remove or add columns or even change their order as you like, it’s all very flexible. Let’s switch to visual interpretation.
While in diagrams, all parameters pop-up as we need, those are the same as provided in OSPF neighbors table, but it’s filtered per diagram content. Same we can explore in BGP, we can even see Autonomous System numbers on connecting links. IP Fabric currently supports also site-to-site OSPF neighbourship when using tunnel interfaces of other technologies.
If you’re interested in learning more about how IP Fabric’s platform can help you with analytics or intended network behavior reporting, contact us through our website, request a demo, follow this blog or sign up for our webinars.


