In API Programmability - Part 2 we showed you the basics of how to use IP Fabric’s Python SDK. In this post, we will create a web server using FastAPI to receive webhooks from IP Fabric. After certain events occur, we will use python-ipfabric to extract and manipulate data to enhance your automation efforts.
Find today's code example on GitLab at 2022-05-06-api-programmability-part-3-webhooks.
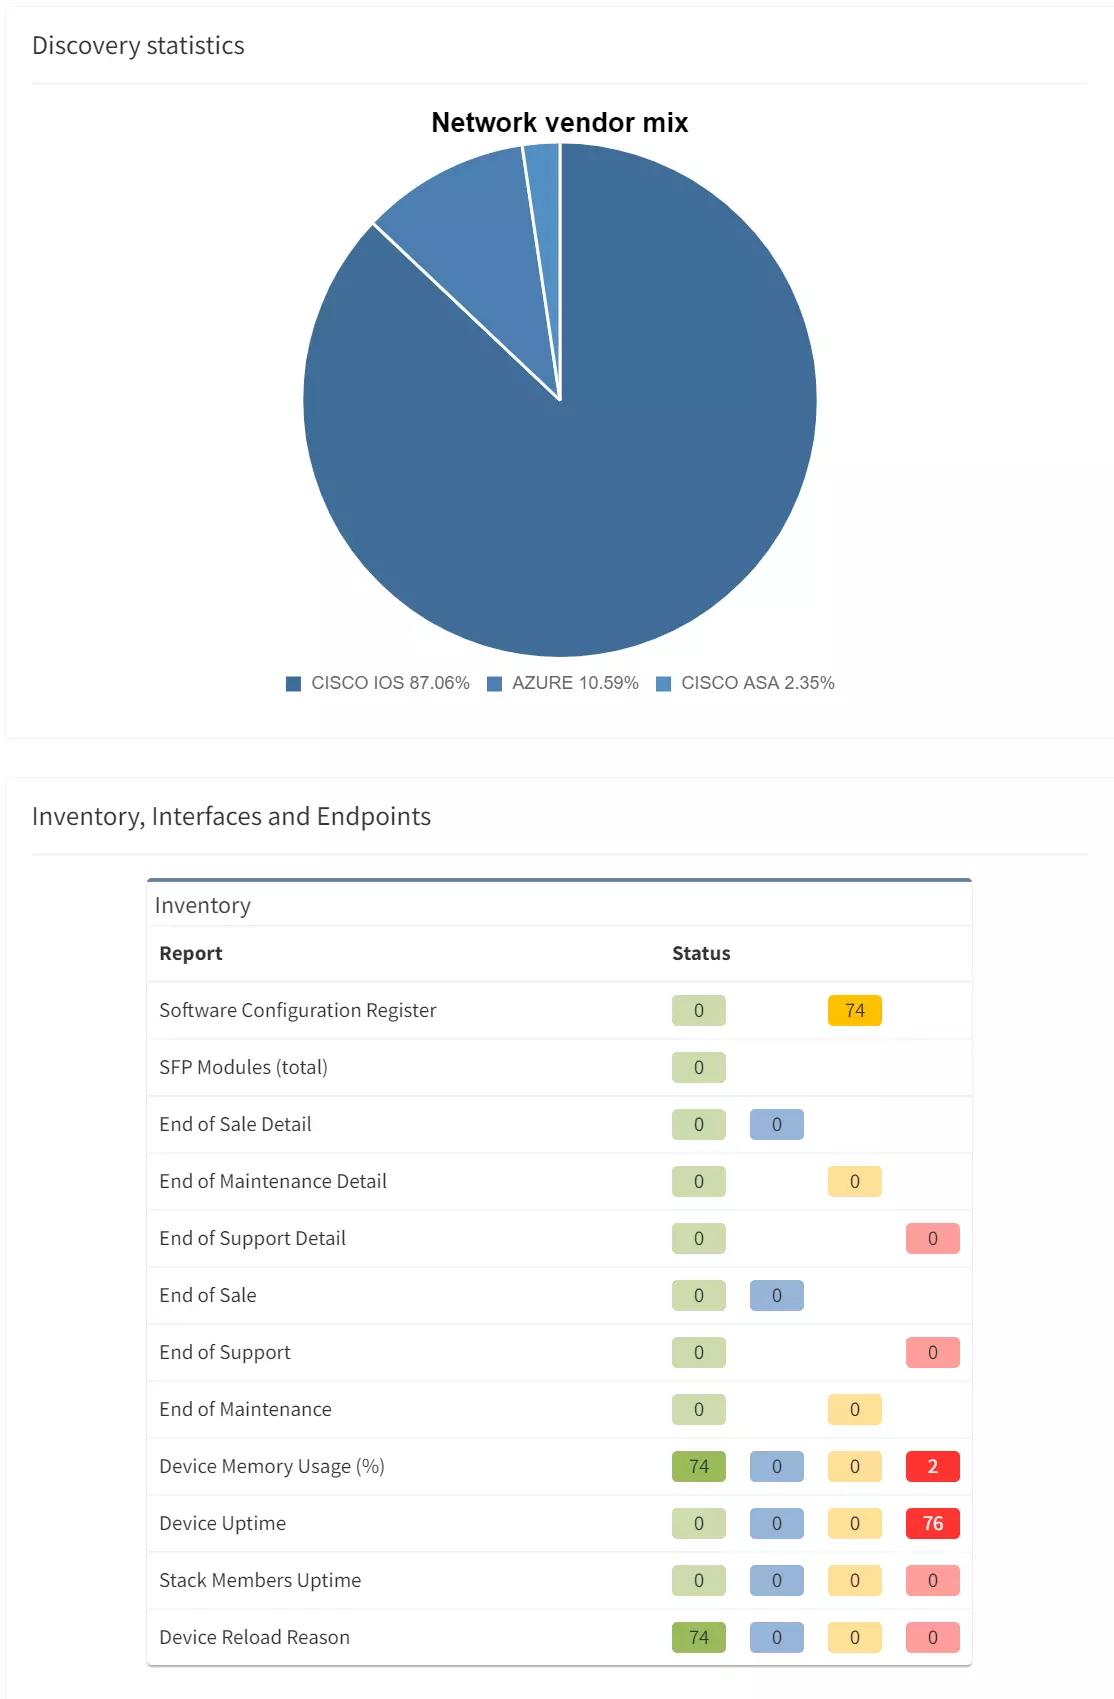
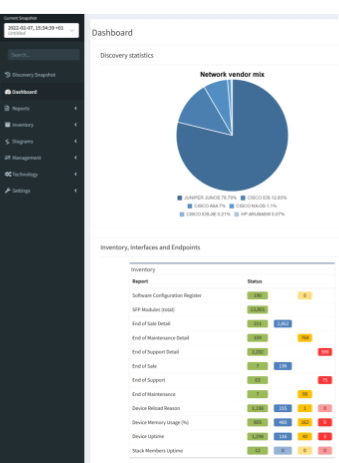
Today we will be importing IP Fabric data into a PostgreSQL database after a Snapshot Discovery is completed. This is beneficial for visualizing trending analysis of important information such as the number of devices, End of Life migrations, or Intent Verifications. Due to the IP Fabric limit of five loaded snapshots, it is very difficult to see last week's KPI's or 6 months ago. Long historical analysis can be accomplished by extracting a subset of the data using the API, transforming it into a Python data model, and loading it into a PostgreSQL database. Connecting this database to a visualization tool like Grafana or Tableau will allow your teams to create interactive dashboards.
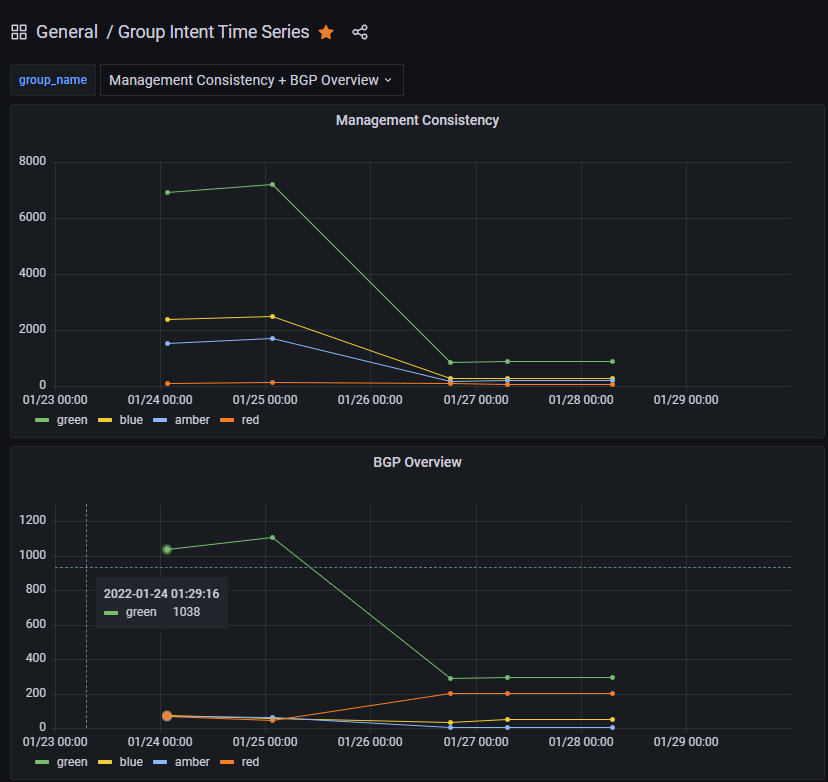
This example takes all the Intent Rules in an Intent Group and adds severities together to summarize the entire group.
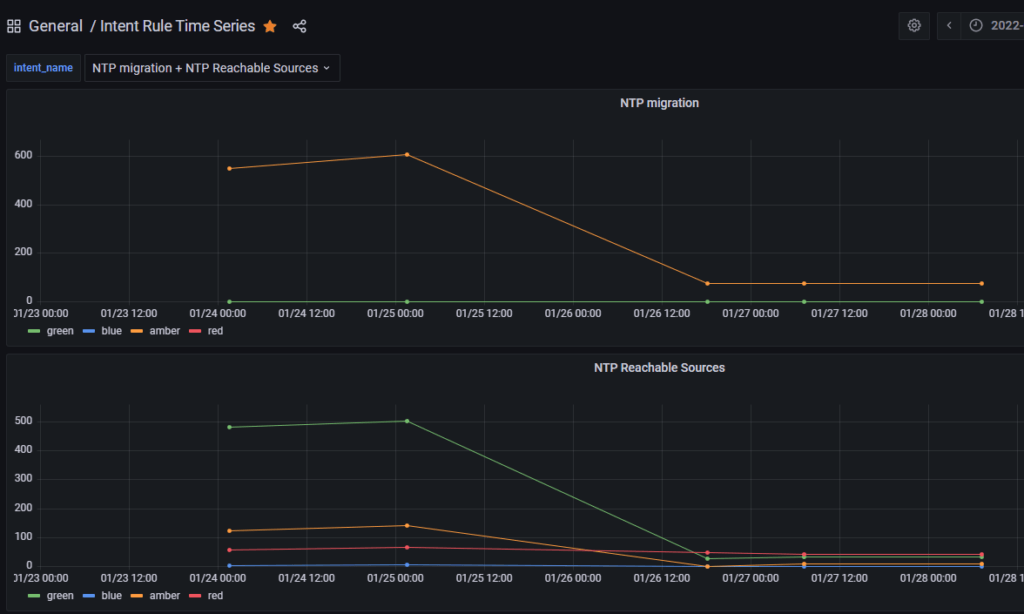
It is also possible to graph the individual intent rules for further analysis.
Here are some basic requirements for working on this project. Please note that this is a base example for developmental purposes and extra caution should be taken into account prior to running this project in a production environment (enabling HTTPS, healthchecks, etc).
python3 -m pip install -U pip poetryThis project is using Poetry to manage python dependencies and allow you to merge multiple examples together. Today we will be focusing on the postgres example which will take the snapshot data and insert inventory and intent data into a PostgeSQL database for long-term historical trending. This will require access to either a local or remote PostgreSQL database as well as other requirements listed above.
The easiest way to download the project is to use git for cloning.
SSH: git clone [email protected]:ip-fabric/integrations/marketing-examples.git
HTTPS: git clone https://gitlab.com/ip-fabric/integrations/marketing-examples.git
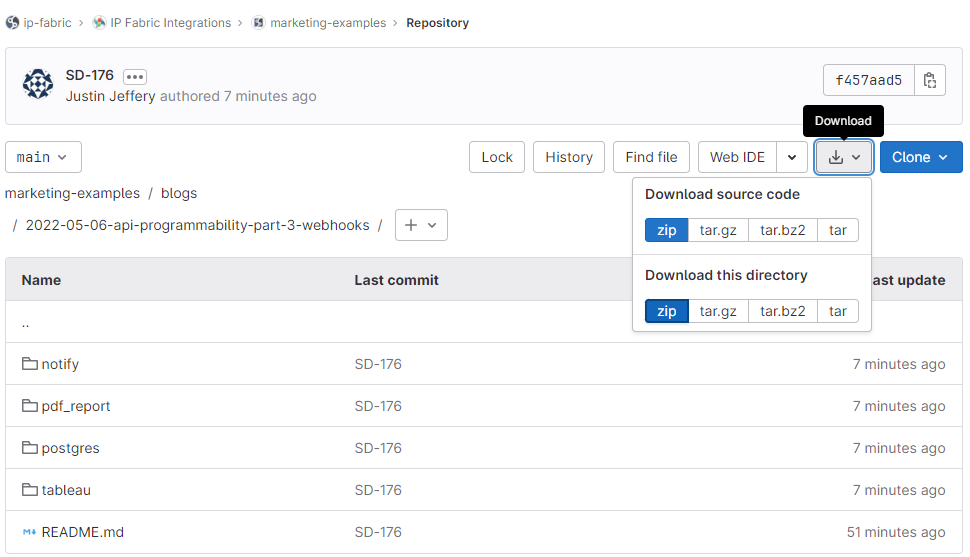
Another option would be going to GitLab and downloading the zip file.
Installing the Python-specific requirements for this project is a simple command poetry install in the directory with the pyproject.toml file. Please take a look at the example specific README files for other dependencies outside Python (i.e. a PostgreSQL database).
To create a new Webhook navigate to Settings > Webhooks in IP Fabric and select Add Webhook:
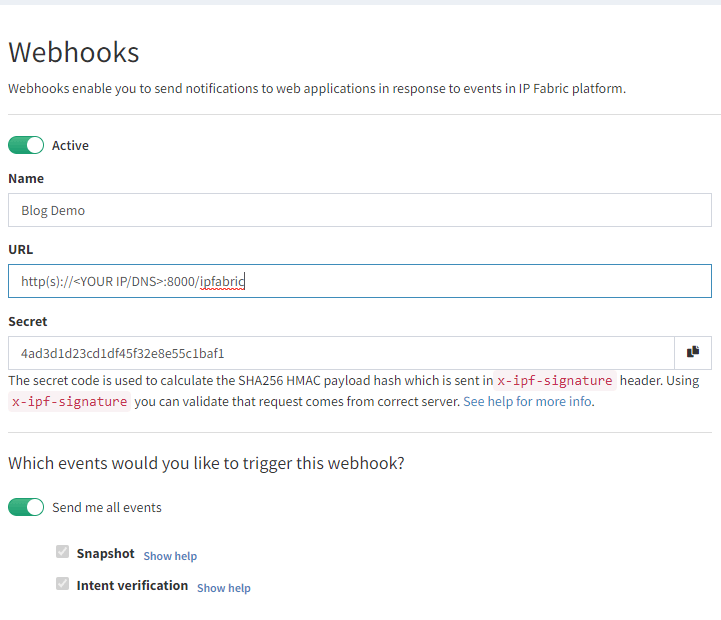
Here you will create a name, your URL, and select the events to listen for. The postgres example requires both Snapshot and Intent verification to load all the required data. Prior to saving please copy the Secret key as this will be used in the configuration. If you forget this step it can be viewed after saving, unlike API tokens.
In your project copy sample.env file to .env and enter your environment's specific data.
IPF_SECRET is the secret key copied above; this validates that the message came from your IP Fabric instance and not another server.IPF_URL must be in this format https://demo3.ipfabric.io/IPF_TOKEN is created in Settings > API TokenIPF_VERIFY to false if your IP Fabric certificate is not trusted.IPF_TEST to true for initial testing and then change to false.The webhook listener can be run through Poetry or Docker. This will require communicating to the PostgreSQL database prior to starting the webserver to ensure that the schema is installed and the tables are set up.
poetry run apidocker-compose upC:\Code\part-3-webhooks\postgres>poetry run api
INFO: Started server process [12740]
INFO: Waiting for application startup.
INFO: Application startup complete.
INFO: Uvicorn running on http://0.0.0.0:8000 (Press CTRL+C to quit)
This output provides us the information which we can put in the Webhook's Settings URL. The 0.0.0.0 signifies it is listening on all IP addresses of your system (run ipconfig or ip addr to get the correct IP to replace it). This is also configured to run on port 8000 so the URL which I will need to edit in IP Fabric will look like http://192.168.1.100:8000/ipfabric.
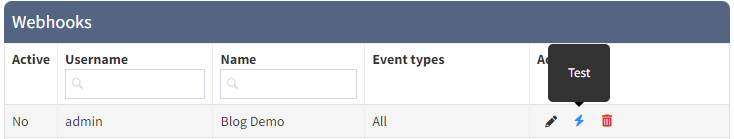
When the IPF_TEST variable is set to true the server will process a test message as a normal webhook and verify it is working. Select the lightning bolt icon in the Webhooks settings and then choose which rule to send.
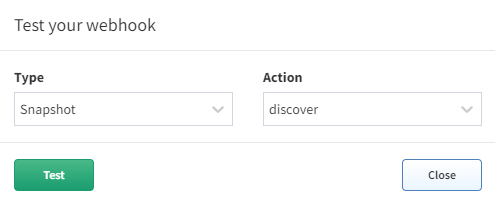
The postgres example will use the $last snapshot to perform the automation against when a test webhook event is sent (make sure to test both Snapshot - discover and Intent verification - calculate to load all the data for that snapshot). When a test webhook runs it creates a random snapshot ID that does not conflict with others in the system.
Once the test is successful it is advisable to set IPF_TEST back to false and restart the server. If you try to run the test again it will fail because the unique snapshot_id has already been inserted into the database to prevent duplicate entries.
This branch will also only process snapshot events that have been run through the scheduler (user:cron). If a user manually creates a new snapshot or updates an existing one, then the webhook messages will be processed and ignored.
Using IP Fabric Webhooks will further your team on their Network Automation journey and provide the ability to integrate into any external system you can imagine. Today we focused on importing the data into an external database, but this can be extended to import into a Configuration Management Database (CMDB), Network Management System (NMS), or Monitoring Tools to ensure that these critical infrastructure components have full visibility of your network.
If you have found this article helpful, please follow our company’s LinkedIn or check out our other blog posts. If you would like to test our solution to see for yourself how IP Fabric can help you manage your network more effectively, please contact us through www.ipfabric.io.
The Grafana JSON models are located in the Grafana directory on GitHub. You will need to configure your Grafana instance to connect to your PostgreSQL database and find the generated UID for that connection. Then in the JSON files replace all instances of <REPLACE WITH UID OF YOUR CONNECTED POSTGRES DB> with the correct value. Finally, you should be able to import the new dashboards.
If you are interested in extracting more data than the example provides (perhaps the BGP Summary table) this can be accomplished by adding on to the existing Python code. If you need assistance with this or have an idea for a new integration please open a GitLab issue.
In API Programmability - Part 2 we showed you the basics of how to use IP Fabric’s Python SDK. In this post, we will create a web server using FastAPI to receive webhooks from IP Fabric. After certain events occur, we will use python-ipfabric to extract and manipulate data to enhance your automation efforts.
Find today's code example on GitLab at 2022-05-06-api-programmability-part-3-webhooks.
Today we will be importing IP Fabric data into a PostgreSQL database after a Snapshot Discovery is completed. This is beneficial for visualizing trending analysis of important information such as the number of devices, End of Life migrations, or Intent Verifications. Due to the IP Fabric limit of five loaded snapshots, it is very difficult to see last week's KPI's or 6 months ago. Long historical analysis can be accomplished by extracting a subset of the data using the API, transforming it into a Python data model, and loading it into a PostgreSQL database. Connecting this database to a visualization tool like Grafana or Tableau will allow your teams to create interactive dashboards.
This example takes all the Intent Rules in an Intent Group and adds severities together to summarize the entire group.
It is also possible to graph the individual intent rules for further analysis.
Here are some basic requirements for working on this project. Please note that this is a base example for developmental purposes and extra caution should be taken into account prior to running this project in a production environment (enabling HTTPS, healthchecks, etc).
python3 -m pip install -U pip poetryThis project is using Poetry to manage python dependencies and allow you to merge multiple examples together. Today we will be focusing on the postgres example which will take the snapshot data and insert inventory and intent data into a PostgeSQL database for long-term historical trending. This will require access to either a local or remote PostgreSQL database as well as other requirements listed above.
The easiest way to download the project is to use git for cloning.
SSH: git clone [email protected]:ip-fabric/integrations/marketing-examples.git
HTTPS: git clone https://gitlab.com/ip-fabric/integrations/marketing-examples.git
Another option would be going to GitLab and downloading the zip file.
Installing the Python-specific requirements for this project is a simple command poetry install in the directory with the pyproject.toml file. Please take a look at the example specific README files for other dependencies outside Python (i.e. a PostgreSQL database).
To create a new Webhook navigate to Settings > Webhooks in IP Fabric and select Add Webhook:
Here you will create a name, your URL, and select the events to listen for. The postgres example requires both Snapshot and Intent verification to load all the required data. Prior to saving please copy the Secret key as this will be used in the configuration. If you forget this step it can be viewed after saving, unlike API tokens.
In your project copy sample.env file to .env and enter your environment's specific data.
IPF_SECRET is the secret key copied above; this validates that the message came from your IP Fabric instance and not another server.IPF_URL must be in this format https://demo3.ipfabric.io/IPF_TOKEN is created in Settings > API TokenIPF_VERIFY to false if your IP Fabric certificate is not trusted.IPF_TEST to true for initial testing and then change to false.The webhook listener can be run through Poetry or Docker. This will require communicating to the PostgreSQL database prior to starting the webserver to ensure that the schema is installed and the tables are set up.
poetry run apidocker-compose upC:\Code\part-3-webhooks\postgres>poetry run api
INFO: Started server process [12740]
INFO: Waiting for application startup.
INFO: Application startup complete.
INFO: Uvicorn running on http://0.0.0.0:8000 (Press CTRL+C to quit)
This output provides us the information which we can put in the Webhook's Settings URL. The 0.0.0.0 signifies it is listening on all IP addresses of your system (run ipconfig or ip addr to get the correct IP to replace it). This is also configured to run on port 8000 so the URL which I will need to edit in IP Fabric will look like http://192.168.1.100:8000/ipfabric.
When the IPF_TEST variable is set to true the server will process a test message as a normal webhook and verify it is working. Select the lightning bolt icon in the Webhooks settings and then choose which rule to send.
The postgres example will use the $last snapshot to perform the automation against when a test webhook event is sent (make sure to test both Snapshot - discover and Intent verification - calculate to load all the data for that snapshot). When a test webhook runs it creates a random snapshot ID that does not conflict with others in the system.
Once the test is successful it is advisable to set IPF_TEST back to false and restart the server. If you try to run the test again it will fail because the unique snapshot_id has already been inserted into the database to prevent duplicate entries.
This branch will also only process snapshot events that have been run through the scheduler (user:cron). If a user manually creates a new snapshot or updates an existing one, then the webhook messages will be processed and ignored.
Using IP Fabric Webhooks will further your team on their Network Automation journey and provide the ability to integrate into any external system you can imagine. Today we focused on importing the data into an external database, but this can be extended to import into a Configuration Management Database (CMDB), Network Management System (NMS), or Monitoring Tools to ensure that these critical infrastructure components have full visibility of your network.
If you have found this article helpful, please follow our company’s LinkedIn or check out our other blog posts. If you would like to test our solution to see for yourself how IP Fabric can help you manage your network more effectively, please contact us through www.ipfabric.io.
The Grafana JSON models are located in the Grafana directory on GitHub. You will need to configure your Grafana instance to connect to your PostgreSQL database and find the generated UID for that connection. Then in the JSON files replace all instances of <REPLACE WITH UID OF YOUR CONNECTED POSTGRES DB> with the correct value. Finally, you should be able to import the new dashboards.
If you are interested in extracting more data than the example provides (perhaps the BGP Summary table) this can be accomplished by adding on to the existing Python code. If you need assistance with this or have an idea for a new integration please open a GitLab issue.