This week we released IP Fabric version 2.2.5 which focuses on improvements of network diagram workflow, significantly improving the depth of information provided in the diagram tooltips, and improving readability of the End to End path diagrams. We’ve also added pseudo-STP links, or MAC edges, to correctly interconnect Layer 2 and Layer 3 when discovery protocol is not present between the devices. This release also adds support for GLBP protocol, support for multi-context Cisco ASA firewalls, support for discovery of ExtremeXOS devices, wireless support for HP830/850, and many other improvements and fixes as detailed in the release notes.
Clicking on a device or link in the network diagram now opens a detailed tooltip with information about the object. Information is contained in tabs of each window, and tabs depend on what functions the device is performing and what protocols it is running. For routers there is naturally more Layer 3 information, including ARP and active routing table entries. For switches there is much more Layer 2 detail, such as switchports and MAC address table entries.
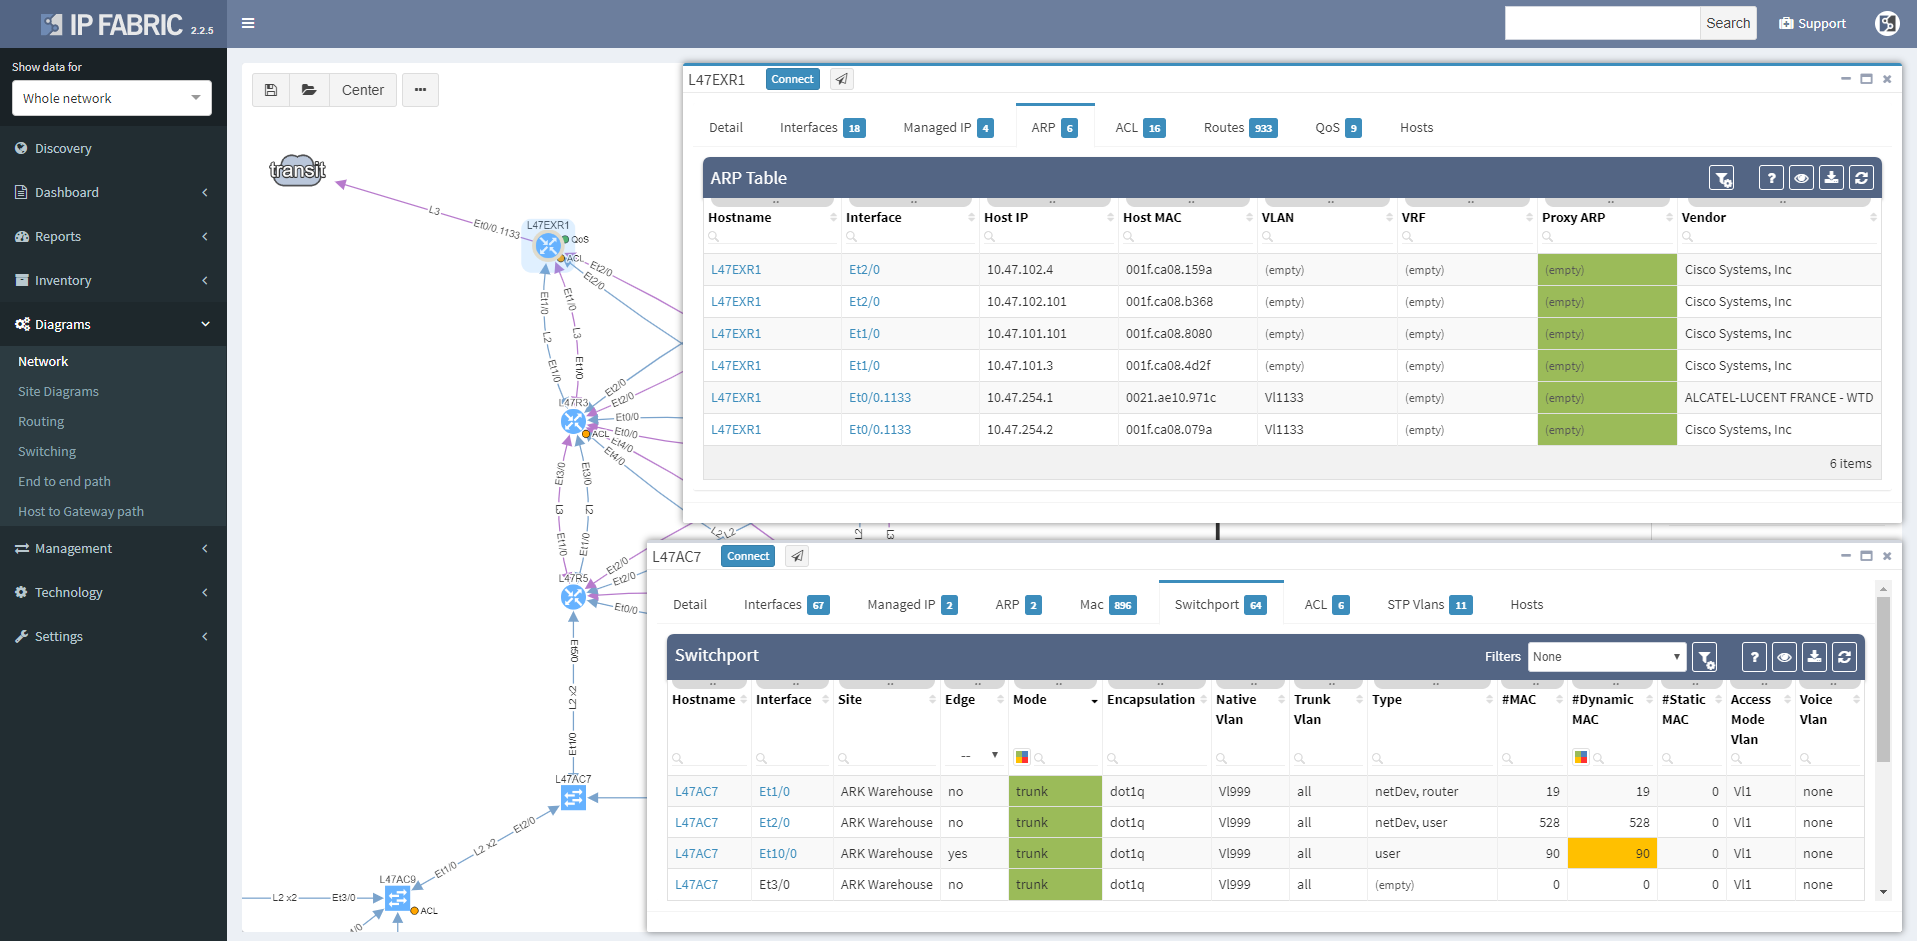
Wireless controller tooltips contain information about APs, firewalls about zones, and so on.
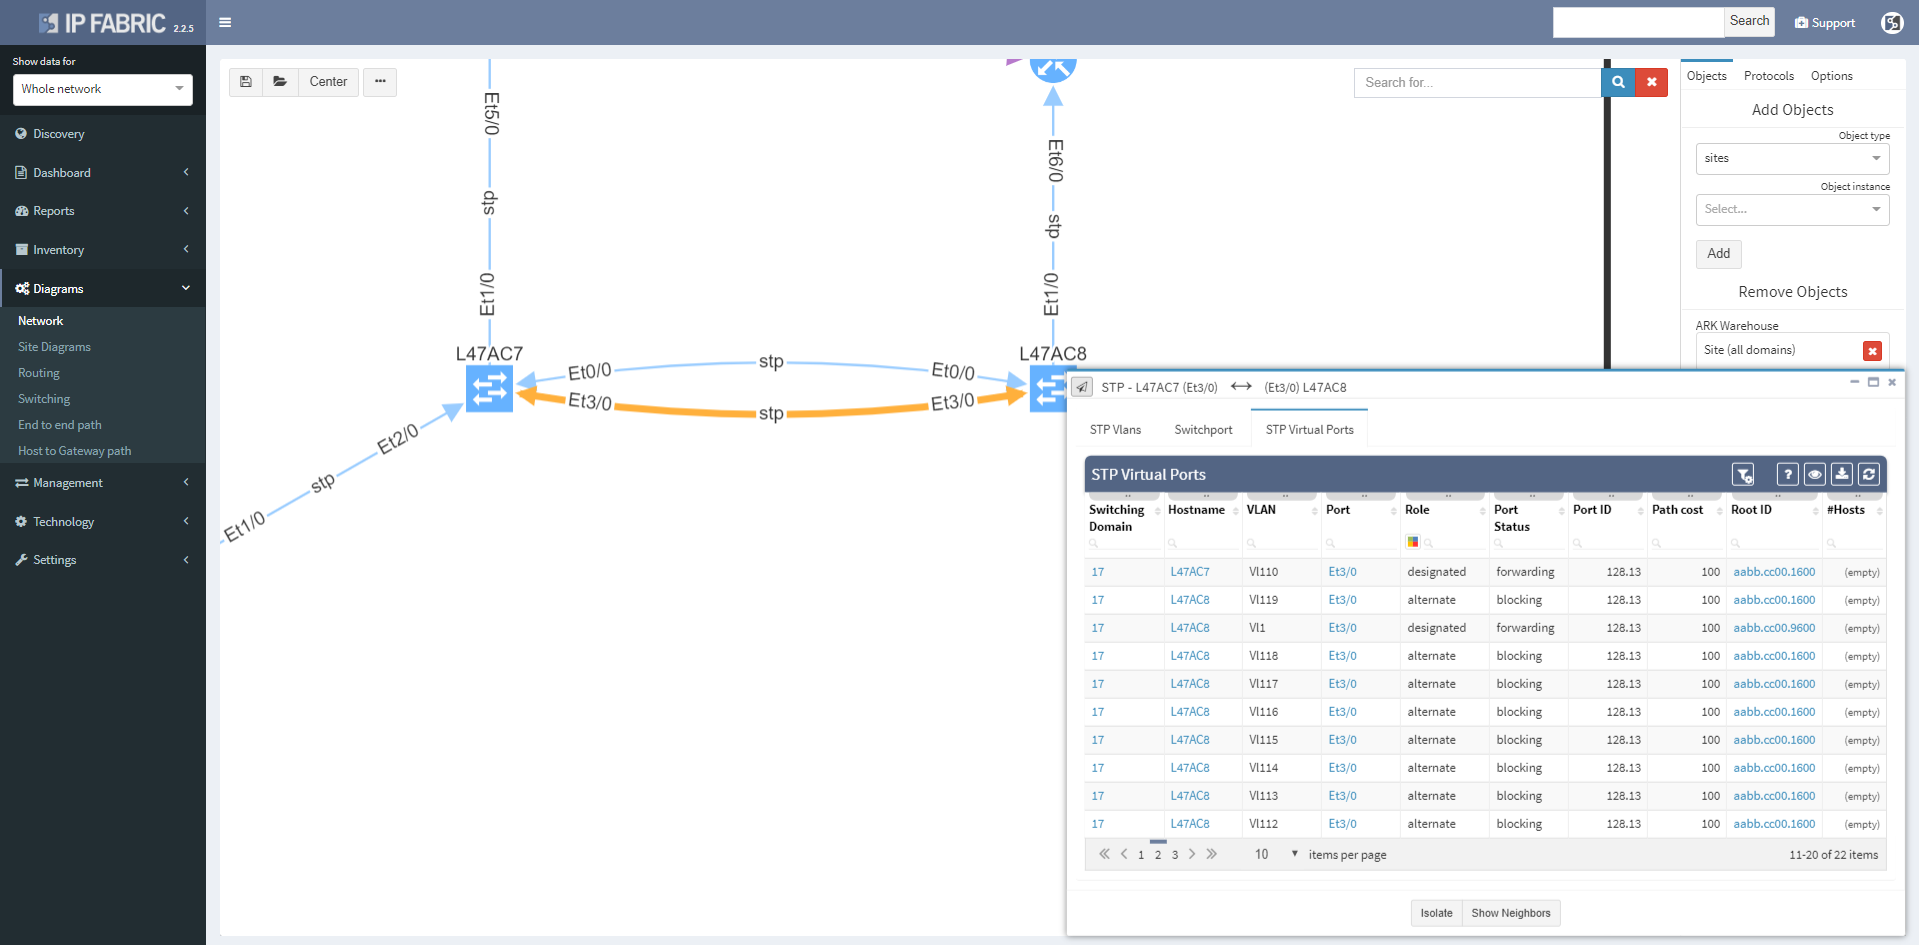
Clicking on a protocol link also opens a window with specific details relevant for the protocol, such as virtual ports and switchport details for the STP link
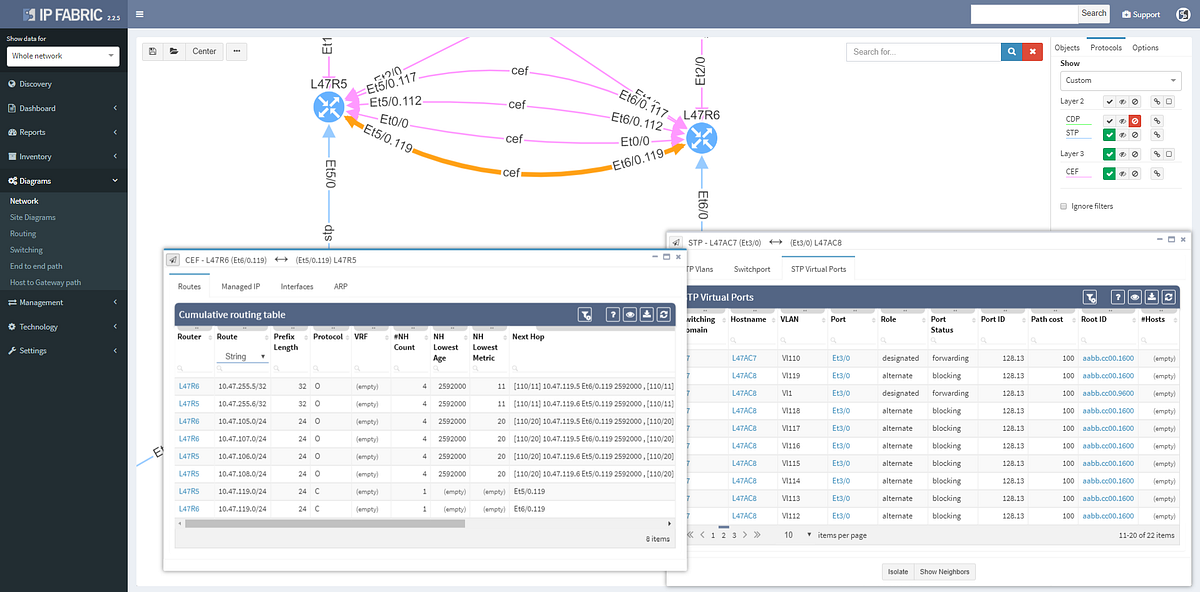
Or routes and for the routed links
Switching tab to the Managed IP on the routed link shows active IP addresses on both sides of that link.
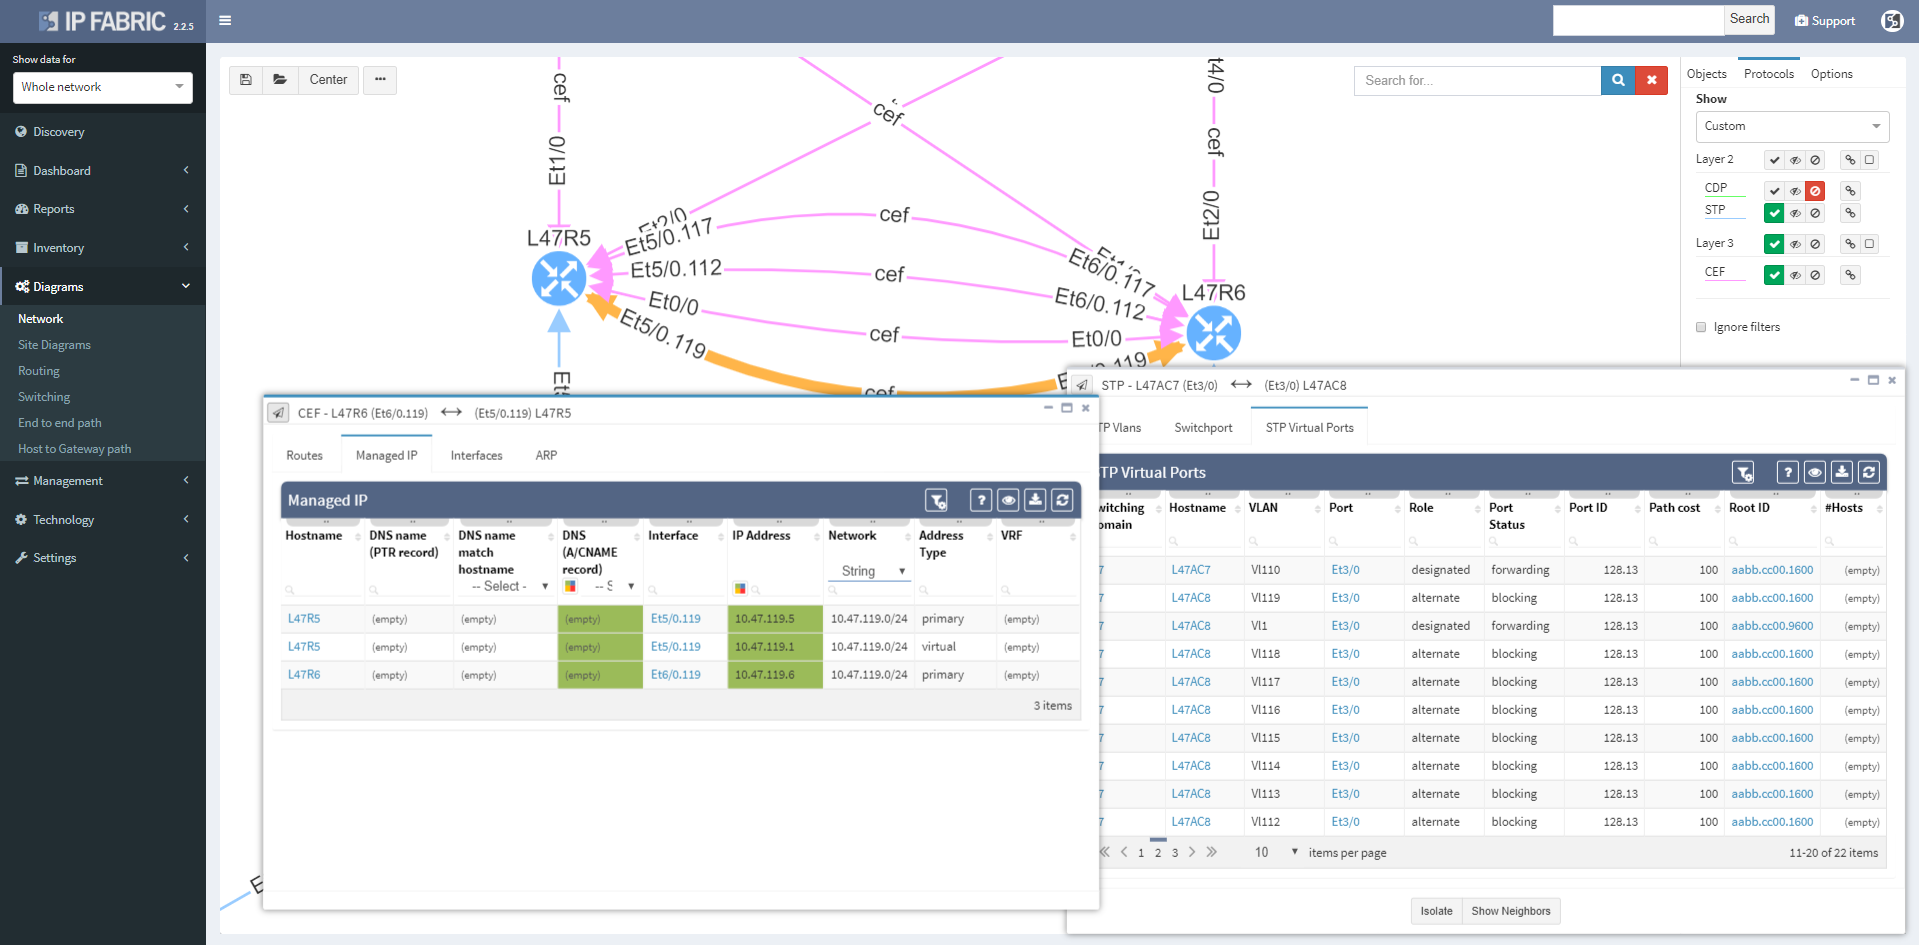
More time can now be spent in network diagrams and going through the detail without leaving the diagrams by managing tooltip windows. These can be resized, moved, or minimized as needed, and can be referred to later by clicking on the window icon in the bottom right corner of the browser window.

We haven’t focused exclusively on the diagrams, and the Discovery interface has been improved to include information about encountered errors during parsing of device output, grouping issues by error types and enabling to click through to specific output that caused a problem for IP Fabric. This enables to quickly spot issues such as missing authorization for a specific command, or inappropriate timeouts for very long command outputs.
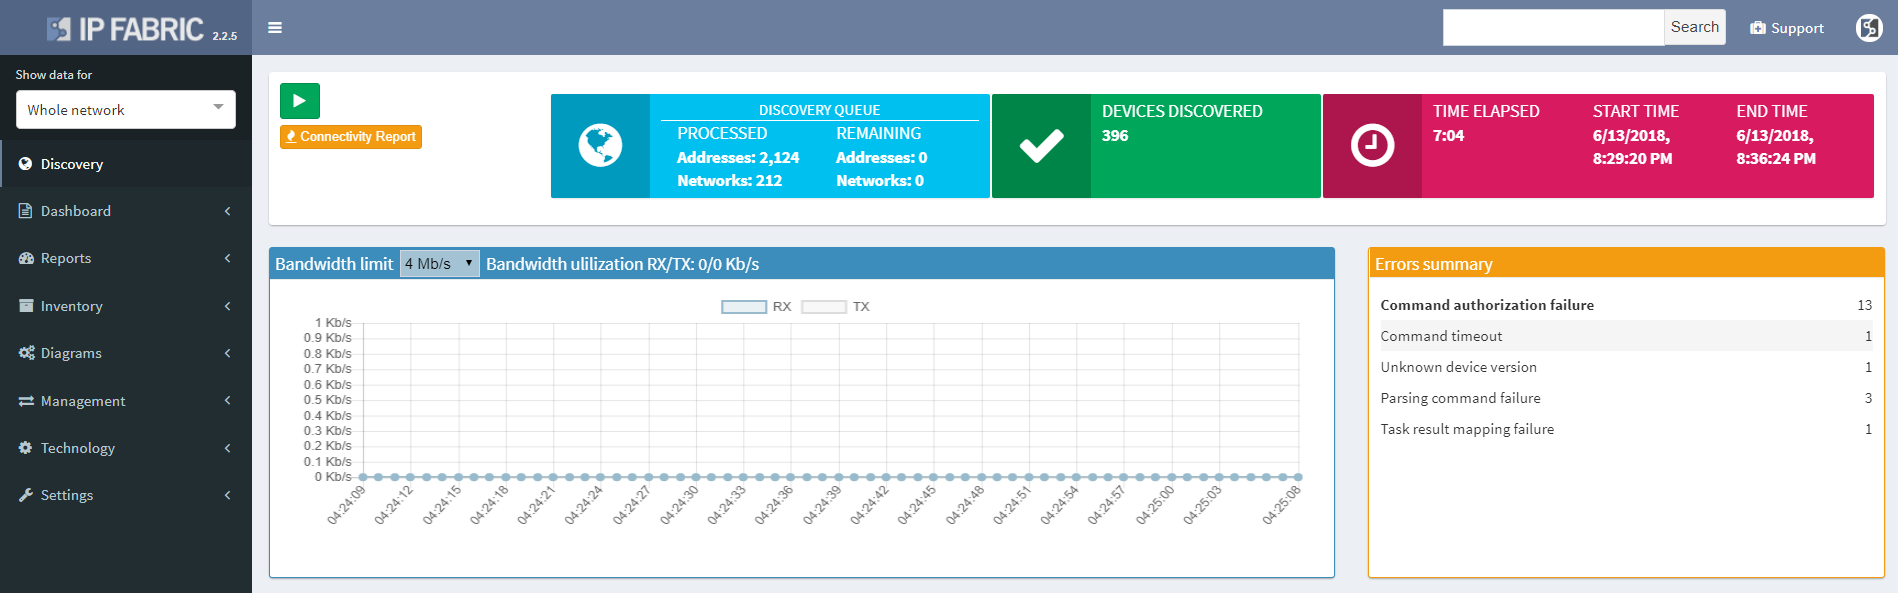
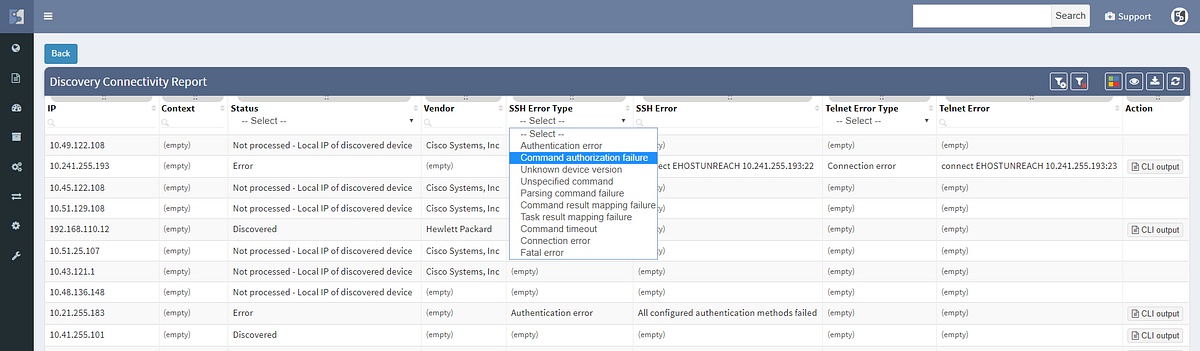
The discovery connectivity report itself has also been improved to include not only successful and failed attempts, but also skipped attempts when an IP in queue was found to be belonging to one of the discovered devices, or halted attempts when device being discovered was found to be discovered in parallel by another process (simultaneous duplicate discovery). A complete CLI output log is also available for each attempt.
If you’re interested in learning more about how IP Fabric’s platform can help you with analytics or intended network behavior reporting, contact us through our website, request a demo, follow this blog or sign up for our webinars.
If a user reports that a certain application is not working for them, especially after a migration or a change, how do you verify the connectivity?
Finding a path in a complex network can be hard enough by itself, having to map active switching and routing forwarding and balancing decisions, but additionally mapping security decisions of all the L2 and L3 filters take days if the network is complex enough, especially if multiple Zone Based firewall clusters are involved.
In this example we’ll see how IP Fabric can help you with a migration of a warehouse telemetry app that is publishing data from sensors to the secured servers from one port to another, verifying all forwarding parameters of end to end connectivity.
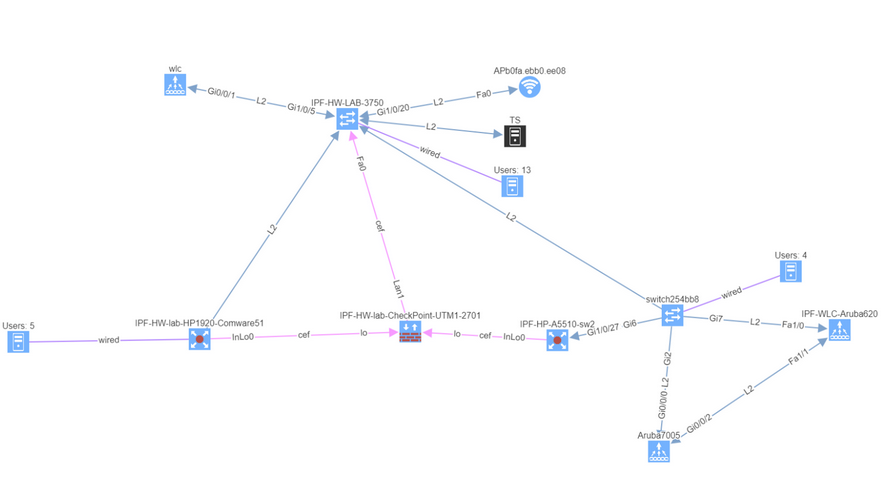
We can find the telemetry endpoints by looking at the network map of the warehouse.
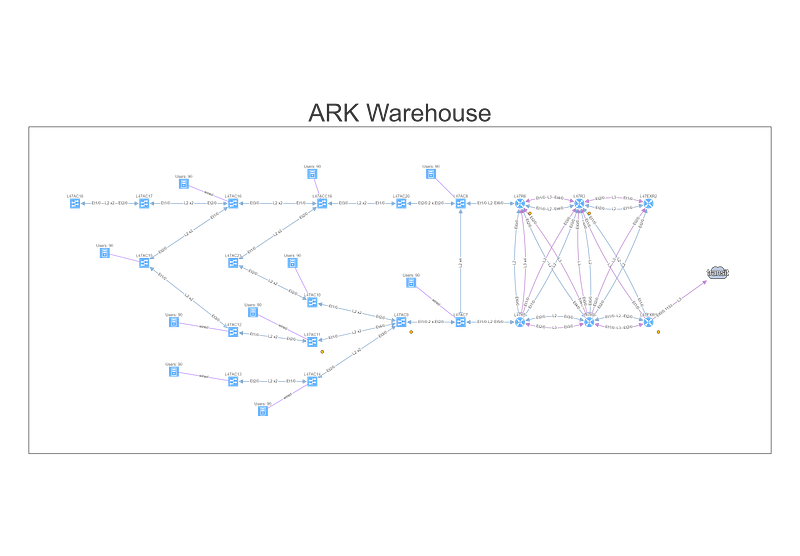
To understand topology better we can see where the site is connected to the transit, group forwarding topology into layer 3 and layer 2 islands, and then finding a specific endpoint connected to a switch that is far from the site’s edge, and using it in the End to End path lookup dialog window.
Alternatively, we can simply type part of the DNS name or an address, and find endpoint that way, which we’ll do for the server.
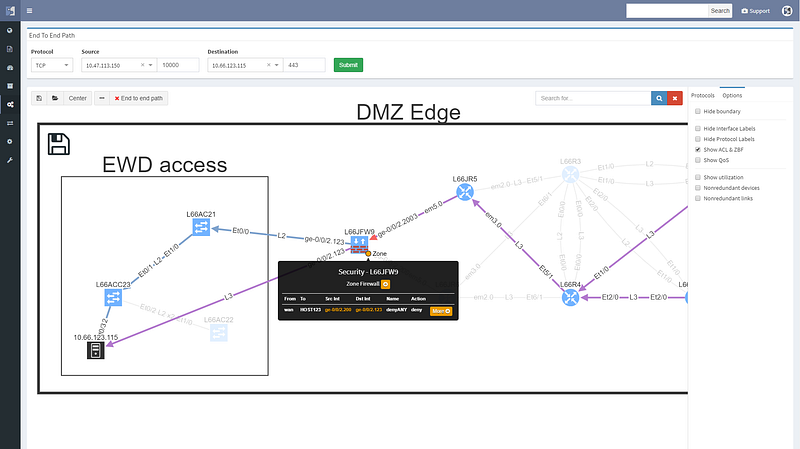
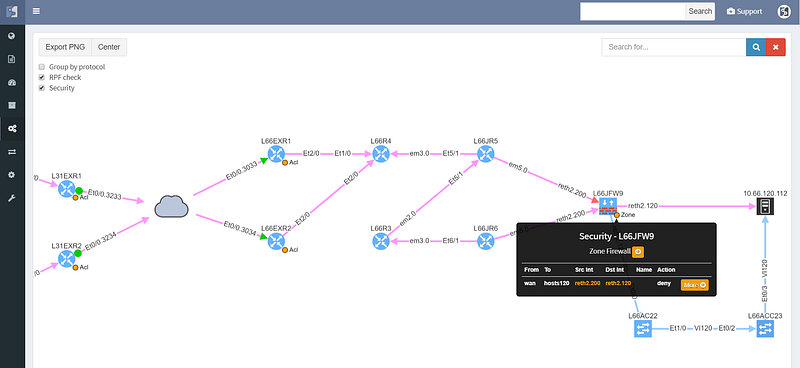
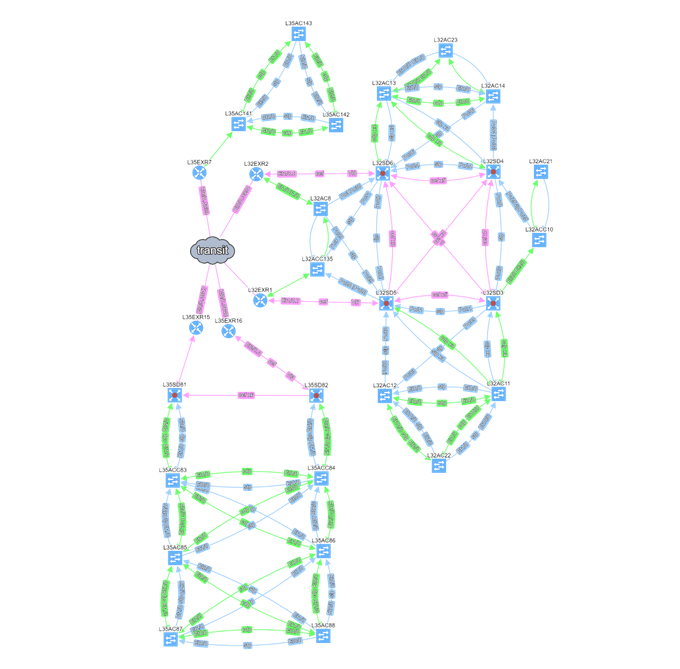
Looking at the path reveals a number of balancing and filtering decisions of interest, including layer 2 filters, wan edge filters, missing path redundancy within the site, and the filter on the Zone based firewall cluster.
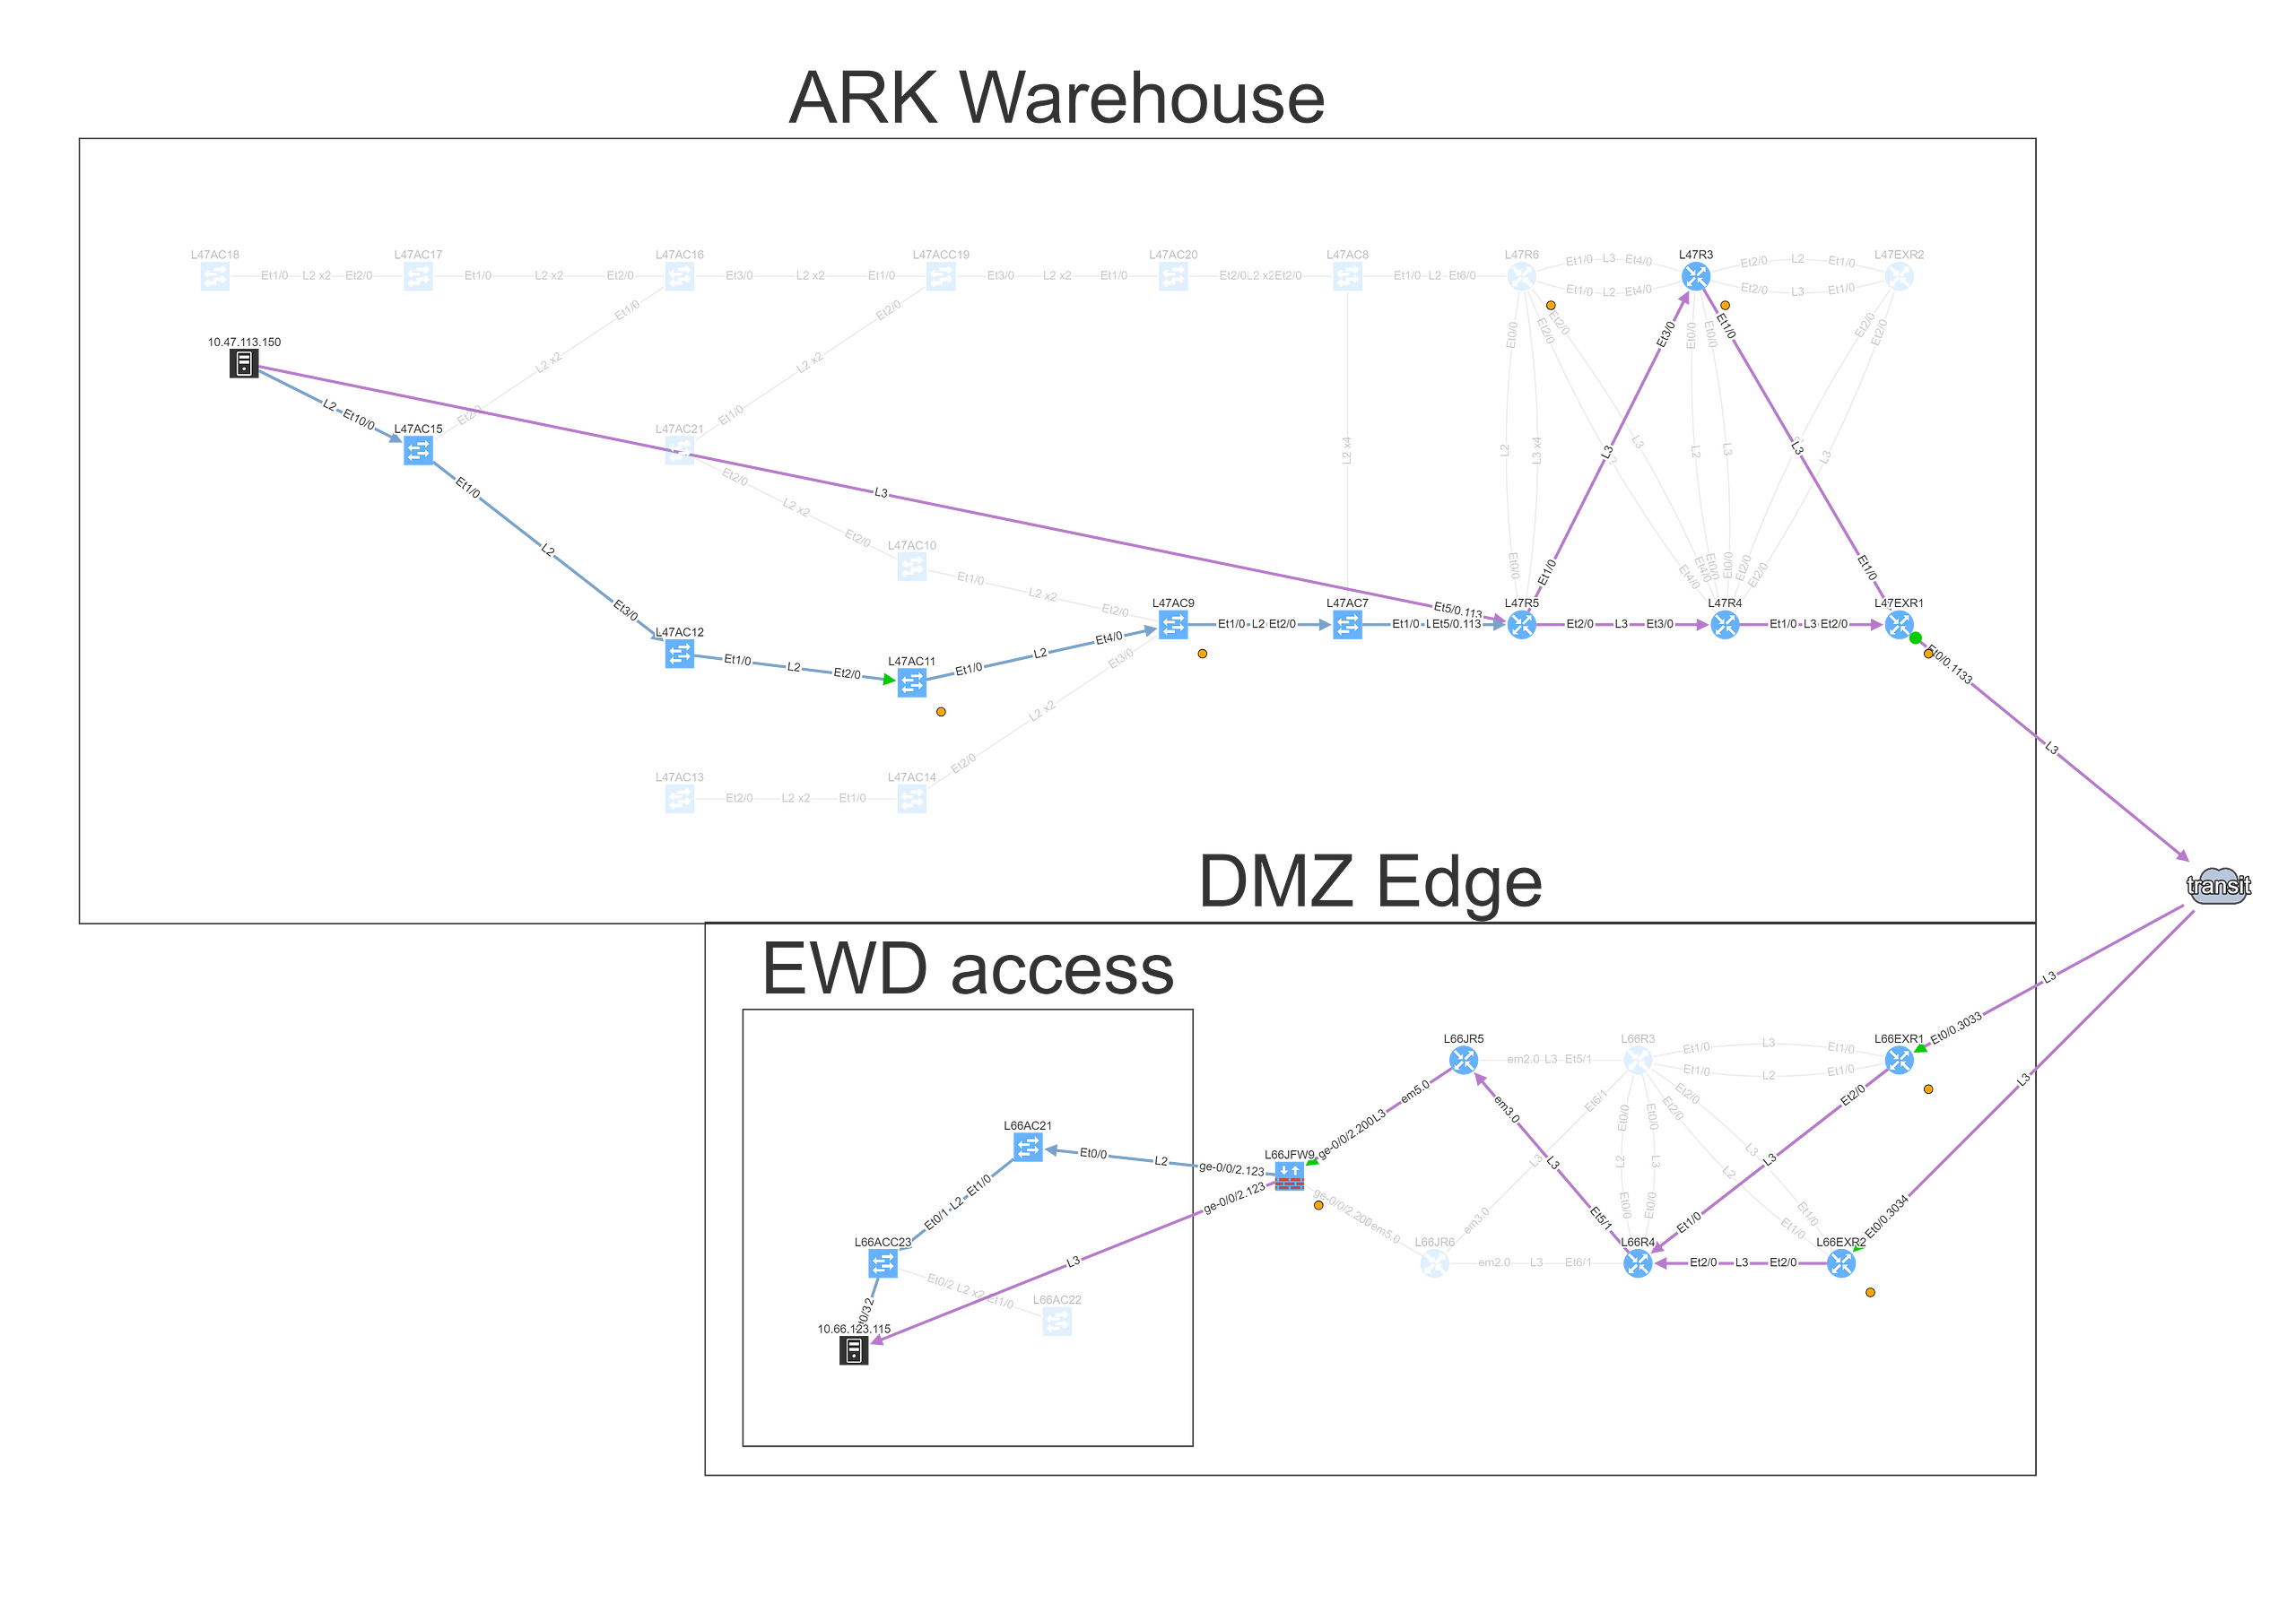
We can see that this particular flow would be allowed signified by the green arrow, and the matching decision at every point can be drilled down to reveal the detail of the policy.
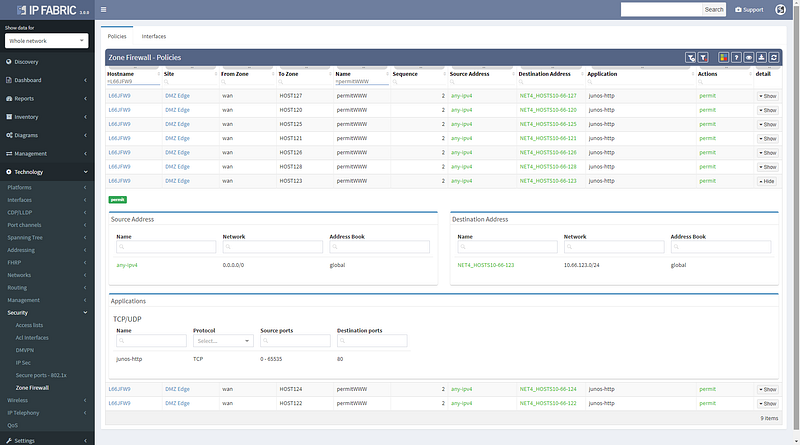
Changing the port to 443 reveals that this traffic would not be allowed, and connectivity would not be possible, so policy on the firewall will need to be updated for the migration.
We can save path lookup result to refer to later or share with the team, and export the image for reporting purposes.
If you’re interested in learning more about how IP Fabric’s platform can help you with analytics or intended network behavior reporting, contact us through our website, request a demo, follow this blog or sign up for our webinars.
Today we’re announcing the release of IP Fabric 2.2.4. A network security oriented release, the new version enables you to troubleshoot the paths through firewall clusters, to have deeper insights into routing convergence and redundancy, or to prepare or verify migration changes to 802.1X among other enhancements.
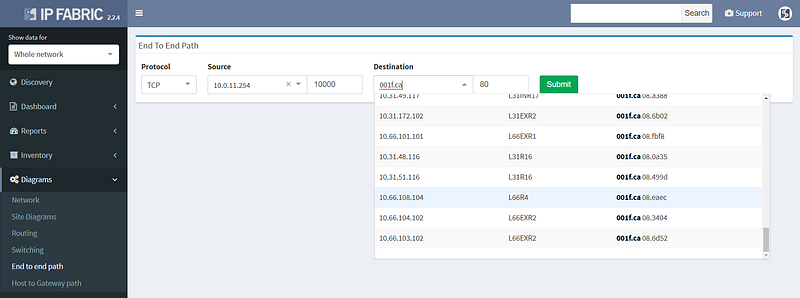
We’ve started by improving the user interface to End to End path lookup, simplifying to the usual combo of source and destination parameters. Typing hostname or IP or MAC address into the source or destination fields looks up the endpoint as you type, greatly simplifying the experience while keeping the most frequently used endpoint identification parameters. The previous lookup tables were much richer in information, but practically the additional information was more related to host location than end to end paths, and therefore seldom used.
Simplifying the user interface was necessary to add L4 parameters of protocol and port, which are now used to calculate the resulting security decision though all of the access-lists or zone-based firewalls on the path. This enables to better troubleshoot complex paths throughout the network. For example, when a user reports that they are not able to access an app on a specific port, you can instantly check if they are allowed to access an app in the first place, and how all do possible paths look like from source to destination, including whether might be an issue with load balancing or missing path symmetry. Of course, to be able to do that, we have to have not only model of routing, but also of traffic filtering mechanisms. These have now been expanded to support zone-based firewalls and clusters.
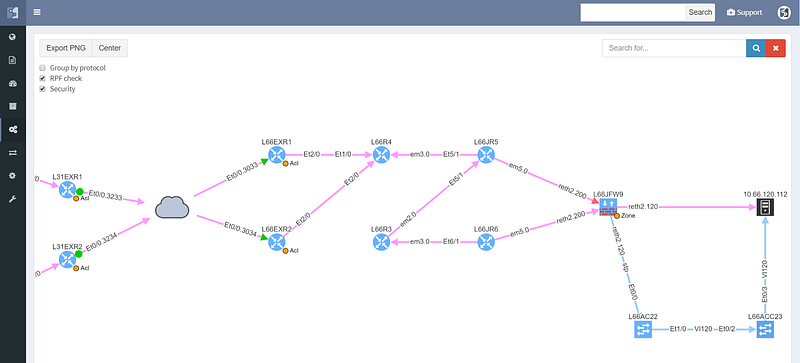
The cloud represents transit outside of administrative domain, such as MPLS carrier or DMVPN, usually a WAN. There is a missing path towards R3, and weird routing going on at R6 that should also be looked at. The WAN routers have egress and ingress filtering on the path that is permitting the communication (green color), however the cluster itself is dropping the packets (red color), so while the routed and switched path is built correctly, the traffic from this particular source/destination combination will never reach it’s destination.
Security rules for path visualization enable drill-down to the zone firewall policy details

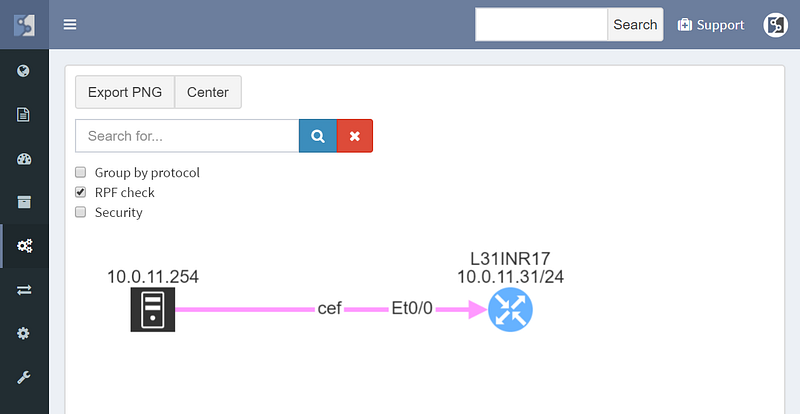
Path lookup was quite useful even in preparation of this demo. The connectivity to the end hosts wasn’t working, and the traceroutes from various points seemed to end in the MPLS cloud. Plotting the end to end path in IP Fabric immediately showed that the route at the source is missing, since the path stopped on the ingress router.
From there it was a matter of checking the cumulative routing table using routing lookup for the particular destination, which showed that no BGP routes can route these prefixes.
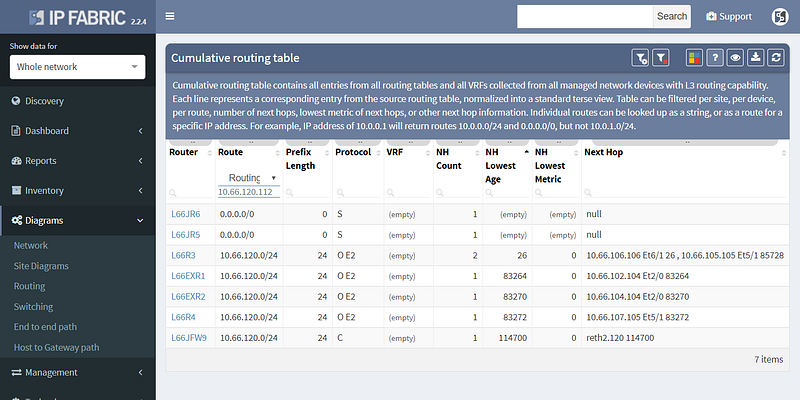
This pinpointed the problem to redistribution, since IGP had the route and BGP didn’t, and led to a quick fix.
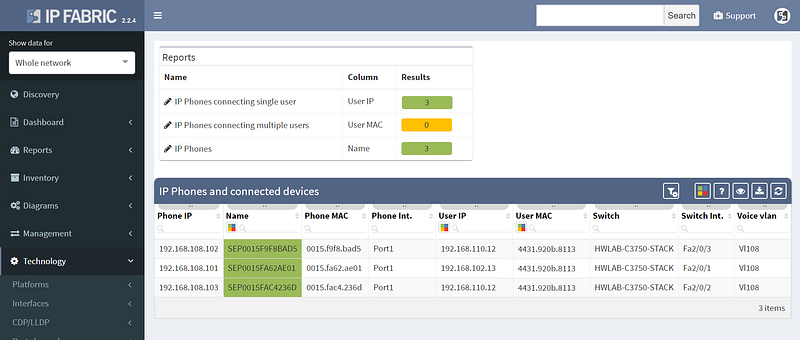
Other improvements in this release include improved 802.1x analytics, addition of STP guard tables, and usability improvements such as DNS resolution for hosts and voice VLANs for IP Phones.
However not all of the improvements were aimed squarely at analytics, as we’ve also added support for LDAP authentication to the platform, so you won’t have to remember the additional password.
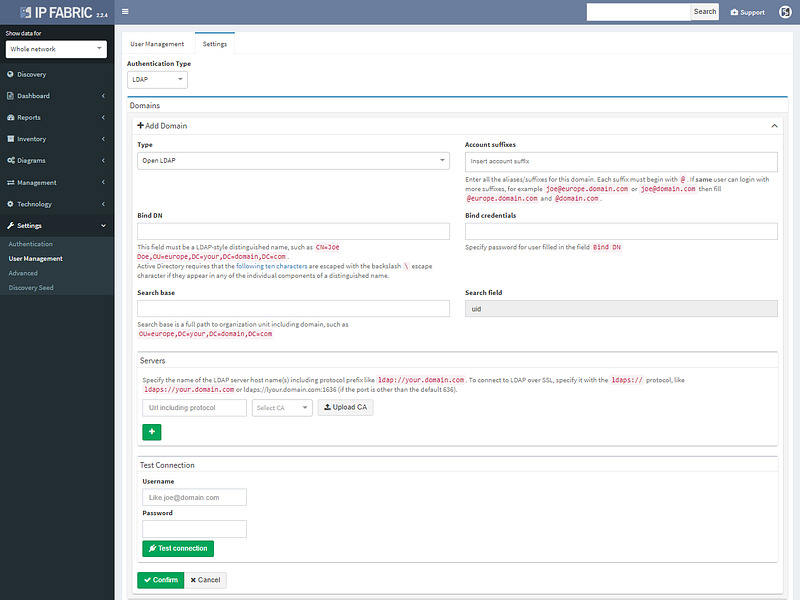
LDAP authentication supports Open LDAP or Microsoft AD.
We’ve also added restrictions per subnet for authentication credentials, so they can be specified more granularity for extensive administrative domains. The full list of changes is in the release notes at https://docs.wordpress-625423-2416527.cloudwaysapps.com/releasenotes.html. If you have IP Fabric installed, you can perform online or offline upgrade through the administrative interface following the guide.
If you’re interested in learning more about how IP Fabric’s platform can help you with analytics or intended network behavior reporting, contact us through our website, request a demo, follow this blog or sign up for our webinars.
Enterprise networks should never have Single Points of Failure (a.k.a SPOF) in their daily operation. SPOF in general is an element in a system which, if stopped, causes the whole system to stop.
Single failure (or maintenance or misconfiguration) of any network device or link should never put a network down and require manual intervention. Network architects know this rule and design the networks like that — placing redundant/backup devices and links which can take over all functions if the primary device/link fails.
But the reality is not always pleasant, and today’s operational networks can include SPOFs without anyone explicitly knowing. The reason is that even though the original design put all SPOFs away, the network may have evolved in the meantime, and new infrastructure may have been connected to it.
For example:
Part of the network operation activities should take into account that SPOFs may appear unexpectedly. This require advanced skills and lot of time to go trough routine settings and outputs if the networks is still resilient and high available. It also requires expensive disaster-recovery exercises to be performed regularly.
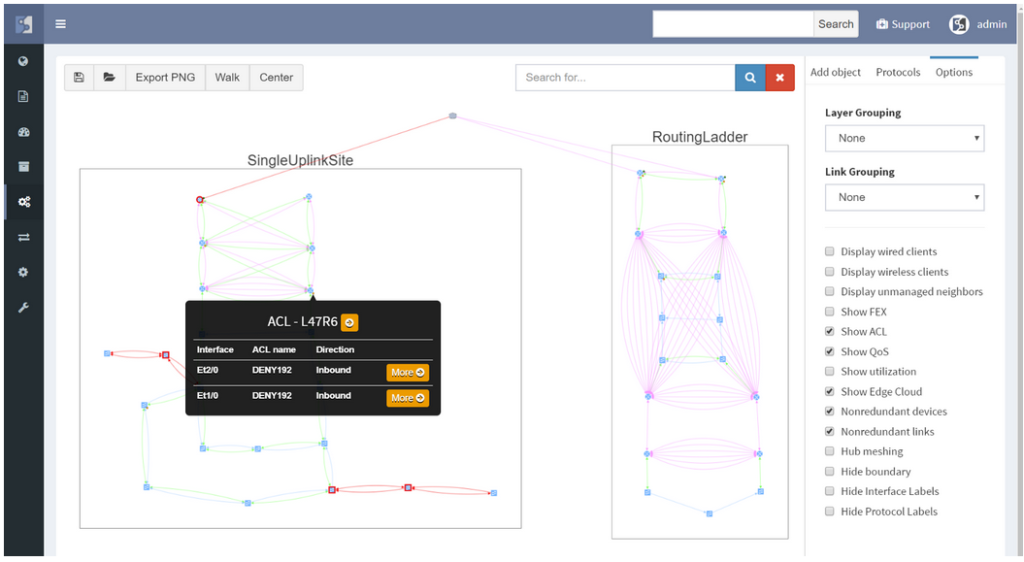
IP Fabric helps with finding of non-redundant links and devices in the network in its diagrams section.
It does not matter if the SPOF is Layer 2 switch or Layer 3 router — those are all in the critical chain of application uptime. Device and links which form SPOF will be highlighted.
Additionally, networks with many small sites have automatic grouping of small sites into redundant and non-redundant groups in IP Fabric. Groups allow to easily spot sites with non-redundant transit connectivity.
If you’re interested in learning more about how IP Fabric’s platform can help you with analytics or intended network behavior reporting, contact us through our website, request a demo, follow this blog or sign up for our webinars.
I’m pleased to announce the release of IP Fabric® Platform 2.2. Continuing our mission of delivering more capabilities into the hands of the network engineers, this major release exposes all predefined verification checks and enables to edit them or to define your own. Each technology verification can also be added to the dashboard, which is now fully customizable.
We’ve also revamped our diagrams to handle much larger scale, visualizing thousands of network devices and links on modest client hardware, and added many visualization options.
Version 2.2. also adds support for Junipers routers, switches, and firewalls, and base support for Fortinet FortiGate and Palo Alto.
We also haven’t forgotten about improving system administration, and this release has added options for encrypted backups and automatic updates.
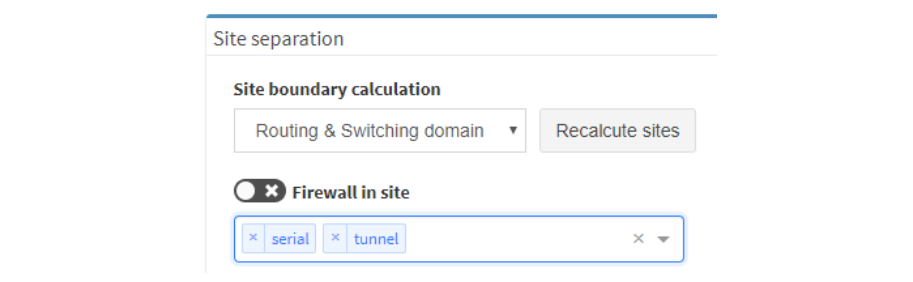
There were many other smaller enhancements such as the ability to recalculate site boundaries without running discovery, and the ability to use multiple nested regular expressions to separate sites based on the naming convention. I especially like that site recalculation also recreates all of the documentation according to the new separation rules, so even historical documentation can be updated.
As always, if you’re interested to know more, you can always drop me a line or request a demo or trial.
Network engineer/architect can use diagrams to speed up many of his routine tasks — from overview presentation of the network to the detailed troubleshooting of faulty data flow from the client to server. But regardless of the task type, there is always a requirement that the diagram uses the same “language” as other people do when depicting the network. It means that the diagrams follow:
If those requirements are not met, then the mental capacity of the viewer is consumed by mapping names and device positions from the generated diagram to the concept that he is familiar with. The layout can be adjusted for one time and the sites renamed but if next network discovery forgets those adjustments, it is pointless to do so.
The IP Fabric platform offers to assign any name to any location that it discovered and this name will stay the same even if the network is rediscovered again. Position of the devices in the diagram can be freely adjusted according to engineer or organization customs (ie. somebody prefers to have users on top, somebody on the bottom. Somebody prefers to place core devices in the center of the diagram, somebody creates a separate block, etc.).
The final layout is saved and is thus persistent regardless of how many times the network is rediscovered. If something changes in the network, then it is reflected in the new diagram. But the global layout remains in the form which is well understood by all people around the network and most importantly by the network engineers/architects — without wasting their modeling effort put into the first diagram.
If you have found this article resourceful, please follow our company’s LinkedIn or Blog, where there will be more content emerging. Furthermore, if you would like to test our platform to observe how it can assist you in more efficiently managing your network, please write us through our web page www.ipfabric.io
The best way to get a quick overview of any network infrastructure is by viewing a diagram (or most likely set of diagrams). The human brain can receive essential information much faster when represented in graphical form. The downside is that manually creating a diagram can take a long time. And keeping a big bunch of diagrams up-to-date is not an attractive task for most of the people.
Network design documents usually include various diagrams (at least one diagram depicting physical infrastructure and at least one diagram depicting logical scheme where the data flows should go). When the design is implemented and routinely operated, the network usually undergoes through many changes as the new requirements approach. Thus design documents provide only a basic clue for everyday network operation such as:
· What is the exact connection at a specific point?
· How many of intermediate devices the data have to cross to reach the destination?
· What is the redundancy/failover mechanism and what is its actual state?
· How many other branch networks are dependent on this network site?
· Which routing mechanism and actual routing decisions apply for the data flows?
· Where in the network is the network security enforced and what is the outcome of it?
To get the answers quickly, diagrams must be kept up-to-date. If the network is large, the set or complete hierarchy of diagrams must be maintained to keep the readability at an acceptable level. The links and relations between the diagrams can slow down navigation among them — most likely when the issue span several regions in the network. And it is not always easy to find the level of detail and scope of the information included on a specific diagram — some information may be missing when troubleshooting and some information can be superfluous and thus confusing when looking for the big overview picture of the network.
Increasing the use of virtual environments with virtual links and devices brings another level of complexity when describing and understanding the network infrastructure. Logically independent entities which share some computing resources may have a different impact on network than if they were physically independent. Diagrams help here but different views of the same entities are required.
The IP Fabric platform copes with the issues mentioned above by introducing Dynamic Diagrams. Those are dynamic in two ways:
1. They are built automatically according to the current network state without the need to update them manually
2. They are viewed with real-time customization of displayed attributes reflecting the actual needs of a viewer
One can easily click through the Ip Fabric platform network diagrams from one end of the network to another or from core to the last edge level of the hierarchy.
The diagram can be quickly transformed from physical-like view with plain L1/L2 neighbor relations to any level of logical view with L2 switching or L3 routing info — thus effectively stopping the need for keeping many sets of diagrams describing the same entities, just with a different point of view.
If you have found this article resourceful, please follow our company’s LinkedIn or Blog, where there will be more content emerging. Furthermore, if you would like to test our platform to observe how it can assist you in more efficiently managing your network, please write us through our web page www.ipfabric.io
Large enterprise networks are constantly changing. Even if no administrative or configuration change activity is planned, the network lives by itself — the devices and links are going up/down and the network protocols are changing their states. How can you find unwanted changes as soon as possible?
The main goal in reactive network troubleshooting is to find the causality chain between the network problem (consequence) and network change (cause, often innocent) that happened beforehand. The change affected some components of the network which affected other components…and led to network problem at the end as a final consequence. Change visibility helps in proactive network analysis as well — some changes may not be visible to users yet, but the network administrator can see that problem may appear soon.
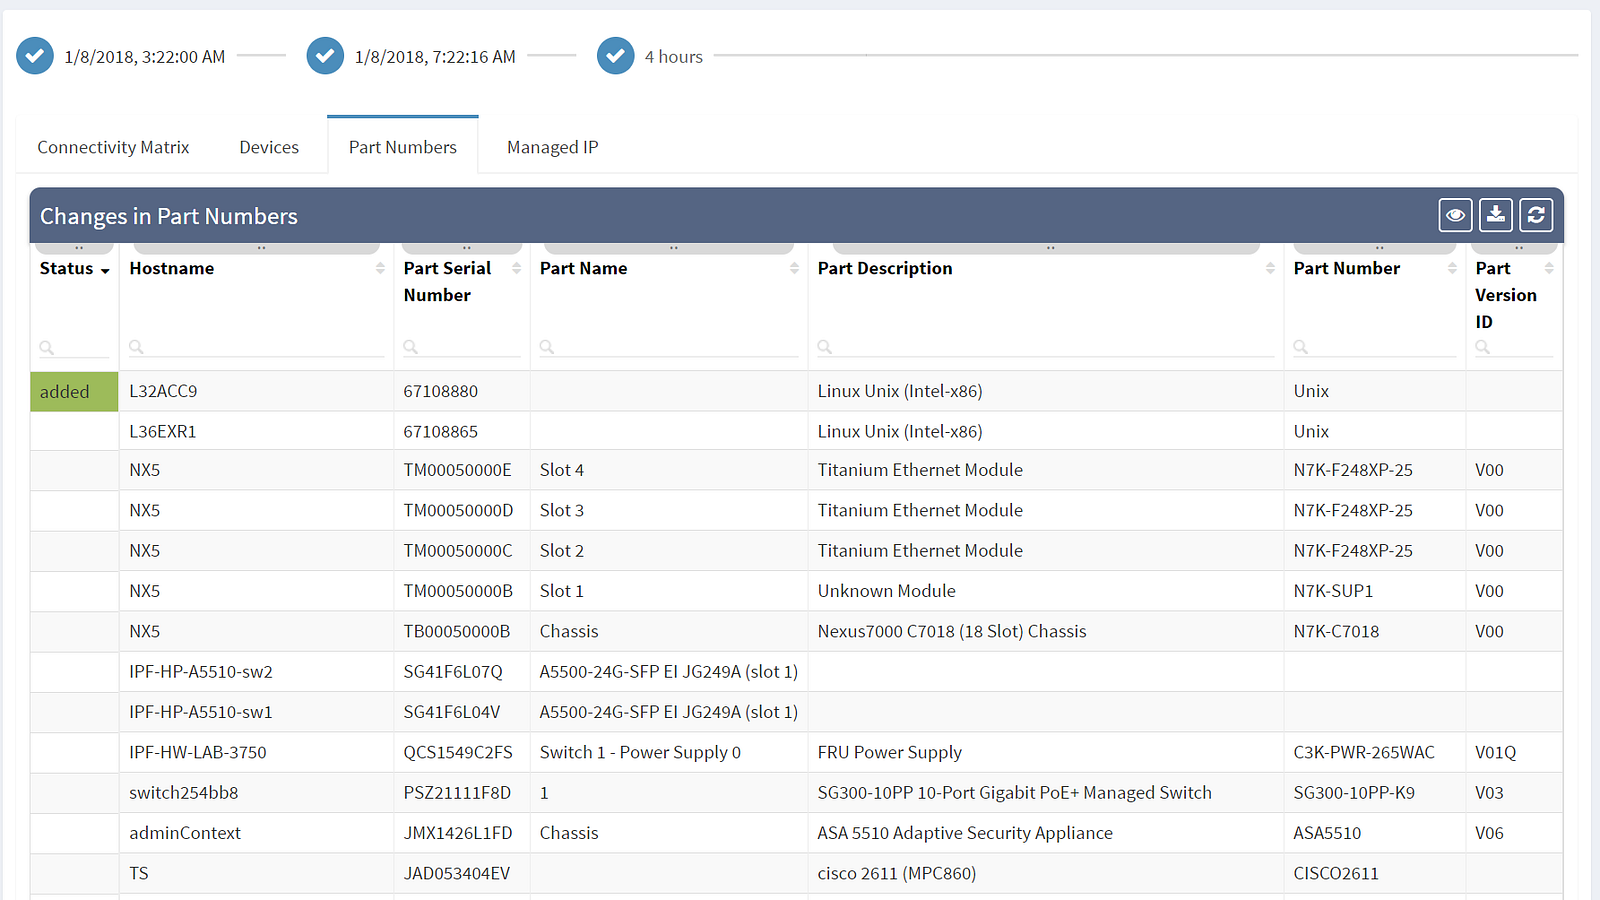
Thus the common question of a network engineer is: What has changed in the network since last time I was inspecting the network? Which device (or its component such as line cards, power supply, one of its transceivers…) was removed from the network? Which new device was added to the network? Which IP address changed its location or type? Which links were changed in the network? Is there a new protocol adjacency for STP? Is there different IP next-hop for a given destination (both indicating logical topology change)?
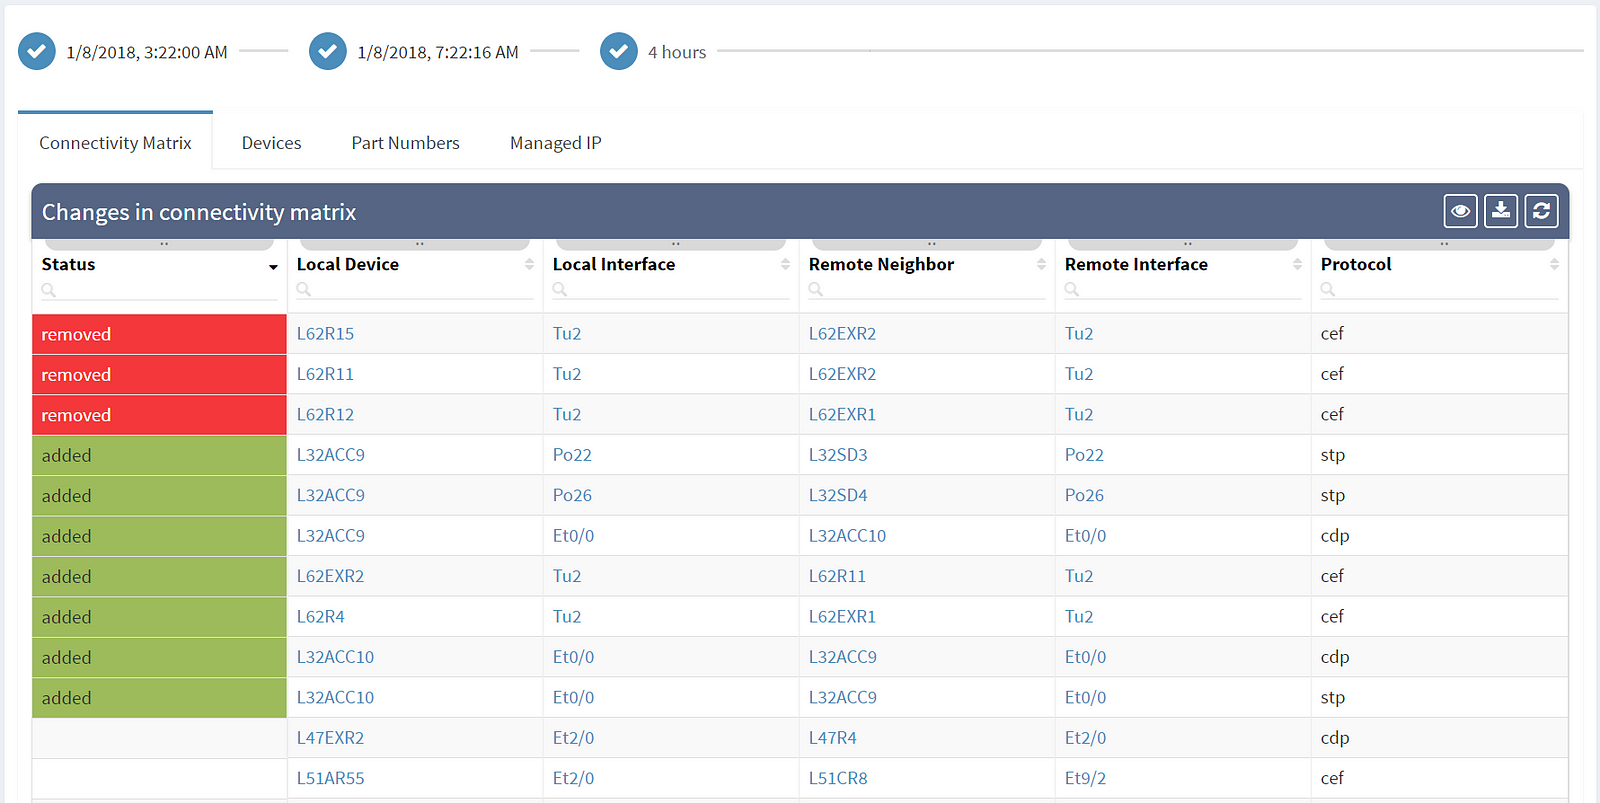
The first column shows the actual status — removed entities are in red, newly added entities are in green and the rest shows unchanged elements. Among the most common attributes displayed are the OS version (which should be as uniform as possible) and the serial number of the element (which if changed indicate HW replacement).
Are you interested to see all of IP Fabric's powerful features? Sign up for a trial or an online demo.
There should be minimal changes in the layer 2 switching operations — the switching topology should be constant and the number of MAC address moves minimally.
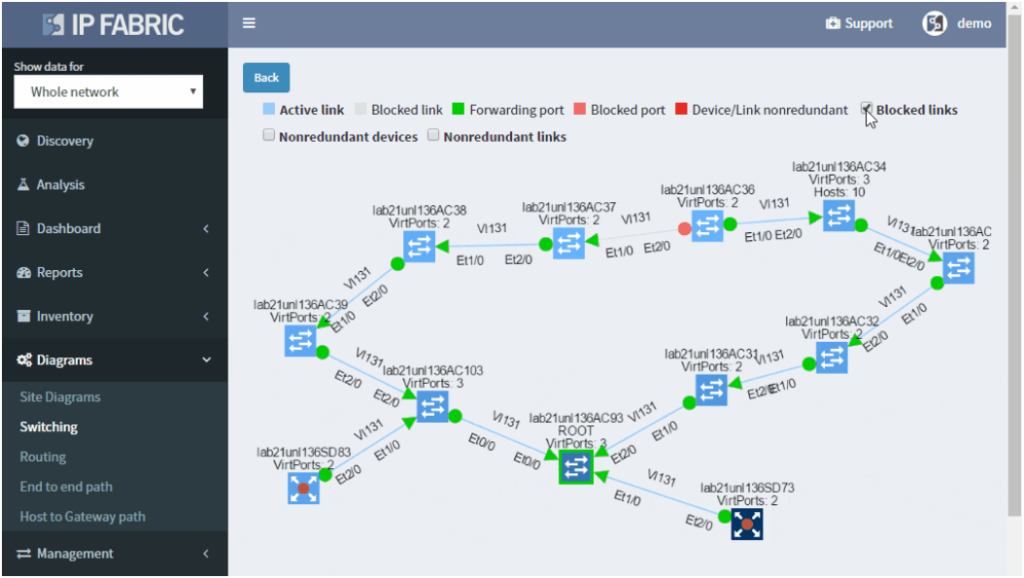
How do you know that the switching domain is not re-converging every minute or two due to STP issues?
Many problems in the current Ethernet layer 2 switched networks can come as a result of the behavior of the Spanning Tree Protocol and its derivatives. Its fail-open nature can render large parts of the network belonging to the same switching domain unusable. There are hints in STP operation before the major disruption happens which could be used as early warnings.
A number of topology changes, number of MAC address moves, STP diameter size, per VLAN root switch assignment, virtual port numbers and other operational values — if those will find a way to network engineer, they can mitigate the issue before the switching domain goes down completely. However, it is not exactly easy to routinely gather and process detailed Spanning Tree Protocol outputs to see if something out of ordinary is starting to happen.
The IP Fabric platform collects STP data and processes those into various statistics which provide immediate guidance to network engineers, such as that the network is re-converging too frequently, or that the root bridge uses default priority value, or that the STP topology includes more switches than recommended by best practices.
Detailed Spanning Tree analytics in the IP Fabric platform help engineers to investigate what could be wrong with the L2 switching domain, what could be fixed or changed, and help with the change procedure, such as switching to a newer derivative of the Spanning Tree protocol.
If you’re interested to see how the IP Fabric platform can help you to keep L2 switching domain stable, contact us for an online demo or a trial in your network. Also, we’re hiring!


