Network teams, deeply engaged with the daily changes and mechanisms of their unique network, understand the general state at a given point in time - especially if they have the right visibility tools in place!
However, the network underpins the entire business, and thus network state is relevant across the organization, not just to network teams. There is, in particular, a need to understand how the network state affects outcomes - the risk and impact of the network state on users and applications is vital business information.
Business leaders and adjacent teams (for example, security or operations) acknowledging the relevance of the network begets the need for clear, condensed, and relevant network reports.
Simply put, if something is going on in the network, what impact does it have on my job and the work I need to do?
These users won't necessarily have the same requirements of network reports as network engineers (nor will they understand the intricacies of specific network tech) so simply passing on large amounts of network data isn't an actionable solution.
This means engineers have to spend time understanding the requirements of different users with different perspectives and priorities, and manually collate and correlate different inputs from the network. And after all that effort, these ad-hoc reporting solutions might still not meet these requirements, or be something that you can replicate regularly.
This mismatch of expectations and needs results in frustrating bottlenecks and friction between teams, not to mention the time and focus dedicated to translating specific network information to satisfy requests from different teams.
IP Fabric solves this frustration by automatically generating a network-wide analysis report of your network at a specific point in time, providing an invaluable resource to respond quickly and accurately to these requests for information.
This report includes summary information and perceived risks that may affect outcomes in a digestible format. Best of all, this is instantly accessible with a click, with no manual inputs needed. See the 6-second process here:
The cost and time of doing this manually would mean you can't just create these reports whenever you want. With a dynamic enterprise-scale network, regular reporting is crucial to ensure your understanding of the network is up to date so you can make well-informed decisions.
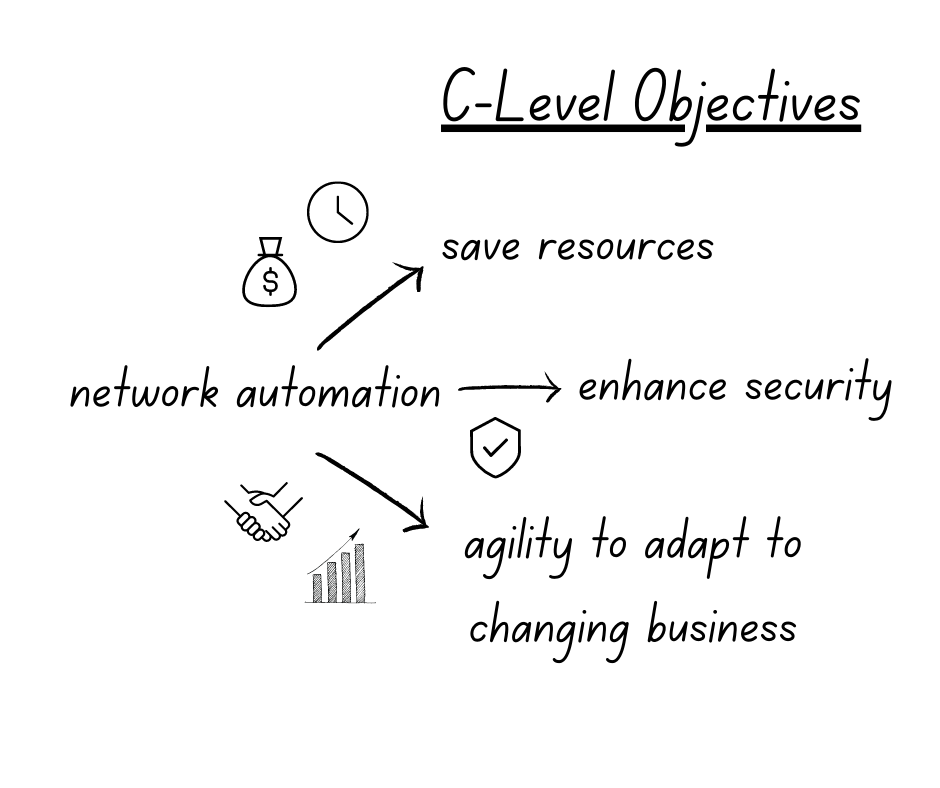
It's quite easy for network professionals to understand the benefits of automating network operations, such as reducing manual errors and saving time, which provides tactical wins that quickly improve day-to-day operations. Yes, there is still distrust of automated processes, but with more discussion around how to properly de-risk and assure network automation (see, Jeremy Schulman's recent NANOG presentation), the switched-on network engineer of today understands the potential of automation and the importance of exploring and implementing it properly. Or at least, should be curious about what automation could do for them and their team and want to try it out in their network environment.
However, frustratingly, convincing leadership to invest in network automation can be challenging. They may be too removed from operations to properly see the business benefits, too risk averse, or stuck in a mindset that begets stagnation. As Itential's Kristen Rachels recently pointed out, the "biggest inhibitors to maximizing the business benefit of automation were not technical, they were cultural and organizational."
Individual-led automation efforts can be risky without proper buy-in, resulting in inefficiencies, errors, security risks, and team conflicts due to incomplete or inconsistent automation processes. Enterprises must prioritize network automation as a strategic business initiative that deserves the necessary resources and attention to ensure success.
And the fun part? If you're the one who understands this need, it’s on your shoulders to convince leadership that this should be a business priority, and not performed in isolated pockets. Advocating for the best solution can be uncomfortable when an organization is comfortable with the old way of solving problems. To overcome this, framing network automation as a business strategy is key. While a network team frustrated by out-of-date or incomplete documentation sounds like your problem, a user-impacting network outage because of a lack of insight into the network is everyone's problem.
One of the most compelling arguments for automation, of course, is its impact on the bottom line. Significantly reducing manual errors and repetitive tasks, and increasing operational efficiency and productivity translates into substantial time and cost savings for your organization. Network engineers can focus on higher-value tasks, while automation takes care of routine operations. Automation prevents enterprises from misusing their most valuable resource - top talent - on repeatable tasks.
Additionally, automation minimizes the risk of human errors that can result in network outages or downtime, which can result in expensive lost revenue and customer dissatisfaction. On the higher end, the cost of downtime can hit $9000 per minute. When presenting a business case for automation to your boss, emphasize the tangible cost savings and increased productivity that automation can bring to your organization.
In today's ever-evolving threat landscape, network security should be a top priority for organizations. Automation can play a pivotal role in enhancing network security. By automating security processes such as patch management, configuration audits, and threat detection, you can ensure consistent security policies across your network and reduce the risk of human error. Automation also enables rapid response to security incidents, allowing for quicker detection and remediation of security threats. With automated security processes in place, you can strengthen your network's defenses and reduce the risk of security breaches, which can have severe financial, reputational, and legal consequences for your organization. Highlight how automation can bolster your organization's security posture when making a business case for automation to your boss.
Network assurance is a key part of this, and anyone looking into methods of automating their network security should take note of how network assurance can help prevent cybercrime.
Business is fast-paced, and organizations need networks that are agile and scalable to keep up with changing requirements. Automation can help achieve this agility and scalability. By automating network provisioning, configuration management, and deployment of new services, you can accelerate network changes and ensure consistency across your network infrastructure. This allows your organization to respond quickly to changing business needs, such as adding new branches, deploying new applications, or scaling up network capacity.
Automation also enables network engineers to test and validate changes in a controlled environment, reducing the risk of network disruptions. Emphasize the importance of agility and scalability in the modern business landscape and how automation can enable your organization to stay ahead of the competition when presenting a business case for automation to your boss.
S&P Global saw the value of this when faced with a huge merger - here, Guruprasad Ramamoorthy, Global Head of Network Architecture, Engineering, and Operations, explains how automated network diagramming and modeling helped: "We were able to quickly model the behavior that we needed to build a day 1 experience for our employees across companies working on a large and complex merger."
The bottom line
Reduce labor costs associated with firewall management by enabling engineers to work on more strategic tasks. Streamline the change management process, reducing the need for costly downtime during firewall rule updates which can result in increased productivity and revenue generation.
The secure edge
Minimize the risk of human errors resulting in misconfigurations or security vulnerabilities. Ensures the consistent enforcement of rules. Enables rapid response to emerging threats (e.g. malicious IP addresses or suspicious traffic patterns).
The agile future
When new network services are provisioned, firewall rules can be applied consistently and rapidly, regardless of environment (on-prem, cloud) or location.
The bottom line
Network engineers are highly skilled individuals who don’t generally enjoy the tedious task of updating network documentation. Their skills could be better used on strategic tasks.
New team members can understand the network quickly and bring value faster.
The secure edge
Manually updating documentation opens up an organization to a higher rate of human error and continuously out-of-date documentation. This can be dangerous when decisions need to be made quickly; teams relying on incorrect documentation may inadvertently introduce vulnerabilities into the network.
The agile future
In order to grow, or pivot a network management strategy, knowledge of the network must be accurate and easily shared. New team members need up-to-date and accurate documentation to ramp up confidently. A fully documented network makes mergers, acquisitions, migrations, and additions far simpler.
The bottom line
Key metrics like fault isolation time and Mean Time to Resolution will be lowered.
Not only does this mean less likelihood of expensive outages, but also more time for strategic tasks.
The secure edge
Incidents compromising security are solved faster. Fewer vulnerabilities in the first place thanks to consistency in security policy applications and automated updates.
The agile future
Proactive troubleshooting also means fewer network outages and more predictable business continuity as your organization grows and changes.
These are just simple examples to demonstrate how, through keeping (1) budget, (2) security, and (3) agility top of mind, you can succinctly create a compelling case for some simple automation wins that can help change the mindset of slow adopters.
An automated network assurance platform is key in providing the confidence that automation is having the desired effect. Want to try IP Fabric? Here's our free, self-guided demo. Or you can reach out to us to schedule a free tailored demo for a personalized look at network assurance to solve your specific challenges.
IP Fabric's GUI provides you with Excel-like tables for filtering and querying data, but sometimes engineers require data to be extracted for more advanced reporting or Power BI dashboards. In this blog, I will demonstrate how to directly connect IP Fabric to Microsoft Excel or Power BI without using CSV exports. This has been simplified into functions stored in template files allowing you to pull any IP Fabric table in seconds!
Documentation and template files are located in the IP Fabric Integrations GitLab.
You must have web API access to the IP Fabric server (default is port 443). If running these queries from Excel in Office 365 or Power BI in the cloud, your IP Fabric instance must be reachable from the public Internet.
Microsoft Excel and Power BI will only allow you to communicate with websites that have valid and trusted SSL certificates. The easiest solution is to install a trusted certificate on the IP Fabric server that has been signed by a CA in your Trusted Root Certification Authorities. If you are unable to create a signed certificate you are also able to use a self-signed cert and install it on your location machine. This must be done for every user/computer that will be running the Power Query and you will not be allowed to run these queries in the Cloud.
Finally, you will also need to have, or create, an API Token. This token will be saved within the file (or the data source on powerbi.com) so sharing is not recommended. We recommend either removing your personal token before sharing the file (or posting the file to a shared cloud space, i.e. SharePoint) or creating a limited read-only account and API token. If you need more information or assistance with read-only accounts and RBAC please reach out to your Solution Architect.
After opening either the Excel or Power BI template file there are two required configurations that must be done prior to accessing data. You may be required to accept some warning messages about communicating with external content prior to being able to continue.
In Excel open the Data Ribbon and click "Queries & Connections" and right-click the IPF_URL query and select edit. This will bring up the Power Query Editor where you are able to input your information. Example configuration:
12dd8c61-129c-431a-b98b-4c9211571f89If you are using Power BI when you open the template file you will be prompted with a pop-up to enter these variables. To access the Power Query Editor simply click "Transform data" in the Queries section of the Home ribbon.
Finally, you should be asked about data source settings prior to connecting, if not then select the Snapshots connection and in the Home ribbon in the Power Query Editor select select Refresh Preview. For the Credentials select Anonymous and for Privacy level either check the Ignore Privacy Levels box or select any level and press save. Once completed you should now see a table of the loaded Snapshots.
The queryIPF function simplifies the pulling of data with only one required parameter, the API endpoint of the table. This can be located by selecting the Table Description or the ? icon on any of the tables and copying the URL under the API Description. For example, I would like to pull my Inventory > Devices table into Excel.
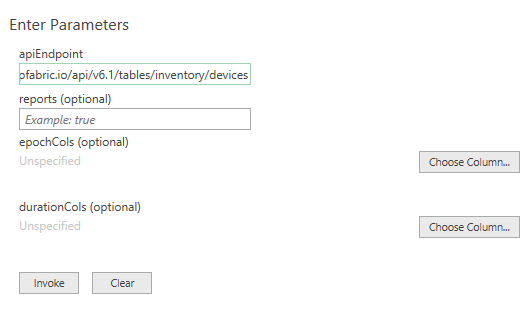
The reports variable defaults to false, setting to true will include the Intent Checks for the table if any are configured. This will be a new column named colname.severity where severity equals one of the following:
Once configured select Invoke (the epochCols and durationCols can be specified after invoking the function which will be discussed later).
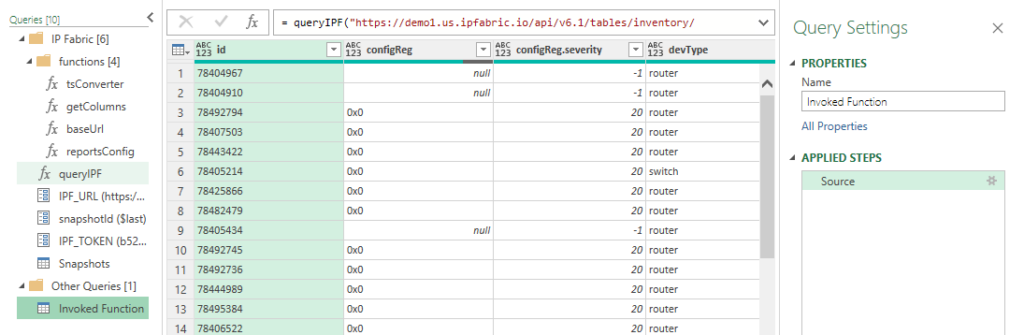
Now we have the Inventory > Devices table loaded. Changing the Properties > Name will change the Excel Worksheet name so it is recommended to update this value. In this example I specified reports=true and we can see the new configReg.severity column.
Finally, click the Home ribbon Close & Load which will update work workbook or to add more tables simply repeat this process for each table you desire! It is really that simple.
Times in IP Fabric are stored in two different formats. When you use the API you will see that an integer is returned unlike when you view it in the GUI. Let's take a look at these formats:
colnameAsDatecolnameAsTimeIn the Device Inventory, the uptime can be converted into a human-readable format in Excel. Simply change the query by adding a list and the column name.
Original:
= queryIPF("https://demo1.us.ipfabric.io/api/v6.1/tables/inventory/devices", true, null, null)
Modified:
= queryIPF("https://demo1.us.ipfabric.io/api/v6.1/tables/inventory/devices", true, null, {"uptime"})
This then converts 3435180 into 39.18:13:00 (39 days, 18 hours, 13 minutes and 0 seconds.)
Epoch example with the End of Life detail table:
= queryIPF("https://demo1.us.ipfabric.io/api/v6.1/tables/reports/eof/detail", true, {"endSale", "endMaintenance", "endSupport"}, null)
As valuable as contextualized network data is for your engineering teams, we know how insightful it can be also for adjacent teams, leadership, or third parties. Using our IP Fabric-developed Excel and Power BI template files, you can communicate directly with IP Fabric without exporting CSVs, seamlessly leveraging this data for high-level and detailed reports and presentations.
If you found this interesting and want to implement this in your environment, please look at the following quick videos for a visual demonstration and more advanced information. This includes how to work with nested objects and/or lists as well as joining tables. Reach out to your IP Fabric Solution Architect for more information or assistance!
Want to try out IP Fabric yourself? Sign up for our self-guided demo and see what automated assurance could do for your network teams.
In Part 3, we discussed using the python-ipfabric SDK to interact with IP Fabric's API - did you know that you can also use it to create diagrams using the API?
Find a coding example on GitLab at 2022-05-20-api-programmability-part-4-diagramming.
Blog post updated 2023-11-15 for ipfabric SDK version 6.5.0.
There are four options for returning data in the Diagram class.
IPFClient().diagram.png(): Returns PNG image as a bytes string.IPFClient().diagram.svg(): Returns SVG image as a bytes string.IPFClient().diagram.json(): Returns the raw JSON from IP Fabric.IPFClient().diagram.model(): Takes the raw JSON and converts it into a python object with type hints.Each of these methods has five input parameters, and only the first one is required:
This is the most basic diagram as it takes a single IP address. The imports will differ depending on the type of graph.
# 1_host2gateway.py
from os import path

from ipfabric import IPFClient
from ipfabric.diagrams import Host2GW

if __name__ == '__main__':
    ipf = IPFClient()  # IPFClient(base_url='https://demo3.ipfabric.io/', auth='token', verify=False, timeout=15)

    # Get Random Host
    host = ipf.inventory.hosts.all(filters={"ip": ["cidr", "10.35.0.0/16"]})[3]['ip']

    with open(path.join('path_lookup', '1_host2gateway.png'), 'wb') as f:
        f.write(ipf.diagram.png(Host2GW(startingPoint=host)))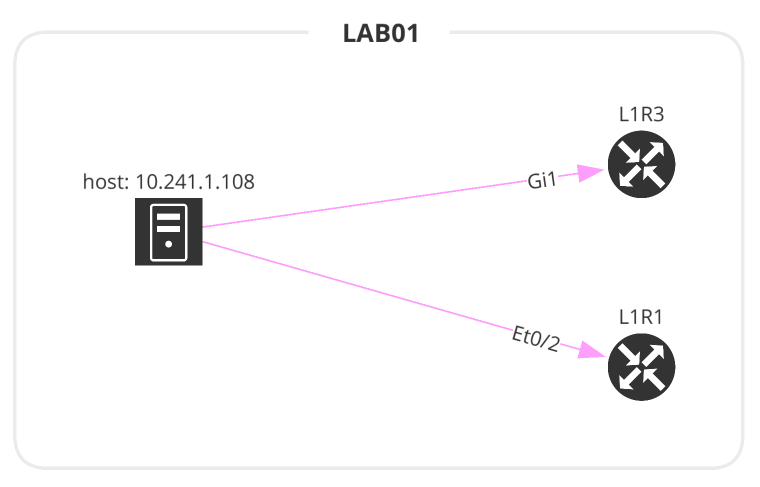
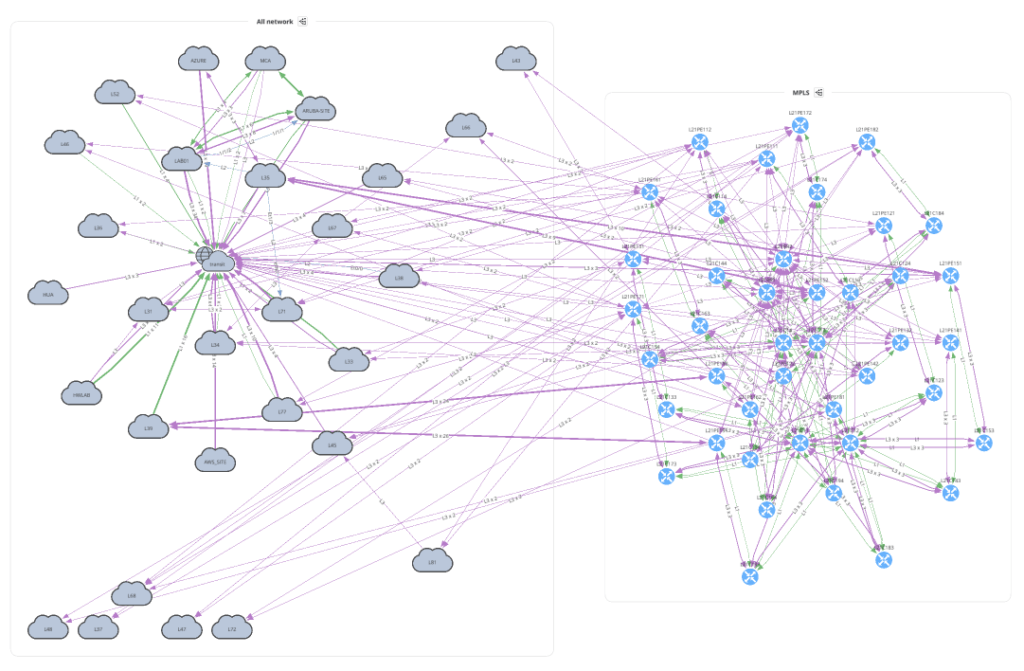
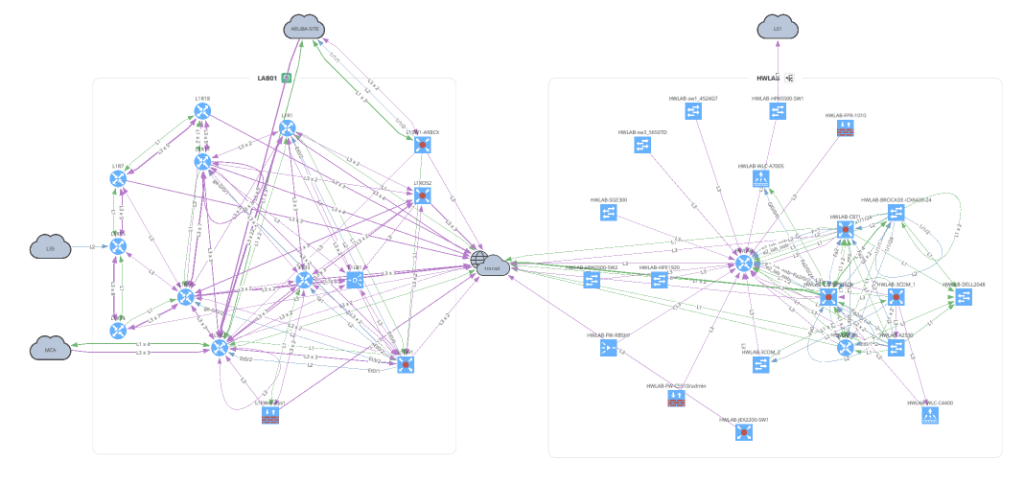
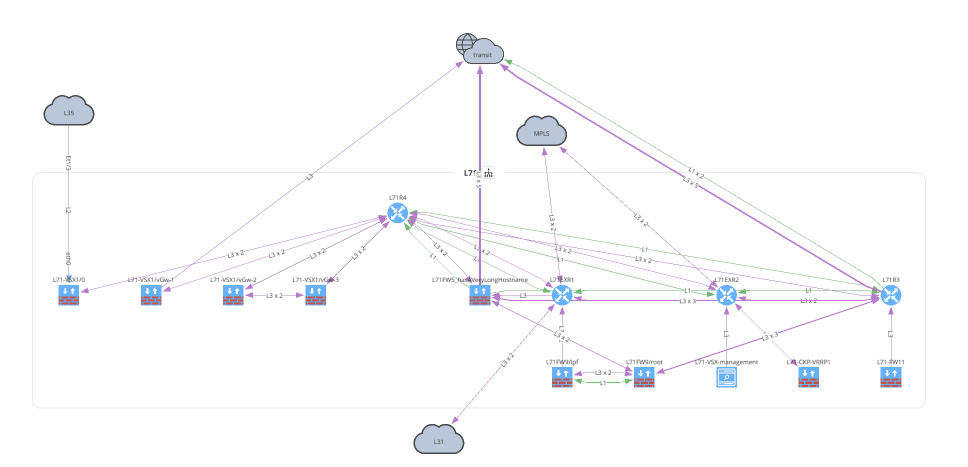
The Network class accepts 3 input parameters. If no parameters are defined, this will create a graph similar to going to the UI and Diagrams > Network.
site name or a List of site names.# 2_network.py
from os import path
from ipfabric import IPFClient
from ipfabric.diagrams import Network, Layout
if __name__ == '__main__':
ipf = IPFClient() # IPFClient(base_url='https://demo3.ipfabric.io/', auth='token', verify=False, timeout=15)
with open(path.join('network', '2_1_network.png'), 'wb') as f:
f.write(ipf.diagram.png(Network(sites='MPLS', all_network=True)))
with open(path.join('network', '2_2_network.png'), 'wb') as f:
f.write(ipf.diagram.png(Network(sites=['LAB01', 'HWLAB'], all_network=False)))
with open(path.join('network', '2_3_network.png'), 'wb') as f:
f.write(ipf.diagram.png(
Network(sites='L71', all_network=False, layouts=[Layout(path='L71', layout='upwardTree')])
))
Before moving on to Unicast and Multicast let's take a look at how to overlay a snapshot comparison or specific intent rule onto your graph. You can apply this to any type of graph.
# 3_network_overlay.py
from os import path

from ipfabric import IPFClient
from ipfabric.diagrams import Network, Overlay

if __name__ == '__main__':
    ipf = IPFClient()  # IPFClient(base_url='https://demo3.ipfabric.io/', auth='token', verify=False, timeout=15)

    with open(path.join('network', '3_1_network_snap_overlay.png'), 'wb') as f:
        f.write(ipf.diagram.png(Network(sites='MPLS', all_network=False),
                                    overlay=Overlay(snapshotToCompare='$prev')))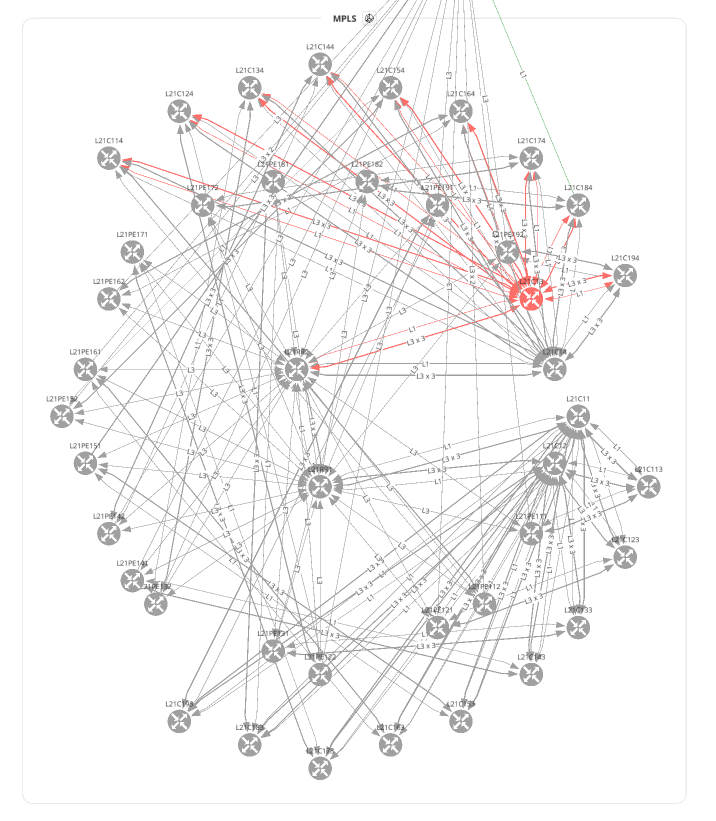
To overlay an Intent Rule you must first get the ID of the rule to submit. In this example, we are using the ipfabric package to load the intents and get a rule by name. Find more examples of extracting intent rule IDs here.
# 3_network_overlay.py
from os import path

from ipfabric import IPFClient
from ipfabric.diagrams import Network, Overlay

if __name__ == '__main__':
    ipf = IPFClient()  # IPFClient(base_url='https://demo3.ipfabric.io/', auth='token', verify=False, timeout=15)

    # Get intent rule ID
    ipf.intent.load_intent()
    intent_rule_id = ipf.intent.intent_by_name['NTP Reachable Sources'].intent_id

    with open(path.join('network', '3_2_network_intent_overlay.png'), 'wb') as f:
        f.write(ipf.diagram.png(Network(sites=['L71'], all_network=False),
                                overlay=Overlay(intentRuleId=intent_rule_id)))
The next two examples make it a bit clearer why we first create a python object and then pass it into the diagramming functions. The amount of options required are quite lengthy, and this keeps your code cleaner and provides great type hints (see below). Additionally, it has many built-in checks to ensure you provide the correct data before submitting the payload to IP Fabric and returning an error.
For all valid ICMP types please refer to icmp.py.
# 5_unicast_path_lookup.py
from os import path

from ipfabric import IPFClient
from ipfabric.diagrams import icmp, Unicast

if __name__ == '__main__':
    ipf = IPFClient()  # IPFClient(base_url='https://demo3.ipfabric.io/', auth='token', verify=False, timeout=15)

    unicast_icmp = Unicast(
        startingPoint='10.47.117.112',
        destinationPoint='10.66.123.117',
        protocol='icmp',
        icmp=icmp.ECHO_REQUEST,  # Dict is also valid: {'type': 0, 'code': 0}
        ttl=64,
        securedPath=False  # UI Option 'Security Rules'; True == 'Drop'; False == 'Continue'
    )

    with open(path.join('path_lookup', '5_1_unicast_icmp.png'), 'wb') as f:
        f.write(ipf.diagram.png(unicast_icmp))
TCP and UDP accept srcPorts and dstPorts which can be a single port number, a comma-separated list, a range of ports separated by a -, or any combination of them. The applications, srcRegions, and dstRegions arguments are used for Zone Firewall rule checks and these default to any (.*).
# 5_unicast_path_lookup.py
from os import path

from ipfabric import IPFClient
from ipfabric.diagrams import Unicast, OtherOptions

if __name__ == '__main__':
    ipf = IPFClient()  # IPFClient(base_url='https://demo3.ipfabric.io/', auth='token', verify=False, timeout=15)

    unicast_tcp = Unicast(
        startingPoint='10.47.117.112',
        destinationPoint='10.66.123.117',
        protocol='tcp',
        srcPorts='1024,2048-4096',
        dstPorts='80,443',
        otherOptions=OtherOptions(applications='(web|http|https)', tracked=False),
        srcRegions='US',
        dstRegions='CZ',
        ttl=64,
        securedPath=False
    )

    with open(path.join('path_lookup', '5_2_unicast_tcp.png'), 'wb') as f:
        f.write(ipf.diagram.png(unicast_tcp))

    with open(path.join('path_lookup', '5_3_unicast_tcp_swap_src_dst.png'), 'wb') as f:
        f.write(ipf.diagram.png(unicast_tcp, unicast_swap_src_dst=True))

    # Subnet Example
    unicast_subnet = Unicast(
        startingPoint='10.38.115.0/24',
        destinationPoint='10.66.126.0/24',
        protocol='tcp',
        srcPorts='1025',
        dstPorts='22',
        securedPath=False
    )

    with open(path.join('path_lookup', '5_4_unicast_subnet.png'), 'wb') as f:
        f.write(ipf.diagram.png(unicast_subnet))
This is a new graphing feature in version 4.3 and above that allows you to specify a device and interface a packet enters your network. Perhaps you have a firewall rule to allow a certain IP address or subnet and want to verify that this is functioning correctly. The sn value is the IP Fabric unique serial number, iface is the intName or Interface column (not to be confused with Original Name), and the hostname is also required. The easiest way to collect this information is from the Inventory > Interfaces table. The sn is not a visible column in the UI, but is available from the API.
# Example pulling Interface Inventory table
from ipfabric import IPFClient
ipf = IPFClient(base_url='https://demo3.ipfabric.io/', token='token', verify=False)
interfaces = ipf.inventory.interfaces.all(columns=['sn', 'hostname', 'intName'])
# 5_unicast_path_lookup.py
from os import path
from ipfabric import IPFClient
from ipfabric.diagrams import Unicast, Algorithm, EntryPoint
if __name__ == '__main__':
ipf = IPFClient() # IPFClient(base_url='https://demo3.ipfabric.io/', auth='token', verify=False, timeout=15)
# User Defined Entry Point Example
unicast_entry_point = Unicast(
startingPoint='1.0.0.1',
destinationPoint='10.66.126.0/24',
protocol='tcp',
srcPorts='1025',
dstPorts='22',
securedPath=True,
firstHopAlgorithm=Algorithm(entryPoints=[
EntryPoint(sn='test', iface='eth0', hostname='test'),
dict(sn='test', iface='eth0', hostname='test') # You can also use a dictionary
])
)Multicast is very similar to Unicast except some of the parameter names have changed. You can also specify a receiver IP address but this is optional.
# 7_multicast.py
from os import path

from ipfabric import IPFClient
from ipfabric.diagrams import Multicast

if __name__ == '__main__':
    ipf = IPFClient()  # IPFClient(base_url='https://demo3.ipfabric.io/', auth='token', verify=False, timeout=15)

    multicast = Multicast(
        source='10.33.230.2',
        group='233.1.1.1',
        receiver='10.33.244.200',
        protocol='tcp',
        srcPorts='1024,2048-4096',
        dstPorts='80,443',
    )

    with open(path.join('path_lookup', '7_multicast.png'), 'wb') as f:
        f.write(ipf.diagram.png(multicast))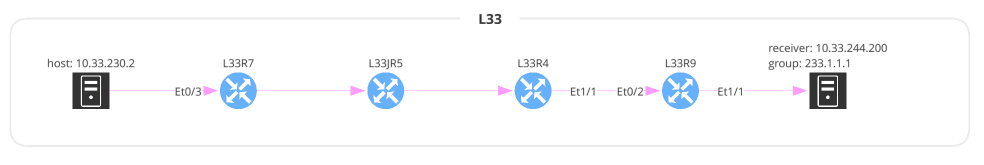
One of the great advantages of using this package is returning a Python object instead of returning the raw JSON. This allows a user to more easily understand the complex textual data returned by IP Fabric that represents how the edges (links) connect to the nodes (devices, clouds, etc.) and the decisions a packet may take. You can accomplish this via the JSON output but returning an object provides type hints along with the ability to export the model as a JSON schema. Please note that the model is not the exact same as the JSON output and some structure has been changed for ease of use. It also dynamically links some internal objects to eliminate the need to do extra lookups and references.
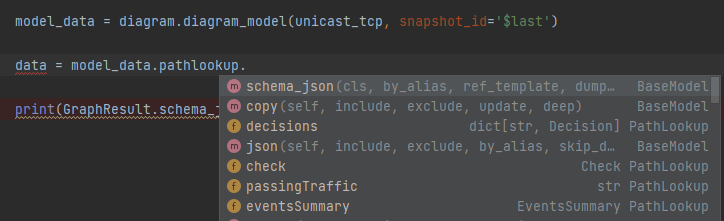
# 6_json_vs_model.py
from ipfabric.diagrams.output_models.graph_result import GraphResult

if __name__ == '__main__':
    print(GraphResult.model_json_schema())
"""
{
  "title": "GraphResult",
  "type": "object",
  "properties": {
    "nodes": {
      "title": "Nodes",
      "type": "object",
      "additionalProperties": {
        "$ref": "#/definitions/Node"
      }
    },
    "edges": {
      "title": "Edges",
      "type": "object",
      "additionalProperties": {
        "anyOf": [
          {
            "$ref": "#/definitions/NetworkEdge"
          },
          {
            "$ref": "#/definitions/PathLookupEdge"
          }
        ]
      }
    },
...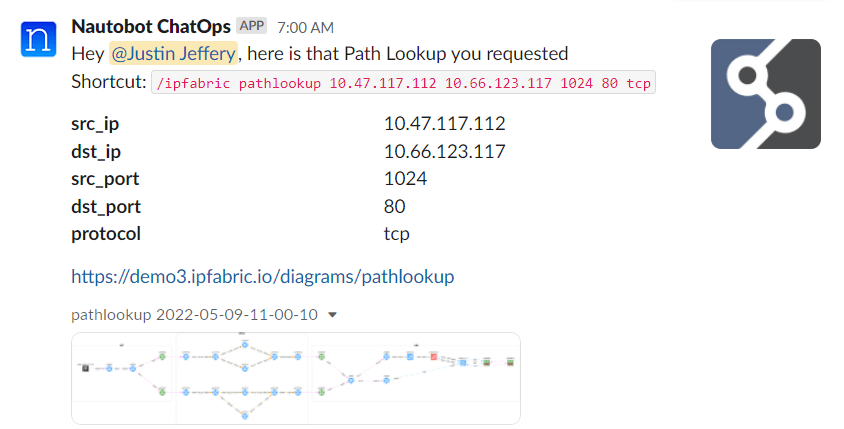
"""The ability to create diagrams using the API allows for greater automation and integration into other applications. Many of our customers use this feature to create chatbots to speed up troubleshooting, as shown below. This example is from the Network to Code nautobot-plugin-chatops[ipfabric] plugin.
Another useful feature is performing a Path Lookup and parsing the JSON output to ensure traffic is flowing apart of a review process. We have partnered with Itential to demonstrate how using their low-code automation platform can automate ServiceNow requests and ensure that a newly deployed IP has access to correct network services during a Change Control review. Keep an eye out for a video of this exciting demonstration!
If you have any questions, comments, or bug requests please send an email to [email protected] or open an issue request on the GitLab repository.
To address Cobit 2019 certification we need to make sure we have an understanding of what Cobit stands for, "Control Objectives for Information and Related Technology". First of all, it was mainly focused on auditing, specifically helping financial auditors navigate IT environments. Now it is the leading framework for the governance and management of enterprise IT. It includes breadth of tools, resources and guidance. Its main value is leveraging proven practices to inspire IT innovation and fuel business success.
The network infrastructure is the most critical underlay for any applications running in enterprise environments. In addition, data security is critical to any organization. That's the reason why at least some information security standard must be incorporated. This applies to anyone who aims to keep the data well protected.
Any value created in the digital world automatically attracts those who intend to capture its value. Of course without any necessary permission. It can be a hacker or medium-skilled student with malicious intent. But it's not important who desires to access your data or why. Without following any security best practices, you are out in the open.
Moreover, in our previous post related to security audits automation, other relevant information related to Cobit can be found. In this article, we will focus on how the IP Fabric platform can assist with network security management. Further, bringing benefits to everyday operations.
At first, the IT domain needs to be perfectly specified and well-aligned with the business goals. The starting point for further security practices development in any certification is to be aware of all its infrastructure elements.
The infrastructure elements may include all active network devices (routers, switches, firewalls, load-balancers, etc.), a full inventory of end-points (virtual or physical servers) communicating on the network or entry points to the network (available physical interfaces, wireless access points and more). All in all, an up-to-date detailed inventory is the most important factor for any enablement.

For the IP Fabric platform, the full and up-to-date inventory of any elements on the network is an easy task. It provides its users with complete visibility. Moreover with multiple views and end-of-life information, with automated protocol level diagrams fresh every day. Apart from that, all data is easily exportable manually or by any integrated system via API.
The definition above relates to mapping existing information flows across routed or switched networks with clear security objectives. Firewalls with properly configured security policies are the key components in building secure networks and preventing unwanted access.
However as the network grows in complexity, more teams participate in network security policies administration. Hence, the restrictive rules may be violated with unauthorized or temporary changes on firewalls or access-lists.
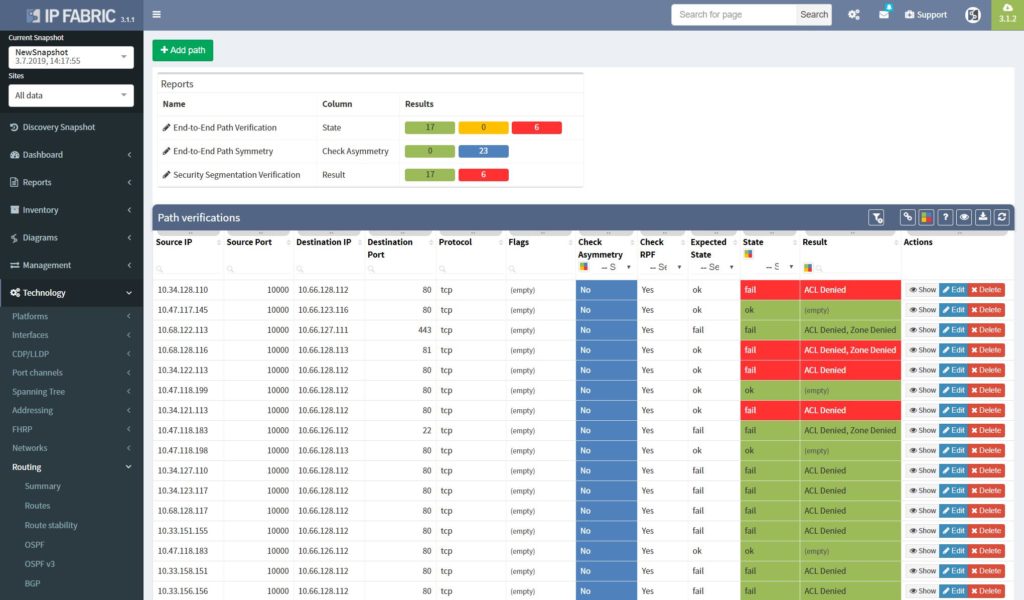
The best approach to a stable security environment that meets the high standards is continuous security policies and end-to-end path verification. In addition, with the IP Fabric platform, users are provided with the tool that can help with both. The platform reads and stores all security policies from selected vendors. As well as, immediately detecting changes and providing historical data. Besides, with the end-to-end path testing feature available, it can store hundreds of defined path checks, that are being continuously verified with every new network snapshot.
The network management misconfigurations are maybe one of the most discovered with the IP Fabric tool at the first run. What we often detect with automated verifications is legacy Simple Network Management Protocol (SNMP) configurations, old TACACS+ or RADIUS servers left in or outdated access-lists (ACL) applied to management interfaces.
If you have found this article resourceful, please follow our company’s LinkedIn or Blog, where there will be more content emerging. Furthermore, if you would like to test our platform to observe how it can assist you in more efficiently managing your network, please write us through our web page www.ipfabric.io
Network documentation is a very complex and thorough topic - there are many guidelines, theories and even books that can help us with the process of creating and maintaining proper documents describing the network. The concept and execution may vary, but the purpose of the documentation should be unique - to represent the current state and settings of the network and all of the respective components. Let’s skip the document’s life cycle stages, like where to store the documents, how long the information should be stored for, how to track the changes etc., as there is much to cover on this topic. What is most important, is knowing what to document from a networking point of view, and how to represent the data.
Ideally, the network documentation should enable reconstructing the network from scratch. In case a change is being planned, state information is necessary to plan the change correctly. In the event that the active network device goes down due to an unforeseen event, it is crucial that the network can be reverted to its previous state. And if elements of a new network should incorporate elements from the network, being able to accurately document the corresponding detail levels is particularly important.
It goes without saying that the network engineer should be able to understand the documentation corresponding to their network without unnecessary complications. Being able to fetch the device list, understanding how they are interconnected and configured, and being able to verify all of this information is essential. Although the structure of the individual documents may vary, the common approach should be adhered to – describing the network based on the Open Systems Interconnection (OSI) model.
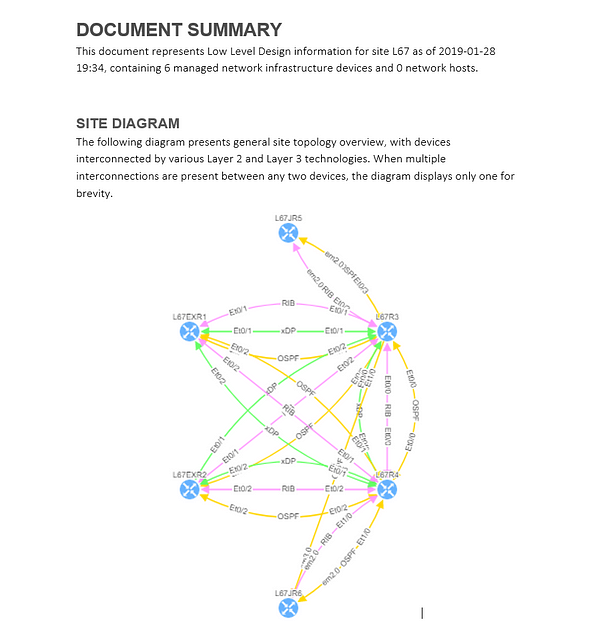
This chapter should cover the device list, including the hardware modules, the software versions, applied patches and other hardware/software details. Documenting the device location, rack plan and physical access details is optional. The core of this section is to document the physical cabling – interface names, transceiver and cable types. IP Fabric provides all information under the Inventory section – Device list, OS versions, List of interfaces with many details.

1 - Device Inventory
The second OSI layer describes the logical rather than physical connections. It means that segmentation can follow the physical cabling but it can extend the connection by using Virtual-LANs (VLANs), the port aggregation (EtherChannel, Port-Channel, Aggregated interfaces), different types of Spanning-Tree (STP) or use proprietary concept like Fabric Path etc. All this information are important to be able to understand how the network is functional from the logical point of view. If desired, it may document the logical settings of the devices like stacks - Virtual Switching System or Stack-Wise Virtual, VDC or vPC. The format of the documented data has to be carefully considered - there are plenty of methods such as network diagrams, tables, lists or configuration snippets.
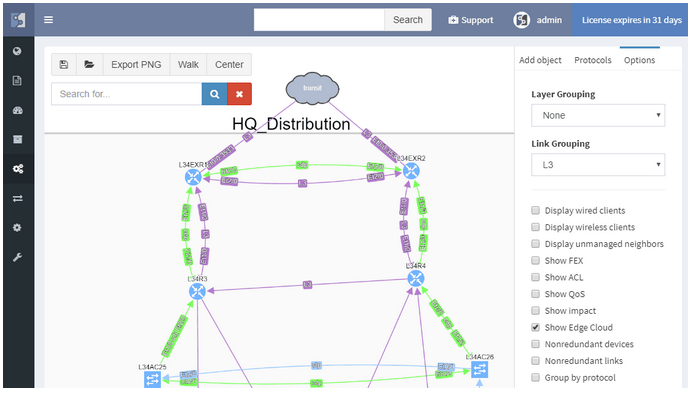
IP Fabric collects lot of details and all the data are presented in a standardized and comprehensible way. Network diagram (per site) is showing protocol-level connections and technology section provides table overview of L2 specific topics.
2 - Network L1/L2/L3 diagram
Describing the network layer should be the most critical and most extensive aspect of the network documentation, as it should cover the elements such as:
IP addressing is a subject of a separate document and specific IP Address Management (IPAM) tool may be used (free or paid) - it should cover all the network subnets configured within the network. It depends on the capabilities of the IPAM to store all the details, but from the best practice approach it should list the network subnet, the configured IP address, device and interface name. Ideally, IPAM should track the history of the changes to see when and what changes have occurred. However, most of the tools available on the market require manual database maintenance.
Routing can be simplified using few static routes within one flat routing domain, but also can be very complex and structured by using several dynamic routing protocols like EIGRP, OSPF or BGP with complex redistribution on several places within the routing domain. Therefore, it should be documented to an appropriate detail level to in order to provide network behavior insight, and enable the possibility of building the website from network documentation alone.
IP Fabric excels in this area by collecting all the data mentioned above automatically, and more; IP addresses are listed in Managed IP overview and any IP can be verified against the device/interface name, including DNS name or other few additional settings. It can be also used as an initial input to the IPAM tool - just to export all the data to the CSV format and import the values to the IPAM. Collecting the list of IP addresses and IP networks is not the core of the IP addressing management - that’s only a list of values that are being used across the whole network. That said, proper comprehension and routine updates will serve the IPAM as needed.
The fourth layer of OSI model helps securing the traffic. The control plane security means securing the data needed to establish the network functionality - routing protocols, FHRP, device management etc. It should be covered in the appropriate part based on the control protocol, e.g. securing the dynamic routing protocol or FHRP should be covered in the previous chapter, securing the device management in the chapter covering the accessing the device (Telnet, SSH, SNMP) and so on.
Data plane filtering is the core of this section - it refers to the core concept of how the production data (user data) is being filtered, and should be documented first; it can then extend to the details and provide a very detailed view of the individual access-lists statements. Another concern is, how far need you dig into the details? It depends on the complexity of the implementation as well as the corresponding security policies that can limit the amount of information that may be presented.
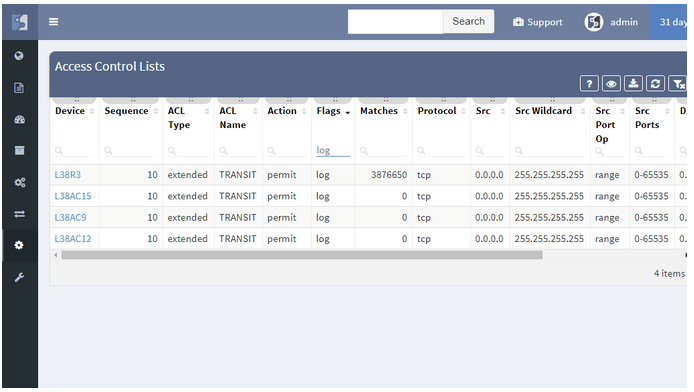
IP Fabric provides a coherent Access-List (ACL) overview, which also serves the ability to check the A-B path verification for specific traffic. Just enter the source and destination IP address in the network, then the traffic type - Internet Control Message Protocol (ICMP) or TCP/UDP and source/destination port in the second case.

3 - Vieving Access-Lists in the tolopolgy
The application layer is often excluded from the network documentation, but the process is changing and applications are more and more often a focal point of the new network principles and approaches. For this article and this chapter especially, the application layer description should include all the application we need to control, manage and monitor the network. Standard tools for device management are still Telnet/SSH with some corporate identity management (TACACS or Radius), and specific tools based on GUI front-end are more popular nowadays.
The network documentation process should incorporate the previous examples, but not be limited to them. There are many technologies, concepts, and network functions and it is very difficult to maintain an up-to-date overview of all such documents, especially when it comes to vast enterprise networks. Therefore, automating the process of collecting network data and subsequently creating the corresponding documents has proven to be a substantial advantage. IP Fabric eliminates the need for manual low-level design documentation; IP Fabric provides a detailed network overview for each business location, including topology visualization. Automatically generated, always available & up-to-date.
If you’re interested in learning more about how IP Fabric’s platform can help you with analytics or intended network behavior reporting, contact us through our website, request a demo, follow this blog or sign up for our webinars.
Transcript
Today we will go through a quick demonstration of the IP Fabric platform and its main features. The IP Fabric platform is the network management system that helps companies to empower network engineers and teams to discover, verify, and document large scale networks within minutes.
IP Fabric's lightning-quick processes intelligently discover over 3,000 network infrastructure nodes an hour and collect more than 2,000 configurational and operational state data per active network device.
The system then generates a digital model of the entire network with the switching/routing and security logic built-in. Since IP Fabric can identify both known and unknown devices, it eliminates the need for manual inventory processes in the company.
To initiate the IP Fabric platform successfully, it first needs to be installed on VMWare 5.0 or later and have an access to all infrastructure devices via SSH or Telnet with correct credentials.
Of course we can apply additional settings, such as IP subnets to include or exclude from discovery, limit the bandwidth or the number of concurrent sessions during and many other.
Once the discovery is finished we have a complete digital image of the entire network, which we call the snapshot. In every snapshot, we can run end to end path simulations, view all operational data about the network, analyze network topology maps or verify the network’s overal state with the Assurance Engine.
That is all for the introduction, now let’s get started with the demo.
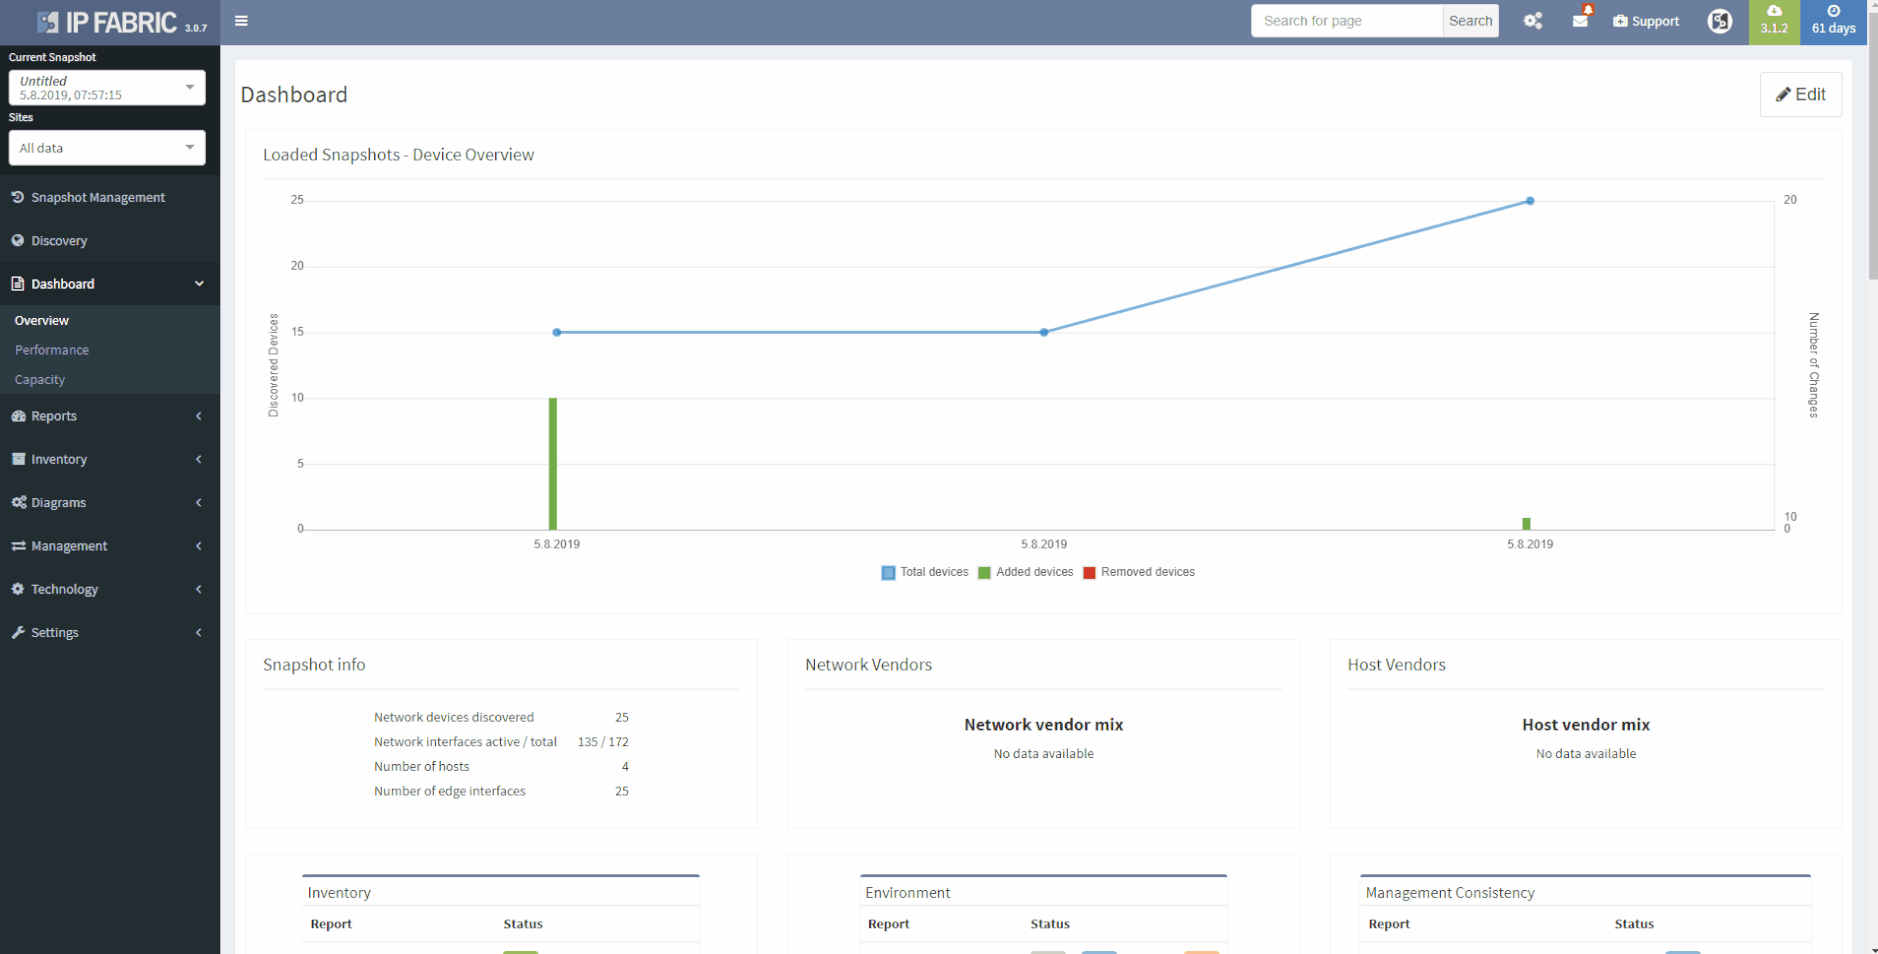
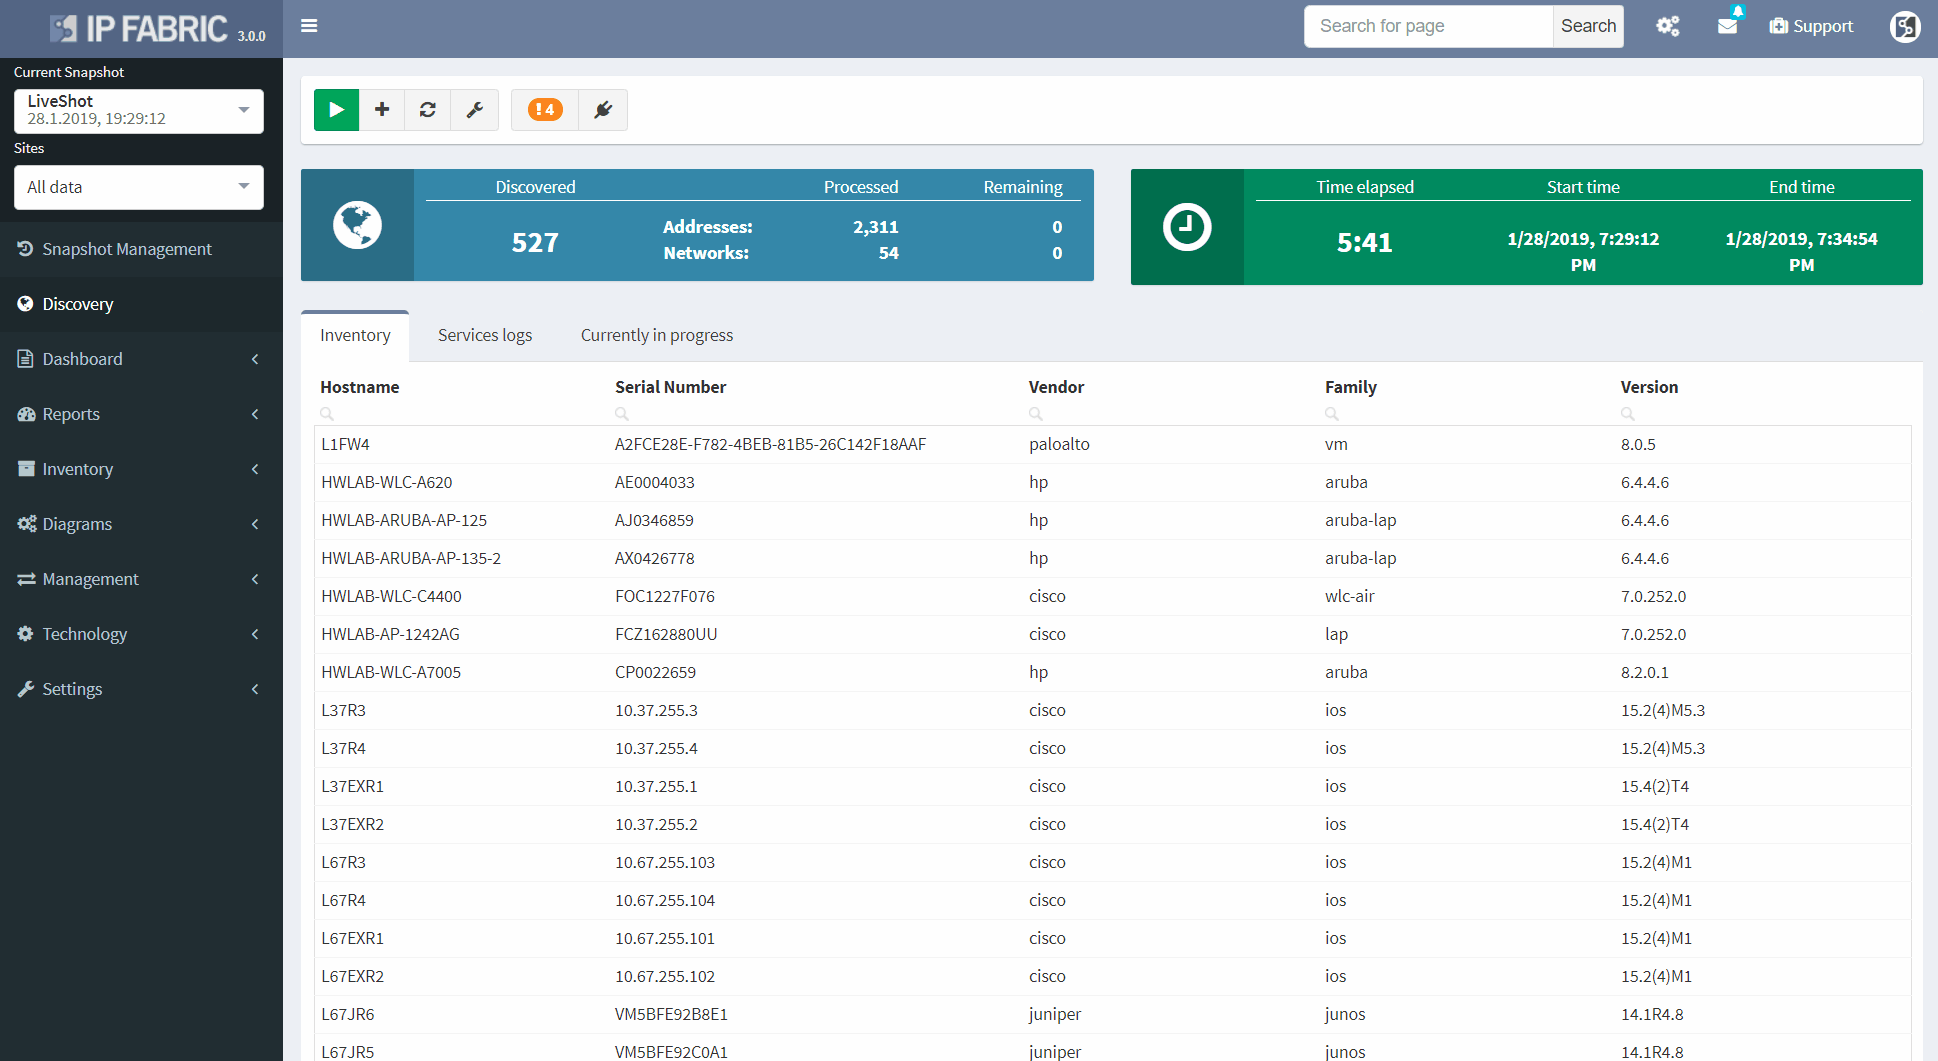
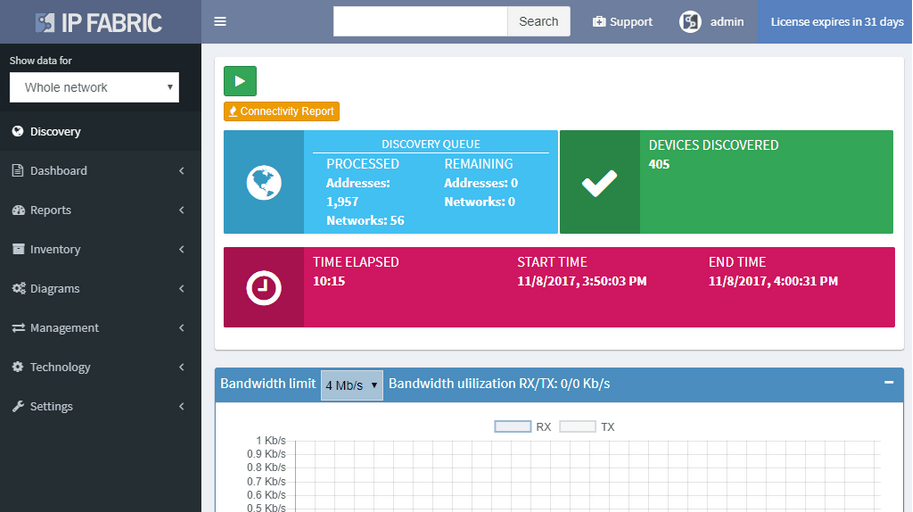
We are currently in the Snapshot management area. We have 4 snapshots loaded in the RAM memory and they are available to be explored immediately. Historical ones are stored on the Hard drive and can be loaded to RAM anytime. We can decide to add more devices to currently active snapshot or reinitiate discovery on selected devices and get the newest data.
We have the Connectivity Report which contains all IPs that the platform interacted with during discovery process, which is great for troubleshooting purposes and it underlines complete transparency that the user has when using the platform.
With our current snapshot, we discovered almost 600 devices and it took us about 10 minutes. We have the list of sites that serve as a logical groups for network devices. The user has full control over the Site Separation mechanism, sites can be based on devices’ location or function, it’s up to administrator to decide.
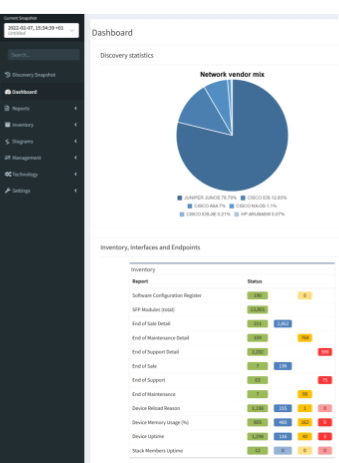
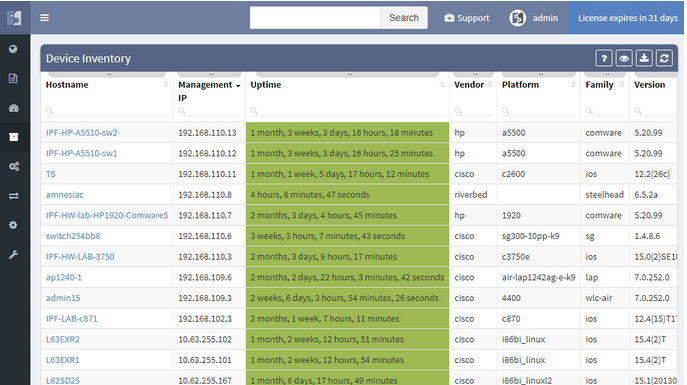
Now we will examine the inventories. We have full and very detailed visibility into all types of inventories: Devices, Interfaces, End-points or End-Of-Life milestones, which are very important for lifecycle management.
In any inventory or technplogy tables Sorting and Filtering tools are available. For example, in case I want to find all Juniper SRX devices within the inventory, I will fill in the vendor and the platform field and I have results available in seconds.
I can choose which parameters will be visible or change the columns’ order. Any filtered output is easily exportable to a CSV document and can be shared with the team. By the way, all search or filter functions available in graphical user interface are obtainable via API as well, with full documentation available online or in the platform.
MTU
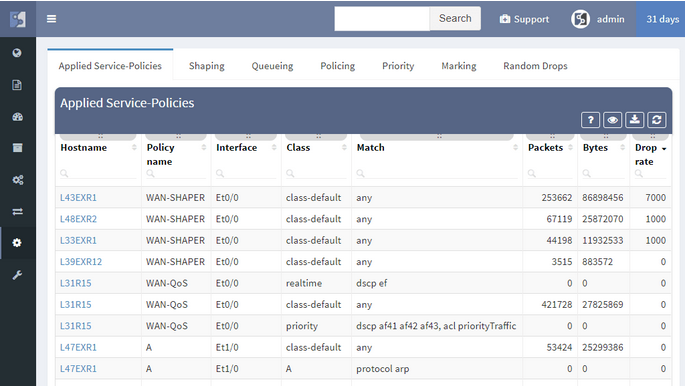
Because the platform is the tool not only for viewing static data but also for analyzing behaviour of variety of protocols. Addressing any inconsistent states is very easy. As an example we can explore data for the Maximum Transmission Unit (or MTU) on all links just by few clicks.
I will search for an MTU, where we have all the information available. To discover any issues, we’ll just click on available verficiation and we have results in seconds.
Detecting inconsistent MTUs on all transit links in large scale networks can be a really time consuming to get, there can be tens of thousands links to verify.
After discovery, we only export the data and send it to operations team immediately. This type of proactive network management will help us to decrease the number of network issues in the future.
If we desire to have a visual representation of MTU results in diagrams, we will click on the site button and check for MTU in there.
OSPF
Similar applies if for any other supported technology. In the platform we can research routing and switching protocols, stacks, clusters, 802.1X, PoE, Quality of service and many many more. The IP Fabric platform is a search engine for any network.
As an example may be OSPF protocol.
We are very quickly seeing all OSPF sessions with all details on the network. By a single click we can tell if there are any sessions down or in transition state and use it for documentation purposes or for troubleshooting.
In addition we can go back in time, switch the snapshot and see historical results, which makes it an amazing tool for root cause analysis.
Assurance Dashboard
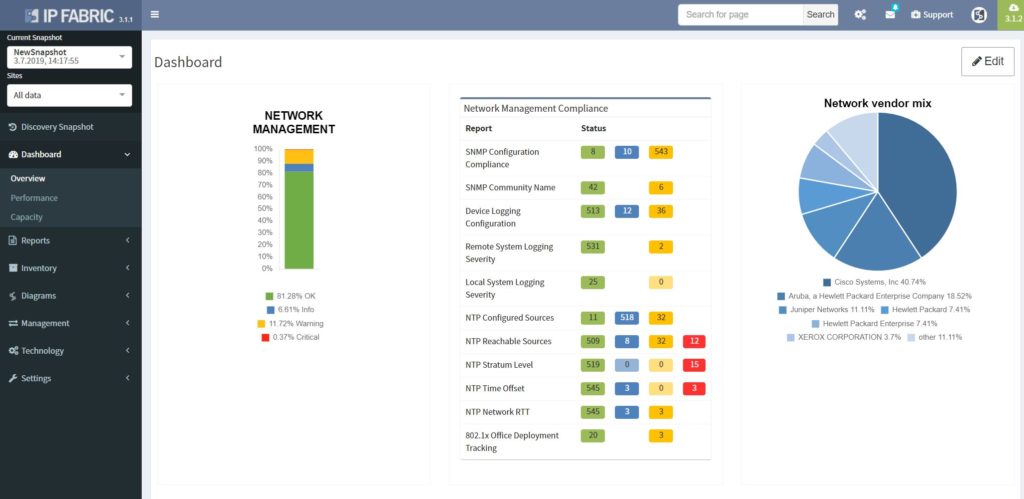
Last feature we would like to delve into, before we move on to diagrams, is the IP Fabric’s Assurance Dashboard, where all these verifications are displayed in one place.
IP Fabric is supplied with dozens of predefined network verification checks. These checks can be altered based on your needs, or you can create your custom ones very easily.
There are many focusing on Management protocols, Performance, Stability, Routing and Switching protocols, and we can go on..
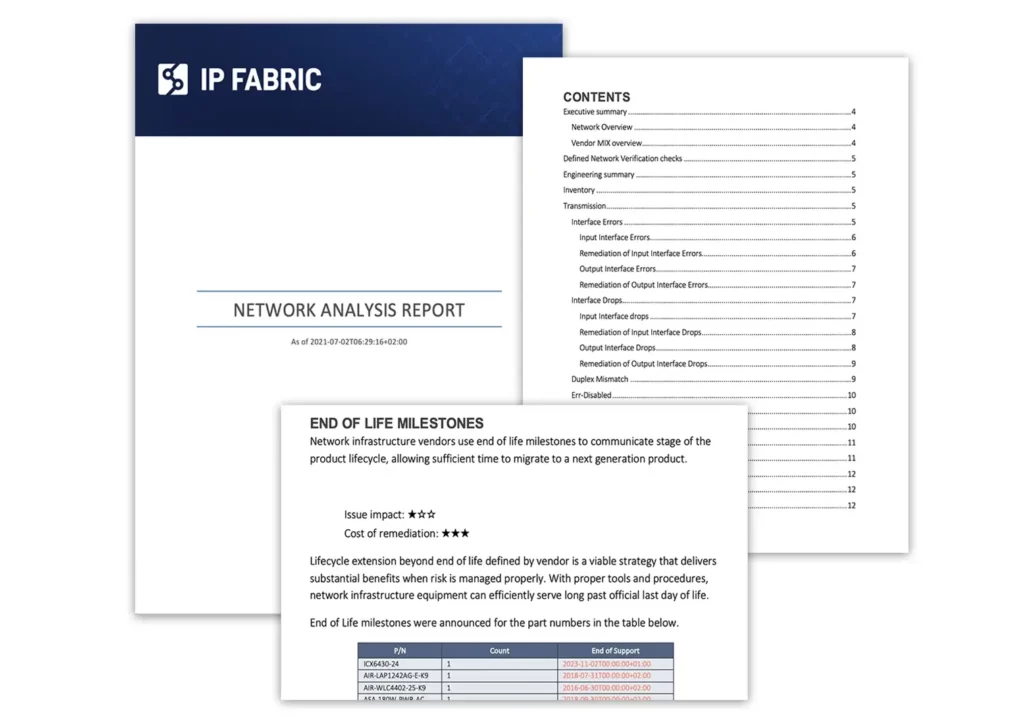
All verifications are provided with explainers and all these results can be exported to the Network Analysis Report, which can be generated by the platfrom on demand.
Diagrams
And now the Diagrams. With the IP Fabric, you have full and detailed visibility on a protocol level. There are not only physical links between devices in the topology maps but all relations between devices. If it's OSPF or BGP session, Spanning-Tree or discovery protocols.
All views and layouts can be easily modified or built from the scratch with the amazing View Builder feature. All available in a multivendor environment.
The network devices can be repositioned freely and the layout can be saved for future analysis. And the same diagram appears in the Low-Level design document, which can be also generated by the platform.
What we can quickly explore in terms of layers is Discovery protocols, which can be considered as physical layer mapping, Spanning-Tree or Mac layer and Routing protocols, all separately or together at once in a diagram.
In case we desire, for example, to track a single VLAN in the topology, we will click on any trunk link, select the VLAN number and immediately analyze which ports are in forwarding or blocking state for any particular VLAN or examine where the root bridge is.
The same we can do for any previous snapshot, we may go back in time and analyze any topology from the past!
Now a quick look at routing protocols. In the current topology, we have OSPF and BGP present, apart from that we support all mayor routing protocols including EIGRP, RIP, IS-IS or Label Distribution protocol from the MPLS environment.
By interacting with any link or node we get more detailed data, we can add the cost on OSPF links if we want to and export the topologies.
In addition we are able to visualize connected servers, IP phones or PC or wireless access-points if they are present. Then visualize QoS, Access-Lists or First Hop Redundancy protocols, detect single points of failure or non-redundant links.
End-to-End
Now we will move on to the E2E path testing. The End to End path testing can be essential for root cause analysis, verifying the post-migration state of selected application paths across the network or any ad-hoc testing related to client’s portion of the network. The IP Fabric platform enables seamless and extremenly fast path testing on the created mathematical model.
It takes literally seconds to complete standard end to end simulations for switching, routing and security portion. It is also possible to test end-to-end in MPLS networks based on labels.
So let’s test on our own:
With the path check feature, selected paths can be saved and continuously verified by the platform with every new discovery automatically.
Documentation
Maintaining network documentation may be a tedious and difficult process, that requires a vast amount of time. Which is the main reason why many companies are necessarily hiring external resources to complete the task.
To simplify the process, IP Fabric platform automates network documentation. There are currently two types of automated documents. The first one is the LLD document, which provides a detailed network overview for each business location, including topology visualization.
The second one is the Network Analysis Report, which will give you an overall report of your network, including network state checks.
If you’re interested in learning more about how IP Fabric’s platform can help you with analytics or intended network behavior reporting, contact us through our website, request a demo, follow this blog or sign up for our webinars.
International standard or ISO 27001 certification is helping organizations to better understand network and security area administration. It also defines models for increasing network and security resilience and other features.
To begin with, the network infrastructure has become more and more important for many organizations. Hence, nothing is more valuable than data being transferred between the systems or stored within the secured perimeter. That's why the information security standard should be incorporated by anyone who aims to keep the data well protected.

Furthermore, any value created in the digital world automatically attracts those who intend capturing the value without any necessary permission. It can be a hacker or medium-skilled student with malicious intent. But it's not important who desires to access your data or why. Without following any security best practices, you are out in the open.
In addition, our previous post related to security audits automation, provides other relevant information to ISO 27001 certification . Further, in this article we will focus on how the IP Fabric platform can assist with network security management. Hence, bringing benefits to everyday operations.
"ISO/IEC 27001 formally specifies an Information Security Management System (ISMS), a suite of activities concerning the management of information risks (called ‘information security risks’ in the standard). The ISMS is an overarching management framework through which the organization identifies, analyzes and addresses its information risks."
From https://www.iso27001security.com/html/27001.html
The definition above perfectly describes the starting point for further security practices development in ISO 27001 certification. However, to proceed with the next steps of the standardization, the company needs to be aware of all infrastructure elements.
The infrastructure elements may include all active network devices (routers, switches, firewalls, load-balancers, etc.). Furthermore, a full inventory of end-points (virtual or physical servers) communicating on the network or entry points to the network. These are available physical interfaces, wireless access points and more. To summarize the point, an up-to-date detailed inventory is the most important factor for any enablement.
For the IP Fabric platform, the full and up-to-date inventory of any elements on the network is an easy task. It provides its users with complete visibility with multiple views and end-of-life information, with automated protocol level diagrams fresh every day. Apart from that, all data is easily exportable manually or by any integrated system via API.
"It recommends information security controls addressing information security control objectives arising from risks to the confidentiality, integrity, and availability of information. Organizations that adopt ISO/IEC 27002 must assess their own information risks, clarify their control objectives and apply suitable controls (or indeed other forms of risk treatment) using the standard for guidance."
From https://www.iso27001security.com/html/27002.html
The definition above relates to mapping existing information flows across routed or switched networks with clear security objectives. Firewalls with properly configured security policies are the key components in building secure networks and preventing unwanted access.
However as the network grows in complexity, more teams participate in network security policies administration. As a result, the restrictive rules may be violated with unauthorized or temporary changes on firewalls or access-lists.
The best approach to a stable security environment that meets the high standards is continuous security policies and end-to-end path verifications. With the IP Fabric platform, users are provided with the tool that can help with both. The platform reads and stores all security policies from selected vendors, it can immediately detect changes and provide historical data. Besides with the end-to-end path testing feature available, it can store hundreds of defined path checks, that are being continuously verified with every new network snapshot.
The network management misconfigurations are maybe one of the most discovered with the IP Fabric tool at the first run. What we often detect with automated verifications is legacy Simple Network Management Protocol (SNMP) configurations, old TACACS+ or RADIUS servers left in or outdated access-lists (ACL) applied to management interfaces.
The operations security is clearly described in Section 12 in ISO 27002 and is essential to any environment compliant with the standard.
If you have found this article resourceful, please follow our company’s LinkedIn or Blog, where there will be more content emerging. Furthermore, if you would like to test our platform to observe how it can assist you in more efficiently managing your network, please write us through our web page www.ipfabric.io
Documentation is a critical part of any project or technical environment. If we don’t jot down some important information along the way, we end up repeatedly asking the same basic questions over and over again, completely draining our team members. We’ve heard from many team members that have admitted that the most annoying part of their day is answering those same repetitive questions day after day.
To begin with, when it comes to documenting computer networks (or other similar systems) we tend to use programs like draw.io or Visio. These programs are fantastic for outline ideas during the creative process of designing a new network. Furthermore, tools like these help us visualize our concepts, present them to others, then easily update those ideas as they evolve into a more cohesive plan.
For these tasks, these tools are great, but when the environment goes live… we quickly discover that we need something more.
Content updates to documentation can be a pain to maintain, especially for some of the more extensive networks — and the larger the network, the more changes an organization seems to want to make per day.
One solution to this issue is to appoint a dedicated team member (or, depending on the size of the network, an entire team) with the task of maintaining documentation. Whether they’re frequently updating the documentation themselves, or pushing the engineers to update the documentation after each update, this becomes quite the labor-intensive task.
Before we built the IP Fabric platform, we knew that there had to be some way to save time during time-consuming network operations processes. After simplifying that process through automation, we then took that same logic and turned our sights on the documentation process. Hence, we added a feature to the platform that gathers more than 1000 parameters from a single network device.
Now, on top of generating breathtaking interactive network diagrams, the platform can generate low level design documents. After every discovery snapshot, the platform creates a report that includes all the information needed for an audit, including device inventory details, physical layer, data-link layer details, routing and switching details.
These documents full of fancy diagrams can be generated whenever needed, and can easily be modified or compared to previous versions. This feature is an excellent timesaver for any Network Engineer or Network Engineering Manager, which helps them become a much more productive team member. Instead of wasting time working on mundane tasks, they can focus on tasks that create value. For example, examining overall network architecture, increasing stability, or having some spare time to enjoy their cup of coffee.
If you’re interested in learning more about how IP Fabric’s platform can help you with analytics or intended network behavior reporting, contact us through our website, request a demo, follow this blog or sign up for our webinars.
The IP Fabric platform 2.0 is a major new version of the network engineer’s best friend. A number of big changes and customer feedback have made it into the release. From tracking all changes in the network to supporting more networking technologies, and going deeper into the technology stack than any other product.
A single button now discovers the network and takes a thorough snapshot at the same time. Large networks are undergoing constant change. Analyzing partial network does not provide a full picture, while discovery alone was not sufficient to provide valuable insight about the network. Discovery of new devices, new connectivity, and new protocols, is now combined with an in-depth network analysis and assessment, user location mapping, and efficiency and risk metrics.
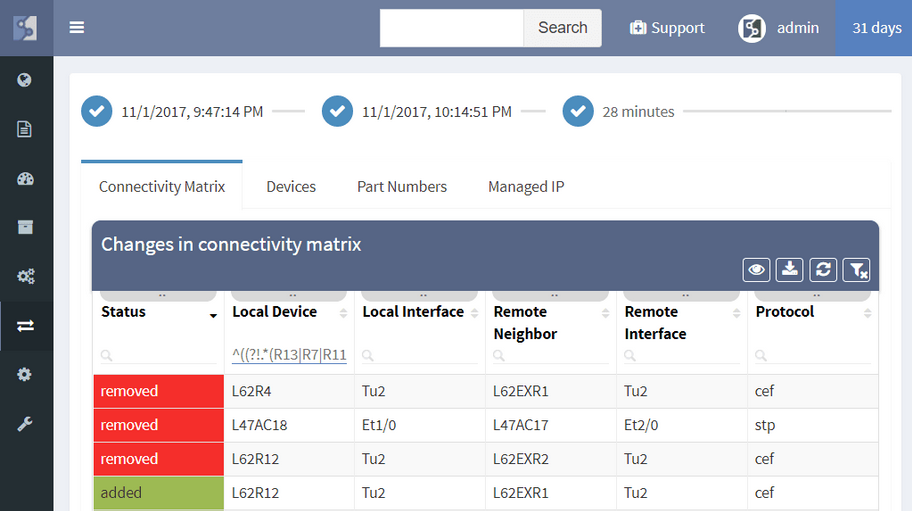
The IP Fabric platform now allows tracking of dynamic changes across the whole of network infrastructure, not just administrative changes in configuration. See whether someone reconnected a device, added a new device, swapped an SFP module, or standby router became an active one. Historical data from any of the two previous network state snapshots can be compared to find dynamic changes in the network, such as:
Administrative changes, or Configuration Management, is also available and shows when the last change on the device has occurred, allows to view most recent or historical configuration, or use the configuration to restore a failed device.
Diagrams have been significantly improved, enabling to zoom in from site overview to individual user. Diagrams allow to display or hide topology and protocols, collapse or expand links and layers, show wired and wireless users, and much more. One of the more important aspects is that topology can be saved, and that element position is unchanged throughout network changes.
While routers and switches are the backbone of any large network, it was clear that network engineers are interested in more than wired infrastructure. Support for Routers, Switches, and Firewalls was expanded with support for Wireless Controllers, Access Points, and IP Phones.
In a continuous quest to support all major enterprise networking technologies, the analytics support for Routing, Spanning Tree, Aggregation links, Link Layer, ACL, and Gateway redundancy have been expanded with QoS, StackWise, and Power Over Ethernet.
New driver system enables to add support for more vendors more easily. In addition to the Cisco IOS, IOS-XE, NX-OS, IOS-XR support, we have added:
To facilitate integration, we’ve transitioned to a single API which we use internally, and which can be used by users. The new version also features more granular TACACS controls, robust user management, encrypted channel for offline tech-support file handling, JumpHost support, and more.
We’re taking user feedback to heart. When it was clear, that IP awareness is needed for routing and host lookups, we’ve added it right away. We're continuing the trend of incremental improvements, and adding routing protocol overview, ACL entry port lookups, ACL options lookup and hit count, Interface rate to supplement rolling over counters, and many others.