
Slash MTTR from several days to just minutes.
Spending More Time Searching Than Solving?
Diagnose & remediate incidents in record time by querying IP Fabric’s application-aware model of cloud and network behavior.
Even occasional issues… can impact service quality. By creating dedicated intent checks, we can identify these conditions early and resolve them quickly.
Accelerate Root Cause Analysis
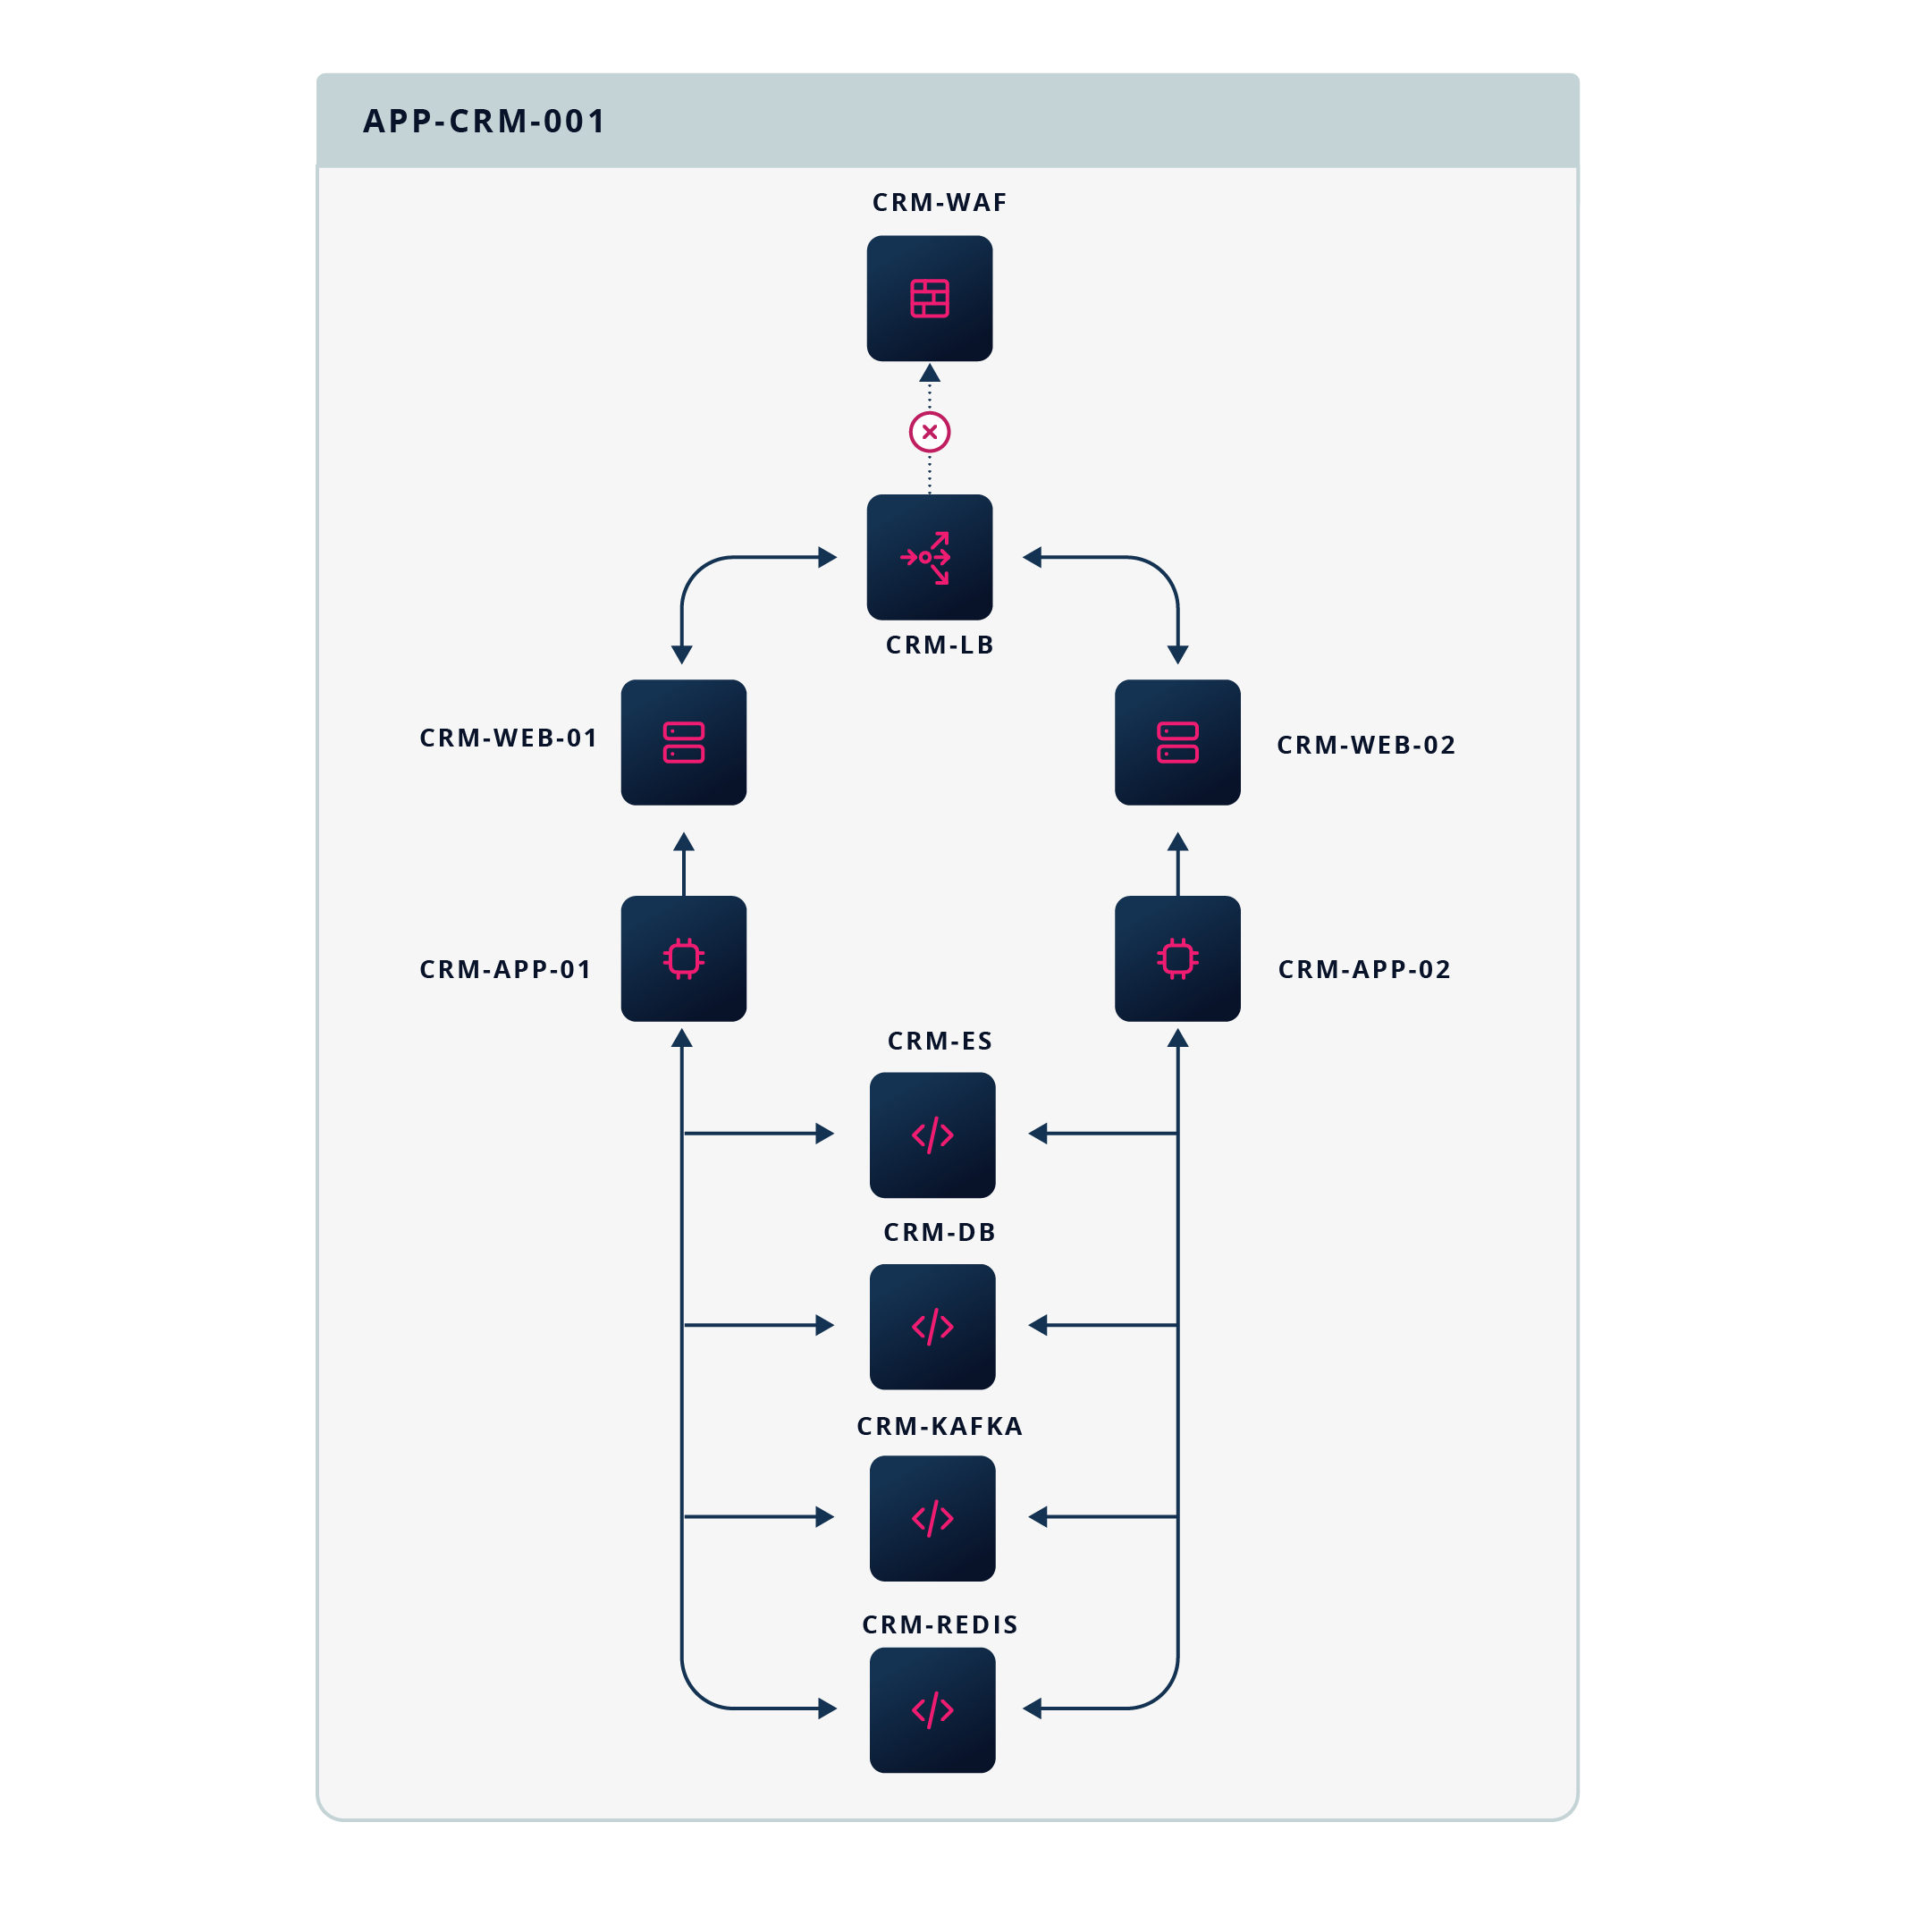
Pinpoint the exact cause of a blocked path by:
- Mapping application dependencies to network, cloud & host-level controls.
- Correlating SD-WAN underlay & overlay topologies.
- Checking NTP synchronization across devices.
- Pulling anomalies in BGP routing tables.
- And more.
Evaluate The Impact From End to End
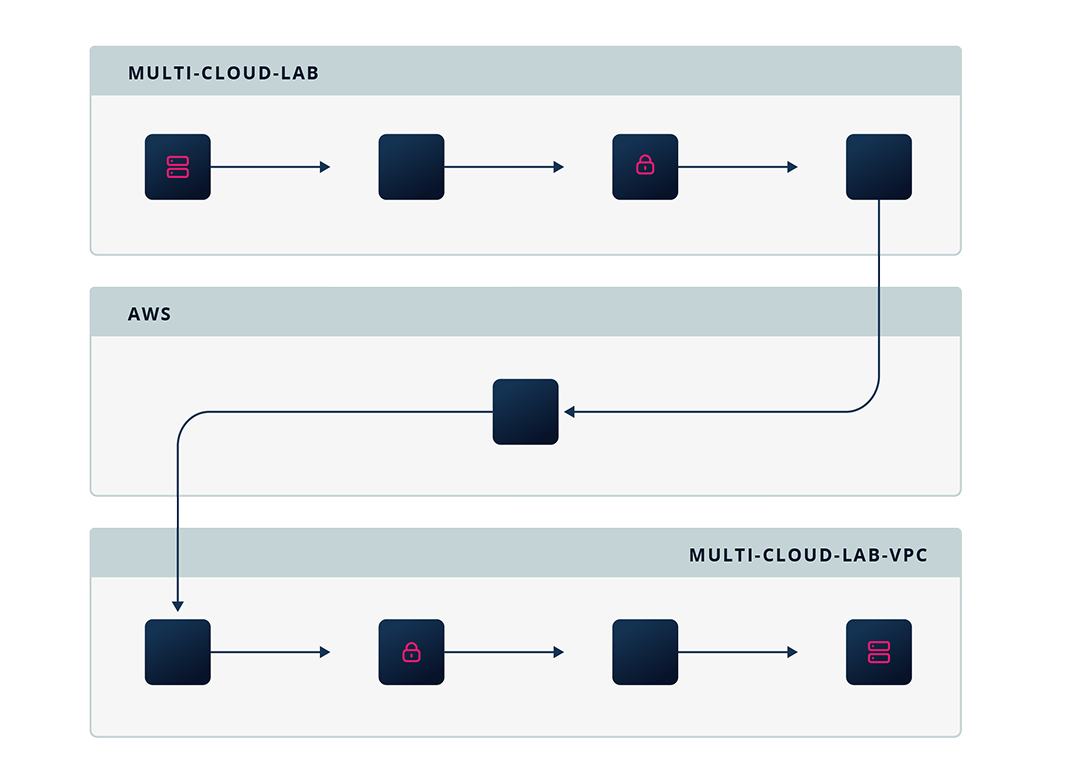
Trace end-to-end paths from on-prem and cloud environments to critical applications. Analyze these paths to:
- Determine the blast radius of an incident.
- Map the impact to applications & critical services.
- Identify any bypassed controls or exposures.
- Spot security & regulatory drift.
Automate Incident Reporting
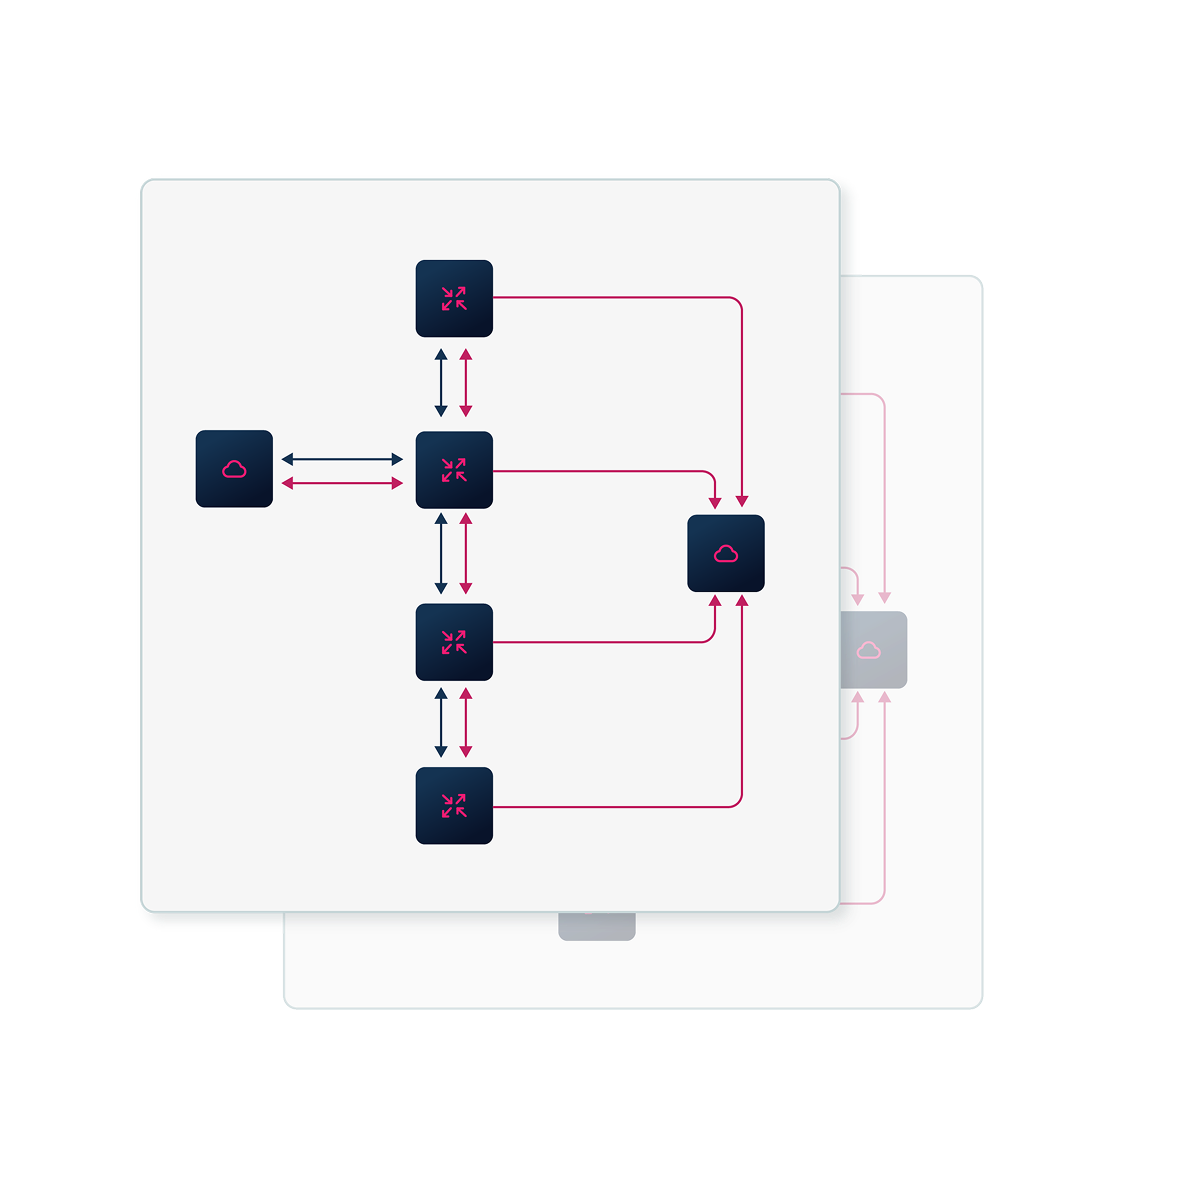
Compare historical snapshots before, during, and after the incident to:
- Verify that any changes were implemented as intended.
- Validate that security & regulatory controls are in place.
- Provide timestamped evidence of compliance during every phase of the incident.
Resources

Demo Video
Detect Shadow Rules With IP Fabric’s MCP Server
Surface all shadow rules across every device and policy. Get a structured PDF report with deterministic insights.

Downloadable
MCP Server Guide & Prompt Library
Get 10 expert-tested prompts to detect compliance drift, accelerate troubleshooting, and more.

Compliance Hub
Map Security & Regulatory Controls To Your Network
Explore how IP Fabric supports key controls across NIST, CIS, ISO 27001, PCI DSS, HIPAA, DORA, and NIS2.
FAQs
Yes, IP Fabric can run partial snapshots of any part of your environment in minutes.
Yes. Every snapshot is a timestamped record of your cloud and network behavior at that moment in time. Compare any two snapshots to see exactly which devices, configurations, or paths changed between them. These snapshots also double as a reliable reference for rollbacks.
Yes. IP Fabric makes it easy to share network insights with any team via GUI, API, and MCP server. All of IP Fabric’s network insights are vendor-neutral, so every team can stay on the same page during an incident. IP Fabric also does not charge by the seat, so you can share insights with any team, tool, or AI agent that needs them.
IP Fabric automates troubleshooting in three key ways:
- Taking snapshots of every device and dependency across network, cloud, and host layers.
- Mapping end-to-end paths from on-prem and cloud environments to critical applications.
- Sending webhooks to external tools, and populating ITSM tickets with deterministic insights.
All of IP Fabric’s insights are accessible through natural language queries via the MCP server. AI agents can also easily access this MCP server to inform their troubleshooting workflows.
Monitoring tools tell you what your network is doing right now, and observability tools tell you why your network is behaving the way it is. Network digital twin tools like IP Fabric tell you if your network is behaving the way you intend it to, surfacing any places where it doesn’t and giving you deterministic insights to guide remediation.
See IP Fabric in Action
Our expert team is here to help you get started.