According to one of the latest Gartner reports, only 5% of responders automate more than 50% of network engineering tasks. It seems that network automation has still a long way ahead to be fully embraced and become a vital part of any anchored strategy. It seems that for the majority of tasks in the network operations teams, the very first step is still waiting ahead - the data collection.
Every network automation process starts with data collection. That's all it takes to begin! It helps to kickstart the thought process, because why should anyone collect any data manually if the intent is to automate while using those data? And this mindset is important!
Before any automated change, we need to understand the network behavior so we can virtually simulate our intended impact. The most common tools for automation are Python scripts, Ansible, Jenkins, Netmiko, SaltStack, and more. But no matter what tool is used, the main goal remains:
The data collection process is an automation process with dilemmas on its own. It prevents many teams from starting the automation journey and the more complex the environment is, the more complex the first step is. The vendor diversity avoids the vendor lock, but it adds another layer of complexity. But it shouldn't be that way! If you ever wonder what the automation process may look like when the very first step is completely taken care of, then you are in the right place. The IP Fabric does exactly that. The data abstraction layer is all it takes to overcome this first step.
Juniper MIST is a cloud-based management service for Juniper devices including wireless APs. It can manage even standard “Junos” devices like SRX firewalls or EX switches that are already supported in IPF - the main benefit is that it brings Juniper wireless APs support to IP Fabric.
Like Meraki or Ruckus even MIST, the API doesn’t provide all the required details that we can get directly from the device via CLI (SSH/Telnet). From the API, we are not able to collect ARP or usable STP information for the path simulation process. The topology maps will be limited but will be available if IP Fabric discovers the switches that connect MIST Wireless APs (and if LLDP is enabled).
We had to limit the scope of MIST-based discovery to only wireless APs, otherwise, we could end up discovering e.g. SRX firewall via MIST which would result in overwriting data discovered via SSH.
The Ruckus Virtual SmartZone is an NFV-based and cloud-ready WLAN controller for service providers and enterprises ready to elevate their WLAN deployment to the next level of flexibility, resiliency, and scale. For IP Fabric, it is a new supported vendor discovered over API. Ruckus API is used to discover wireless access points and clients. (There is also the possibility of discovering switches, but it has not been tested in our environment yet).
Cisco is leaving VSS technology and moving towards StackWise. StackWise Virtual (SV) combines two switches into a single logical network entity from the network control plane and management perspectives. It uses Cisco IOS® Stateful Switchover (SSO) technology, as well as Non-Stop Forwarding (NSF) extensions to routing protocols, to provide seamless traffic failover when one of the devices fails over. To neighboring devices, a StackWise Virtual domain appears as a single logical switch or router.
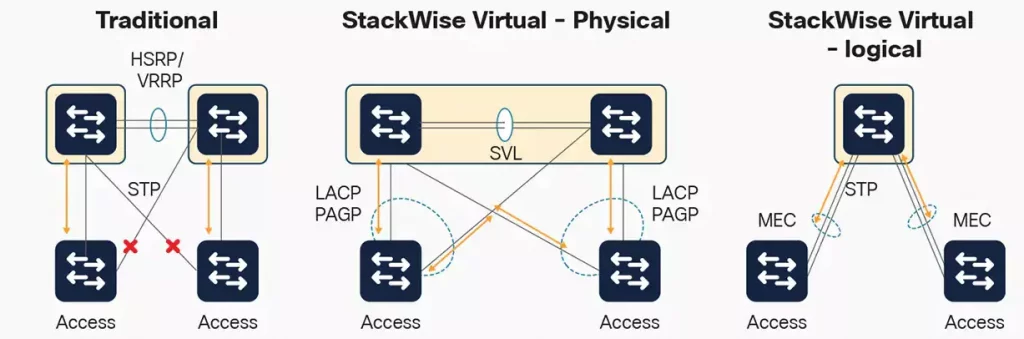
We are adding support for StackWise Virtual which is an extended replacement for VSS on some newer Catalyst 9K family switches.
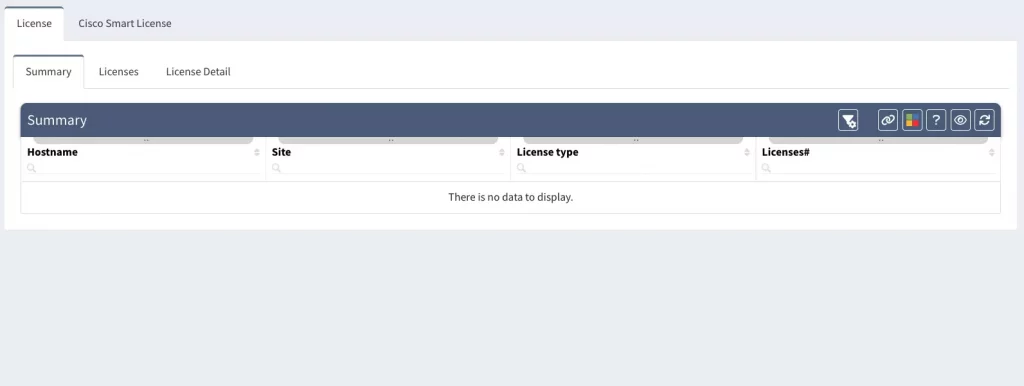
With different types of licensing for Cisco products, we have had a certain amount of requests to collect data to help our customers to get better oriented. Starting version 4.4.0, we are now collecting information about Cisco licensing with the new IP Fabric task. The primary command is 'show license (all)', which provides enough information about standard or smart license data. As a result of the new command, we have two new sections under Technology > Management: License and Smart License.
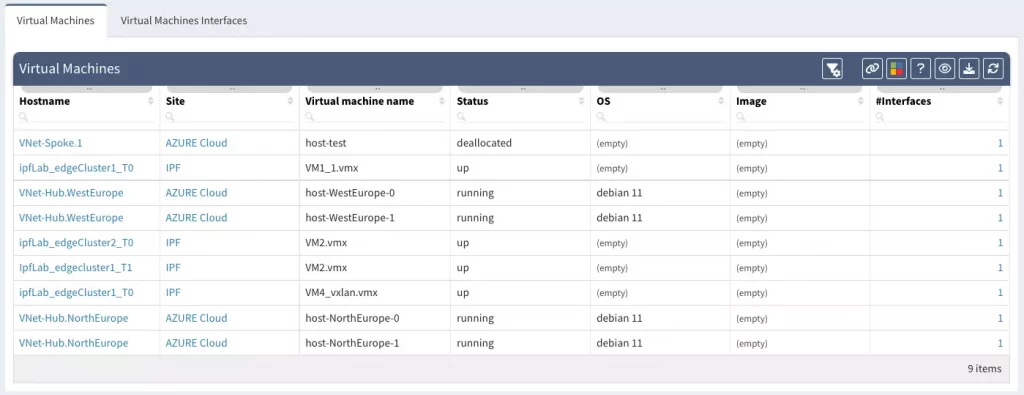
IP Fabric development effort around public or private cloud intensifies. In a traditional environment, servers and the network are usually two separated entities in terms of management. To successfully gather information about servers, you need to log in and get it, there's no way to collect it from the gateway (except for ARPs, MACs, and DNS records). That doesn't apply to the cloud. In general, public or private clouds' APIs provide more information about virtual machines. On the other hand, they might not provide network-level information we use for hosts calculations (ARP, MAC table).
That's why we decided to provide new tables with detailed information about cloud virtual machines including their interfaces. More at Technology > Cloud.
If you have found this article helpful, please follow our company’s LinkedIn or Blog, where more content will be emerging. If you would like to test our solution to see for yourself how IP Fabric can help you manage your network more effectively, please schedule a demo with our team: Request a Demo.
Week commencing 1st June 2020, and another minor release - IP Fabric 3.5.2 - is ready for deployment! Let's sum up what the latest release has to offer.
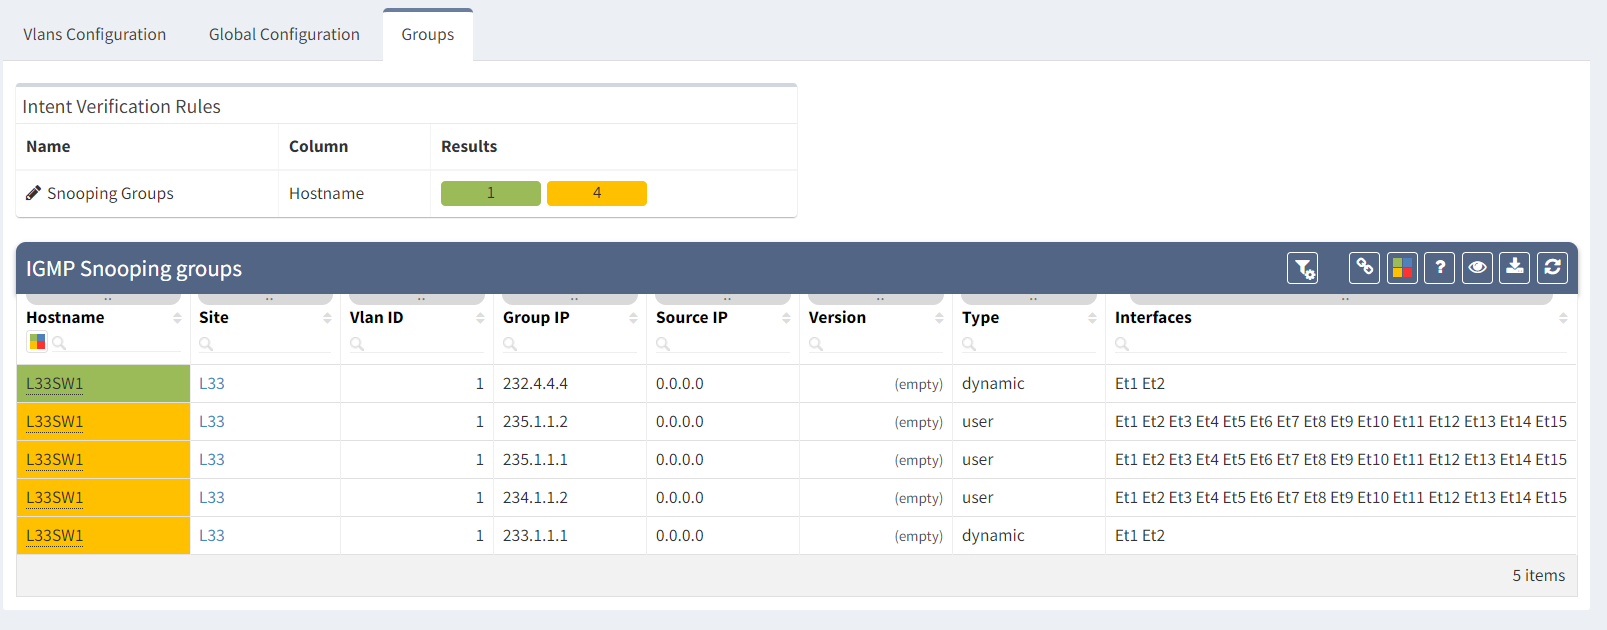
The 3.5 version started with multicast support with routing capabilities and the impressive distribution tree simulation in diagrams. The new 3.5.2 release adds information about PIM Rendezvous Points (RPs) and IGMP Snooping state. Now engineers can fully analyze multicast forwarding across LAN and WAN. IGMPv2 and IGMPv3 protocols are supported on multiple vendor platforms.
The Cisco Firepower support was introduced in mid-2019 with basic discovery features. IP Fabric version 3.5.2 is a significant milestone in the Cisco Firepower platform capability. We have now introduced full support for AAA, ACLs, NAT, and Object Groups, to mention but a few features.

Security is inevitably a critical part of any infrastructure and we continue to develop IP Fabric's capabilities in that area. On the roadmap for later in 2020 is a major release to address network security specifically. Expect to see significantly enhanced support for other vendors' firewall platforms, and for new network security features in general!
IP Fabric discovery is already fast, but we feel we can always make it faster! Up to now, every time IP Fabric created a snapshot it automatically attempted to discover any new nodes beyond those it already knew about.
In version 3.5.2, you can now limit a new snapshot to only update already-discovered network devices. This prevents IP Fabric from firing up the discovery algorithm that detects new devices on the network. This capability of locking the discovery scope is a huge improvement for large scale networks. Let's see how it works.
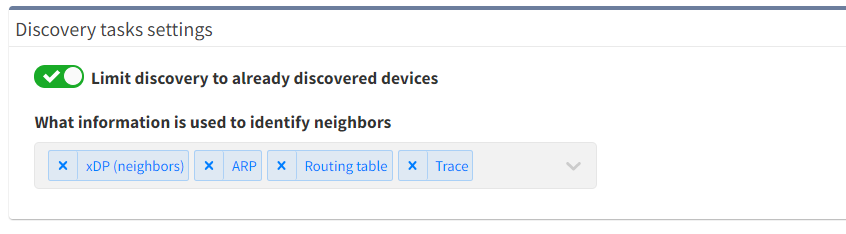
Previously the standard discovery process started with already-discovered devices. IP Fabric would then attempt to connect to unknown endpoints using the discovery algorithm.
As of version 3.5.2, if we know that our inventory is complete, we can simply tell IP Fabric not to search for new nodes. This prevents the system from spending additional time on testing more and more IP addresses as possible new devices. We then enable the discovery of new devices when we know that changes have been made. Alternatively, we use it when we're explicitly wanting to check our online inventory is up to date.
Note that we can now also modify the methods that the discovery algorithm uses to find and identify neighbors in the topology. This is helpful for optimizing the discovery, for example, if we are certain, that one of the methods is not supported in our network devices or is not configured.
In 3.5.2, you can also see our commitment to continue to improve support for multiple network vendors. Changes to feature support and improvements are evident for:
More details at IP Fabric Release Notes.
There are some BIG updates coming over the next couple of major versions in the platform, due over the coming months. Keep coming back to wordpress-625423-2416527.cloudwaysapps.com and follow IP Fabric on LinkedIn for more information as it drops!
Good news everyone, another version of the IP Fabric platform is officially out. We have added more freedom to users in terms of platform configuration and above all, the intent-based network verifications can now be visually represented directly in the diagrams.
This greatly helps in many scenarios when specific part of the network is of interest. For example, one of the frequent scenarios in troubleshooting is finding an issue on the path. Now all paths between any two endpoints can be visually verified for a presence of an issue in an instant.
This includes paths with significant complexity, such as paths including Stack, FEX, vPCs, VXLANs, WAN accelerators, Lightweight Wireless and others.
Imagine troubleshooting a path for a performance issue, and trying to narrow down a problem, because it’s not feasible to check everything at once. Techniques such as resolving a balancing hash for a particular flow were utilized to know which link to focus troubleshooting on. These techniques were necessary to narrow down the issue, but not in finding the underlying cause. Well, now it is feasible to check all path elements at once, and see all affecting issues.
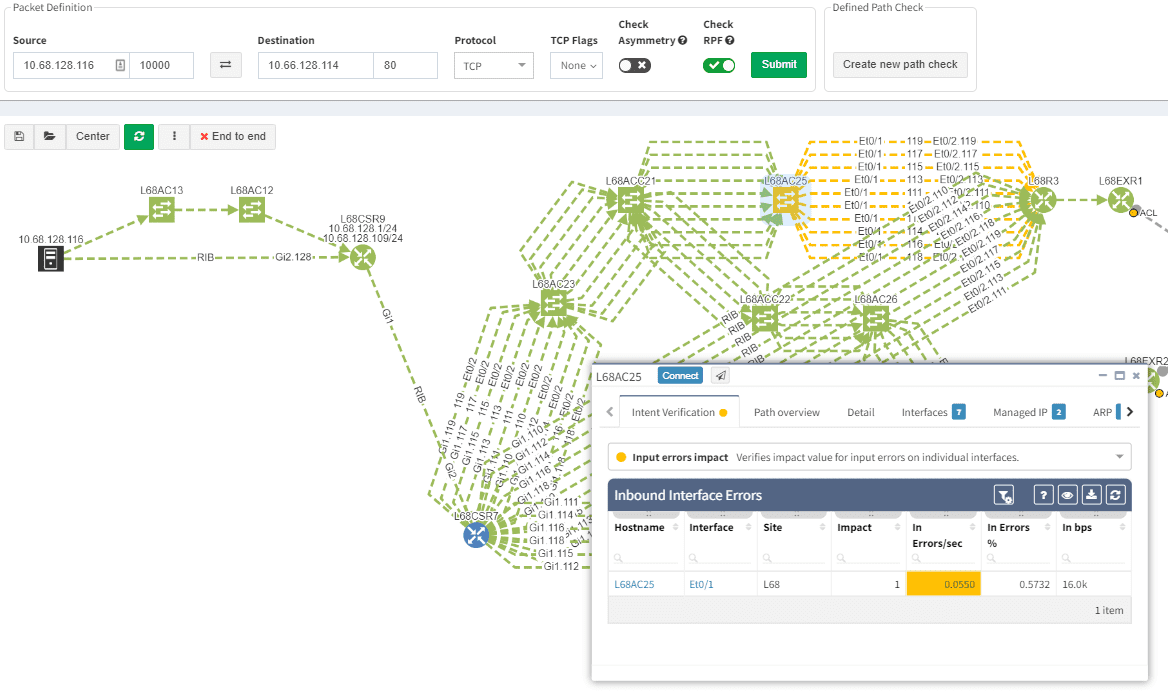
Now it’s even possible to “Check everything at once”. Not surprisingly there will be a lot of red.
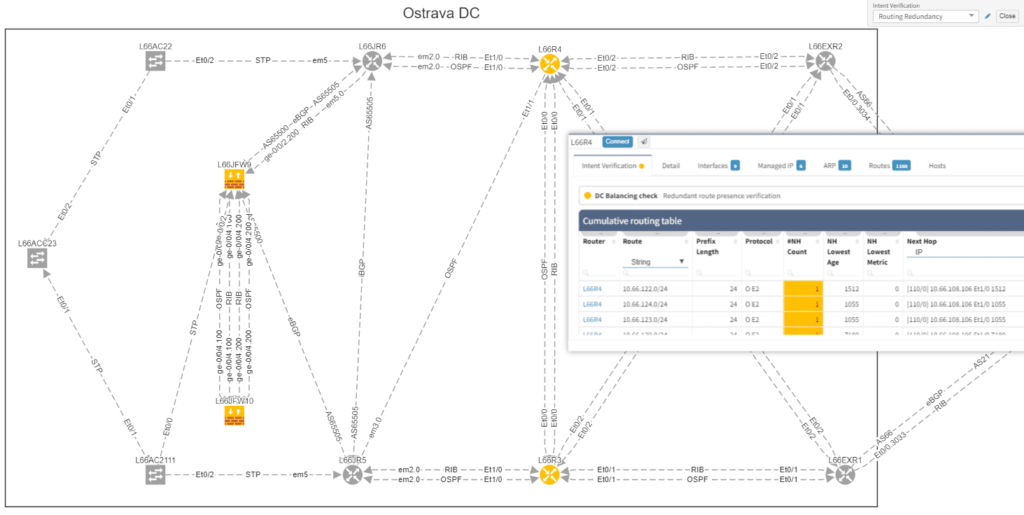
Of course, any intent verification group can be displayed separately. For example here we want to see only specific routing table entries which have routing redundancy issues in our datacenter.
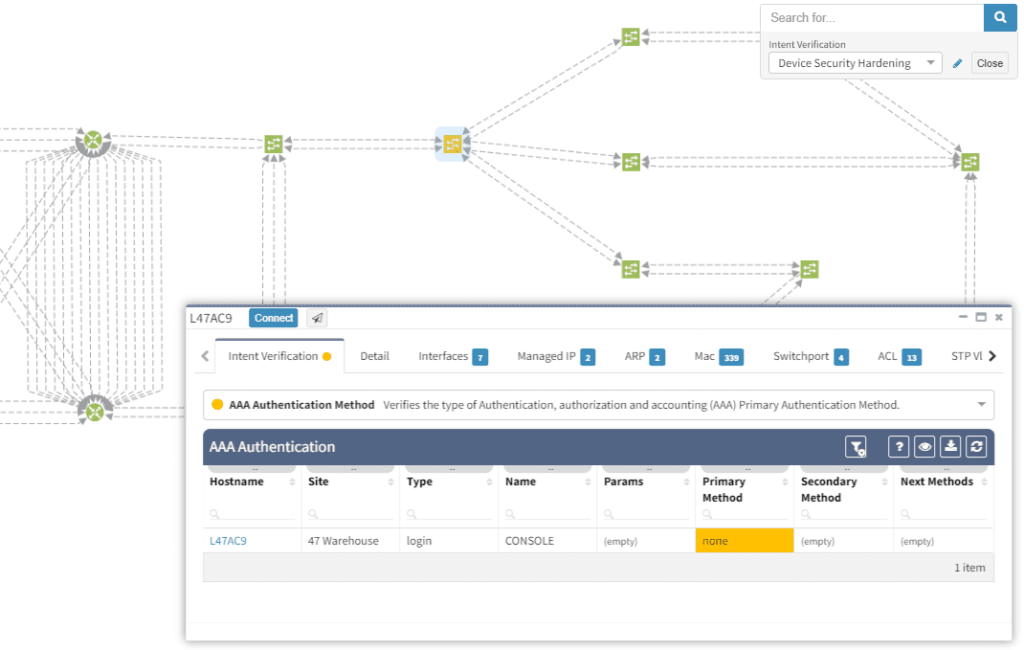
Or here we want to visually verify device security hardening for compliance checks, and suddenly see that one of our devices has AAA Authentication configured with method "none" allowing privileged access without any authentication.
Visualization is available for any type of Intent verification, and can be combined with visual snapshot comparison. Here we verify neighborship compliance, and once we see that there is an issue with OSPF neighbors, we compare Monday's network state with the network state at Sunday, to see if the network has changed.
This visual issue representation is available for any type of Intent-Based Verification which can be associated with a link or a device.
The intent-based networking (IBN) or intent-based verification (IBV) buzz word has been around quite some time. However, to this day, not every engineer from security or network operations is familiar with the concept. Apart from that, people with diverse backgrounds may have a different understanding of the approach.
The goal of any computer network is to transfer information based on multiple variables. The Intent-Based Networking (IBN) is focused on network automation and better aligning networks with operational goals or 'intent'. Intent is what we want networks to do. It differs from classical monitoring goals in that we can express advanced operational concepts or even business goals. In classic monitoring we might have checks such as "IP address X must be reachable" while 'operational intent' could be "Authorized users must be able to redundantly reach application servers".
Verifying reachability via ICMP from the monitoring center is one thing, but verifying specific path availability and parameters from a specific set of sources to specific set of destinations is significantly more complex and has usually required a lot of manual effort to complete. This is extremely important to understand, because 'intent' advanced next level of visibility and shifts operational notion from "up/down" to predictive analytics.
As networks move towards IBN, the IP Fabric platform is here to help automate a significant part of the process.
In the platform, we have already created the Assurance Engine that is capable of tracking protocol inconsistencies or providing feedback on network health. The IPF administrators have the power to create their own system-wide controlling mechanisms that fit their needs for IBN.
We decided to take this powerful feature to another level, and with version 3.3. we have introduced Intent-Based verification for the diagrams. Imagine you are viewing any available network topology or the end-to-end path, while you can apply any previously defined IBN rule directly.
In the new version, the platform collects and analyzes DHCP Snooping information for supported devices. The information includes normalized configuration and state, including trusted ports, option82 and the binding database amongst other parameters. You can find the new DHCP snooping tables at /technology/security/dhcp-snooping/configuration-v4 in the platform
The VLAN summary information is now compiled from the network specifically from VLAN point of view. Previously VLAN information was compiled and available only from point of view of the Spanning Tree Protocols, however VLANs without any STP association were not available in the platform. Now any VLAN that exists in the network can be found, analyzed, and visualized, even if it is suspended, broken, or exists on a single device without any STP capabilities. Definitive VLAN information can be found at /technology/vlans/device-detail in the platform
Detailed SSID radio information was already available for mapping each SSID on each wireless Access Point in the Network. This information was present for each unique AP-SSID pair, and therefore was inherently presented from the AP point of view. In this release we have added SSID summary table which provides information from the point of view of SSID, and should help in consistency verifications of SSID deployments in the network. The table is located at /technology/wireless/radios/ssid-summary in the platform
With a single double-click (all clap for an amazing self-contradiction) one can ungroup the links in diagrams. So far it was only available with the help of the 'group/ungroup' button in the protocols menu.
Every release we tend to update the vendor list per requests from our customers and IPF version 3.3 is not an exception. We’ve seen a somewhat surprising venture of Mikrotik platforms into enterprise environments, primarily for advanced routing and MPLS capabilities, so we have added support for the Mikrotik platform. Please keep in mind that Mikrotik routers require longer session timeout, otherwise they will be not discovered.
The Extreme routers and switches have been among supported vendors for some time but not the Enterasys devices which Extreme has acquired back in 2013. Starting with 3.3, the basic discovery has been added.
Discovery attempts to contact devices using Telnet or SSH, which is useful especially for very large networks or networks with significant history. There is always an occasional forgotten device with Telnet enabled which IPF platform could help to identify. However, not everyone is particularly happy by having Telnet sessions around with every discovery. In the new version, the Telnet can be disabled for discovery.
Transceivers on NX-OS platform are now available in the inventory, for the ASA the support for system-defined object groups was added and much more.
Big thanks to our supporting customers, who are constantly helping us to improve the platform. Full details of the release could be found in our Release Notes.
If you have found this article resourceful, please follow our company’s LinkedIn or Blog, where there will be more content emerging. Furthermore, if you would like to test our platform to evaluate how it can assist you in managing your network more effectively, please let us know through www.ipfabric.io.
For those who anticipated the new release of the IP Fabric platform, the wait is over. The IP Fabric version 3.2.0 is out. It has been a great journey so far and the platform keeps expanding coverage of network engineering use-cases as we're signing more and more international customers across various industries.
We are grateful for all those who support our vision of creating the purpose-built tool for network engineers and we are more than happy to support our customers back. The majority of new features are based on customer feedback.
The support for the Dell switches was added, which covers various system versions of FTOS (versions 8, 9) and PowerConnect (versions 6). The basic discovery is now fully supported and with the fresh release, the platform will explore new waters in a smooth fashion.
Cisco's Application Centric Infrastructure (ACI) is the industry-leading SDN solution, which facilitates agility and data center automation. Starting the IP Fabric version 3.2.0, engineers can now see detailed information about ACI's endpoints, VLANs and related Virtual Routing and Forwarding (VRF) instances. The next step would be enabling ACI paths for End to End path simulations and more.
Apart from those mentioned above, there's Flexible NetFlow support for Cisco devices, port-channel for Arista, stacking for HP Aruba switches and MAC address tables support on transparent VDOMs and software switches from Fortinet as well.
The topology maps are one of the most liked features on the platform. Always up-to-date diagrams and full flexibility with creating parallel views of any topology all together save a lot of time and effort for teams already.
Comparing topology changes was enabled already by switching the network snapshots and observing the output with a bright eye. The newly added compare feature is capable of highlighting any changes in network maps on demand.
The site separation allows to group one or more network devices into logical entities or groups. The platform can perform the site separation automatically based routing and switching logic, users can create custom Regex, which is applied to the host-names of devices and the site is defined from there and both options may be adjusted manually in dedicated technology table.
One more option was added though, the diagram's site separation allows users to drag & drop any device and move it from one site to another.
The ViewBuilder was introduced in the 3.1.0 version of the platform. It's the feature that allows users to create any customized view of their own custom network maps and break the boundaries in diagrams. With its intuitive interface, the network devices can form logical groups regardless of any protocol relationship among them.
With an updated interface, the topology building is faster than before. The 'expand' button will automatically add all connected devices and the 'collapse' button will remove all connected devices.
Data in the network snapshot doesn't have to be static. They can be refreshed on-demand from the Snapshot Management page or newly from diagrams directly. So if there's been a minor change to the network affecting only a small number of devices in topology or playing a particular role on the end to end path, there's no need in taking a new snapshot but only refresh data from a selected number of devices from diagrams directly.
IP Addresses in the Connectivity Report list can be rediscovered by a single click. In case of failed discovery due to authentication, connectivity or any other error, re-initiating the discovery was never easier.
Please unload and load any active snapshots after the platform upgrade. There have been a few minor changes related to API tables that may affect functionality. The VLAN ID or VLAN datatype was changed from string to number in following endpoints:
/tables/addressing/arp
/tables/interfaces/inconsistencies/details
/tables/addressing/mac
/tables/addressing/hosts
/tables/reports/capacity/hosts
/tables/reports/performance/users
/tables/spanning-tree/neighbors
/tables/spanning-tree/instances
/tables/spanning-tree/ports
/tables/spanning-tree/topology
/tables/spanning-tree/vlans
POST /start/discovery was replaced with:
POST /snapshots for starting a new discovery / creating a new snapshot
POST /snapshots/:key/devices for adding a new device
DELETE /snapshots/:key/devices for removing a device
So far only the enable password has had the privilege to have notes available. To differentiate among multiple passwords with the same username or simply to provide additional information for authentication, the passwords will have notes.
Starting 3.2.0, it will be no longer possible to view the Syslog messages in the tool. We didn't get rid of the Syslog server functionality completely, but from now on it's only narrowed down to the capability of re-initiating new the download of a newly available configuration file.
The more data the platform receive the more fine-tuned every new version gets. There have been few IP related updates for Arista and Cisco ASA and IOS, a couple of command updates for F5, Juniper and Checkpoint or Spanning-Tree information for Huawei switches.
More details about IP Fabric version 3.2.0 can be found in our Release Notes documentation.
If you are new to the IP Fabric platform, there's one great way of improving your skills with the platform and to get you fully enabled with our concept of enhanced network engineering. Check our upcoming webinars on our website!
If you have found this article resourceful, please follow our company’s LinkedIn or Blog, where there will be more content emerging. Furthermore, if you would like to test our platform to evaluate how it can assist you in managing your network more effectively, please let us know through www.ipfabric.io.
Good news everyone, another version of the IP Fabric platform is officially out. The 3.1.2 version is including minor improvements and small features that directly respond to multiple clients' requests.
Please be patient during the upgrade to IPF version 3.1.2. It may take longer than expected due to the migration of its ArangoDB from 3.3.19 to version 3.4.7.
From now on, it's possible to limit the number of concurrent sessions during the discovery process down to only 1 session at a time. Please be aware that having the platform manage only 1 session at a time will greatly slow down the discovery process for complex networks. Our team added this option for special cases or testing.
Starting with version 3.1.0, we added support for SNMP (CPU, RAM, storage, network) monitoring of the platform itself. With 3.1.2 it's possible to add multiple pollers.
Besides, the TLSv1.2 is now the only allowed HTTPS protocol. Further, IP Fabric has greatly improved the loading time of its Network Assurance Dashboard.
We improved parsing of outputs for multiple vendors, such as the command-line prompt detection for F5. Starting with version 3.1.2, the platform also supports the 4-byte Autonomous System number (ASN) for Border Gateway Protocol (BGP).
Few changes had to be done to complete the successful discovery for Link-Layer Discovery Protocol (LLDP) and Spanning-Tree in general for SRX and QFX series for Juniper. For the reason, that some of the SRX300 series rarely responded with an infinite loop output to command 'show ethernet-switching interface detail', it was completely removed from the discovery process. The VLAN and STP relations are now obtained with the use of the brief output only. Moreover, our update is completely preventing the problematic command on the SRX series.
In previous versions, we collected Syslog and other logging related parameters from 'show logging' command. This was causing unpleasant delays and plenty of unnecessary output. From now on this changes, the command is no longer used and parameters are obtained from the running configuration.
IP Fabric has killed the most annoying bug of July 2019 in a heroic battle. The hanging tool-tips from the Network Assurance engine were causing mild but undeniable headaches to the users and developers. Its artifacts were dispersed at an unknown location. Thanks to our brave developers!
Big thanks to our supporting customers, who are constantly helping us to improve the platform and the bug detection system. We have patched several issues for Arista EOS, Extreme XOS, Palo Alto, Fortigate, Huawei and Cisco ASA. One can find details in our Release Notes documentation.
If you have found this article resourceful, please follow our company’s LinkedIn or Blog, where there will be more content emerging. Furthermore, if you would like to test our platform to evaluate how it can assist you in managing your network more effectively, please let us know through www.ipfabric.io.
With a growing number of customers and requests, the initial plans for minor bugfix release have been expanded into a major release which improves upon nearly all aspects of the product. Here we'll cover the biggest changes in the major release of IP Fabric 3.1.0. Customers can upgrade the installation via the administrative interface by following the procedure in the documentation.
Before we'll go into detail of the changes, let me point out a few of them in the beginning. For visualization, the new View Builder provides the option to create a fully custom diagram views, new manual site separation enables to refine automatic site detection, and improved object manipulation helps to deal with complex diagrams. For vendor and technology support, we've added basic support for Cisco Firepower Thread Defense, added vDOM and Zone Firewall support for Fortinet Fortigate family, and added OSPFv3 support for multiple families. Additionally, we've added customization options for Network Analysis Report, revamped snapshot management, re-engineered backup and restore system and much more, so let's dive straight in!
Based on numerous requests and thanks to our network automation architects, the Cisco Firepower Threat Defense devices are now being supported to complement our ever-expanding portfolio of supported network technologies and vendors. For now, only the basic support has been added as we're exploring use cases with this innovative platform.
The support for the Fortinet FortiGate family was expanded from basic discovery to support Virtual-Domains (VDOM), Zone Firewalls, and Port-Channels. This support has also made into network simulations expanding End-to-End path mapping capabilities with the security layer for this platform.
As more customers are working with IPv6, we've also added support for OSPFv3 for both IPv4 and IPv6 address families. Both technology tables and diagrams now have distinct OPSFv3 options, which include both IPv4 and IPv6 families.
With new released version 3.1.0, we introduce the View Builder. The ultimate feature that allows users to create any customized view of their own topologies and break the boundaries in diagrams. With its intuitive interface, the network devices can form logical groups regardless of any protocol relationship among them. If there is any protocol session between devices, the builder enables to crawl topology further expanding the view. If there is not any relation, the device still can be added manually by clicking the add device + button. The view builder is available through the tools menu in any of the diagrams (three dots).
From now on, it is not possible to save the backup data on the same file system where the platform resides. New partition has to be created to save the backup locally. If there's no secondary partition detected, the platform will not let the user save the backup. More information related to new options is available in our online documentation.
Notably, the Discovery and Snapshot Management pages were merged together. This was a logical step for the platform. We had the Discovery and the Snapshot Management on separated pages, however, every new discovery creates a new snapshot. Now it is much easier to navigate and manipulate with snapshots.
Another great news is for API documentation! From now on it's not only available online in the official documentation, but it is also included in the platform itself. At every one of the technology tables, we can now view related API details. This should make it easier to integrate the IP Fabric platform with any other management system.
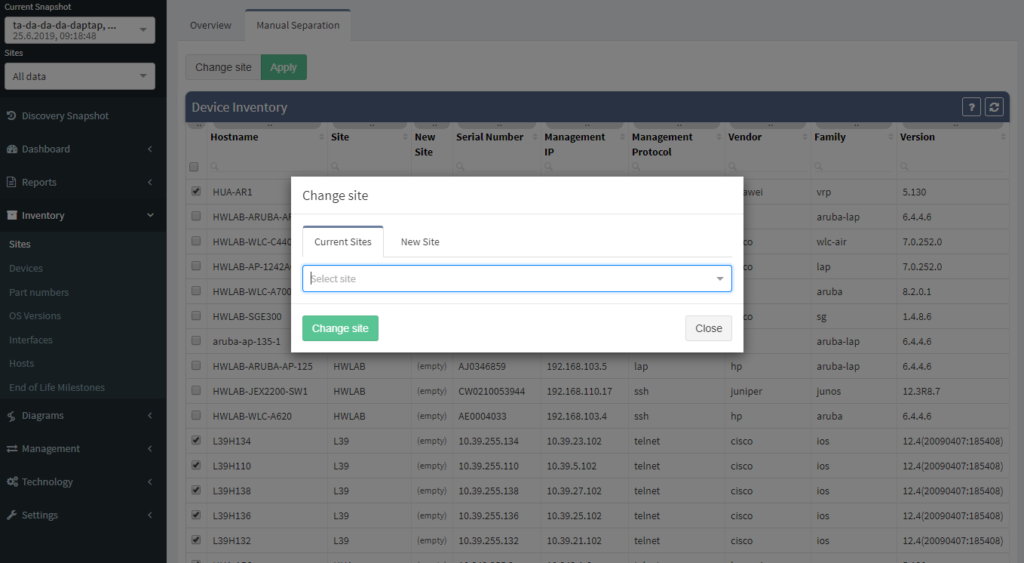
One of the most awaited features is undeniably the Site Separation update. It's only the first step, but the Manual Separation is available in the Inventory - Sites technological table. The logic is that the user would let the system separate the sites automatically and would then use the manual site separation option for fine-tuning and minor corrections through the inventory.
The network verifications are a pivotal part of the IP Fabric platform which enables a proactive approach to network management by uncovering hidden issues that might result in the outage or issue in the future. All network verifications within the IP Fabric platform have been refined to better serve their purpose and we've added descriptions to all of them.
All network verifications that are in the platform by default are still fully customizable and users can create their own of any type and include them in the main Dashboard.
In addition to this update, we've enabled customization of the Network Analysis Report document to reflect the changes and any customizations in the Dashboard, so that the report now includes the result of all verifications, including detailed descriptions of the issues.
This big change also meant any previous dashboard customizations are removed due to the difficulty of migration of old checks without descriptions to new checks with descriptions. Underlying verification definitions have remained in place, so it should be a matter of a few clicks to re-add them, and we'll be happy to help you in case you've lost track of the dashboard customizations.
End to End path simulation continues to be one of the key components in Intent-Based Network Analytics and an important use case of our platform. End-to-End path simulations verify the forwarding and security of any communication pair for every snapshot through our network model in mere milliseconds.
Since we've added support for Fortinet security policies, from now it's possible to verify both forwarding and security policies of Fortinet Fortigate equipment through vDOMs within the End-to-End path forwarding check.
There were a number of refinements to forwarding decision calculations in the network model and updates to the visual representation of the path. For example, MPLS links are now displayed based on the presence of the label stack to help to differentiate where the label is popped through PHP and where it is added.
To read more about individual changes that did not make it into the announcement, you can take a look into release notes.
If you have found this useful, follow our company’s LinkedIn or Blog, sign up for one of the Webinars, or request demo or trial to see how the platform can help you to manage your network infrastructure more effectively. For more information or to contact us please visit www.ipfabric.io.
In this post, we looked at the network discovery process overall. Here, we'll dive into how exactly automated network assurance can change this process. Traditionally, you'd rely on a time-consuming manual process that will result in a High-Level Design (HLD) document, Low-Level Design document (LLD), access credentials, a list of devices with access information, and more. However, the IP Fabric approach can flip how you view this necessary information. Are static documents really an effective way of documenting a large and complex enterprise network? Why not rely on dynamically updated documentation that comprehensively captures your network state at a point in time, using no hours or effort from your engineers?
To contrast two methods of discovering the network - manual vs IP Fabric - let's use a simple High-Level Design doc as our case study. We'll assume:
Now that we have all the information we need, let’s start discovering the network.
Please note that this whole lab is virtual and based on the IOL devices; therefore the switch is identified as “linux_l2” and router as “linux-l3.”
So that we can see how beneficial IP Fabric is, we’ll need to go over the traditional manual method of discovering a network.
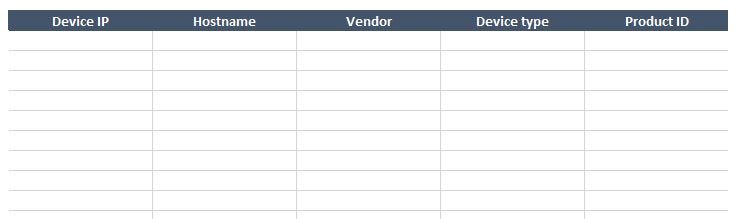
The manual method is an old concept that shouldn’t be used on the kind of networks we’re dealing with — large and complex networks. However, it may very well be the method you're stuck with today. To start, use a device list that looks like this:
After that, we need to log into the first known device so that we can connect with other devices, starting with the ones closest to the center. Use commands to:
Every node needs to be checked, and every adjacent device should be noted for later examination. The short video below shows the beginning of this manual process.
It’s blatantly evident that this approach is very time-consuming and isn’t feasible for large, complex networks. When creating a proper network diagram, all active interfaces need to be documented, and each device needs to be drawn in relation to neighboring devices throughout the whole network.
Your mileage may vary, but analyzing all the active nodes and filling out the table above took us approximately 45 minutes, drawing the network diagram took somewhere around an additional 30 minutes.
Today, businesses see the value in automating repetitive tasks to save time, which in turn cuts costs. There are plenty of methods that can be used to simplify the network discovery — you could, for example, use your own scripts and very simple tools like NMAP or BASH scripting, then use some management protocol, like SNMP (shown below).
The example above shows two phases — getting the IP addresses, then gathering the specific data from these SNMP-activated hosts through a simple script.
Compiling a list of active devices with a specific IP can be done a few different ways — you can ping the entire subnet (as the HLD stated all the IP addresses are from the 172.16/12 subnet), or you can use a Nmap command can make it more effective.
root@tom-linuxmint:~/lab# nmap -sn -n --host-timeout 2s 172.31.100.0/24 | grep Nmap
Starting Nmap 7.60 ( https://nmap.org ) at 2018-12-31 08:58 CET
Nmap scan report for 172.31.100.1
Nmap scan report for 172.31.100.2
Nmap scan report for 172.31.100.3
Nmap scan report for 172.31.100.4
Nmap scan report for 172.31.100.5
Nmap scan report for 172.31.100.6
Nmap scan report for 172.31.100.7
Nmap scan report for 172.31.100.8
Nmap scan report for 172.31.100.9
Nmap scan report for 172.31.100.10
Nmap scan report for 172.31.100.11
Nmap scan report for 172.31.100.51
Nmap scan report for 172.31.100.52
Nmap scan report for 172.31.100.53
Nmap scan report for 172.31.100.54
Nmap scan report for 172.31.100.55
Nmap scan report for 172.31.100.60
Nmap scan report for 172.31.100.61
Nmap scan report for 172.31.100.62
Nmap scan report for 172.31.100.63
Nmap scan report for 172.31.100.101
Nmap scan report for 172.31.100.102
Nmap scan report for 172.31.100.103
Nmap scan report for 172.31.100.104
Nmap done: 256 IP addresses (24 hosts up) scanned in 2.02 seconds
This method uses ICMP echo without any protocol probe (TCP/UDP), so a much better and more effective way would be to check some specific protocol availability. For example, TCP/22 and TCP/23 can be used to test the Telnet and SSH port and UDP/161 to check SNMP port, as shown below:
root@tom-linuxmint:~/lab# nmap -sU -p 161 172.31.100.0/24 | grep Nmap
Starting Nmap 7.60 ( https://nmap.org ) at 2018-12-31 10:20 CET
Nmap scan report for 172.31.100.1
Nmap scan report for 172.31.100.2
Nmap scan report for 172.31.100.3
Nmap scan report for 172.31.100.4
Nmap scan report for 172.31.100.5
Nmap scan report for 172.31.100.6
Nmap scan report for 172.31.100.7
Nmap scan report for 172.31.100.8
Nmap scan report for 172.31.100.9
Nmap scan report for 172.31.100.10
Nmap scan report for 172.31.100.11
Nmap scan report for 172.31.100.51
Nmap scan report for 172.31.100.52
Nmap scan report for 172.31.100.53
Nmap scan report for 172.31.100.54
Nmap scan report for 172.31.100.55
Nmap scan report for 172.31.100.60
Nmap scan report for 172.31.100.61
Nmap scan report for 172.31.100.62
Nmap scan report for 172.31.100.63
Nmap scan report for 172.31.100.101
Nmap scan report for 172.31.100.102
Nmap scan report for 172.31.100.103
Nmap scan report for 172.31.100.104
Nmap done: 256 IP addresses (24 hosts up) scanned in 3.96 seconds
Nmap is checking to see if the UDP/161 is open or not since there isn’t any SNMP specific check with the community or version test. These outputs are returning the same set of IP addresses, but in the real network, these lists can be different since not all active devices can be managed through the SNMP.
This BASH script uses the previous list of devices as an input data and processes each item as follows:
#!/bin/bash
filename='lab-active-devices'
echo Start
while read p; do
  if snmpget -v2c -c labnet $p iso.3.6.1.2.1.1.1.0 | grep -q 'Cisco'; then
    vendor="Cisco"
    hostname=`snmpget -v2c -c labnet $p iso.3.6.1.2.1.1.5.0 | awk '{print $4}'`
    ios=`snmpget -v2c -c labnet $p iso.3.6.1.2.1.1.1.0 | grep Software | awk '{print $9}'`
  fi
  echo "$p, ${hostname:1:-1}, $vendor", ${ios:1:-2}
done < $filename
The only function executed is checking SNMP OID for sysDescr to test if it’s a Cisco device or not. It can be extended for other vendors if needed, but it’s enough for this lab to distinguish between a Cisco and non-Cisco device. The function then uses sysName for the device hostname and again uses the sysDescr to get the IOS version. This approach is used only for this demonstration as an illustration on how to use SNMP framework and simple scripts — the key is to know what to get and how to represent it using known tools like scripting or post-process editing tools, (like office tools, for example).
The same mechanism can be used to create a network diagram, but the Nmap should check the whole IP space, and the scripts should access all of the devices, analyzing the directly connected subnets. Pairing the devices within the same subnets creates the baseline for the network diagram and should be extended with specific IPs and interface names.
Using this process, this list of devices was created in just five minutes (instead of the 45 minutes it took compiling it the manual way). Creating scripts to gather all of the data for the network diagram took around five more minutes, and the topology was built in approximately 25 minutes.
Network discovery can be completed by a few tools that already exist, but so that you can understand the unique benefits of IP Fabric's platform, let’s take a look at the tool’s incredibly easy setup and deployment process. To get started, all you need to do is enter the credentials IP Fabric will need to access the network devices, and supply a few other details for use during the discovery process.
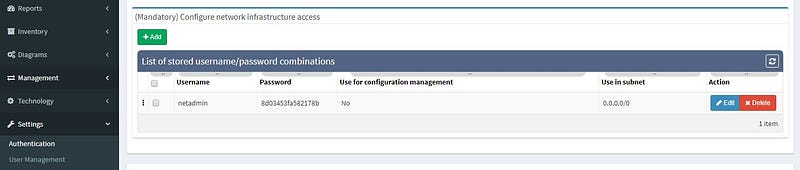
If you’d like, you can set additional parameters. We’re going to use these in our example:
Once that’s done, hit the play, sit back, and watch IP Fabric get to work (example shown below).
The entire process is automatic, without any interaction from you needed, and IP Fabric saves all data that it generates for further analysis and graphical presentation.
The first part of the results that you should check is the inventory list (shown below). Compare the list IP Fabric generated to the one you created manually, to see if any differences exist. It shocks many users when they see results on the IP Fabric list that escaped their eye when they built the list manually.
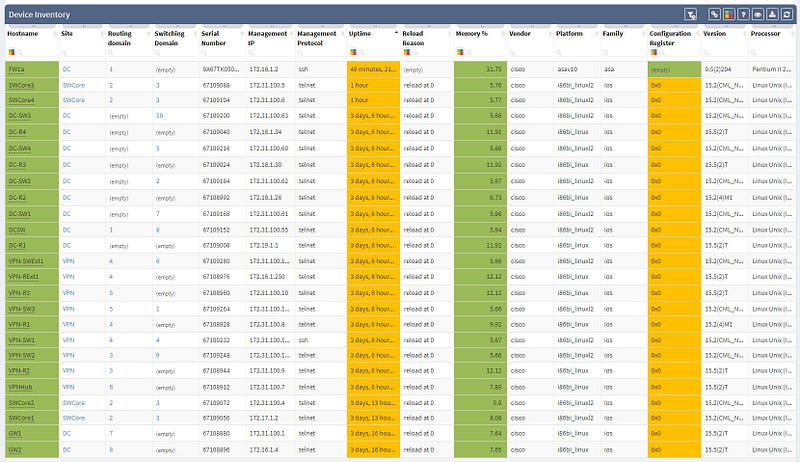
As you can see, the list shows a significant amount of network device details, including vendor information, management IP address, software version, and even additional information like uptime, memory usage, etc. Not only does this help us validate our assumptions, but it provides additional helpful information, which helps expand our knowledge base.
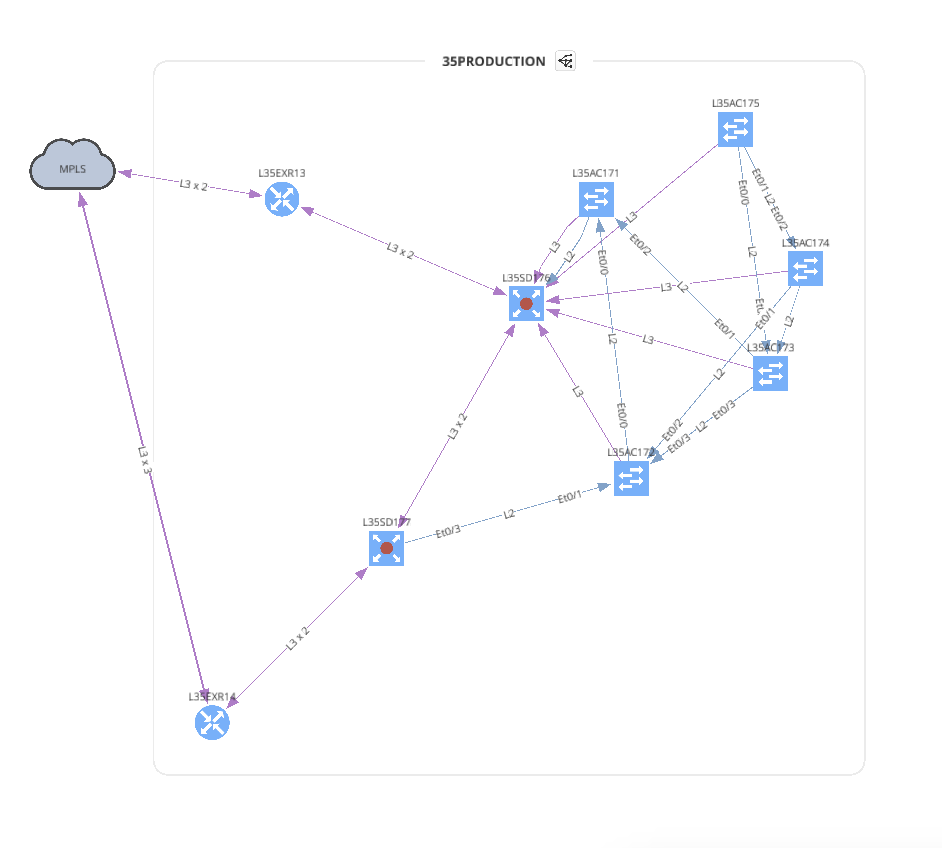
The next part of IP Fabric’s results that you should check is the network diagram graphic.
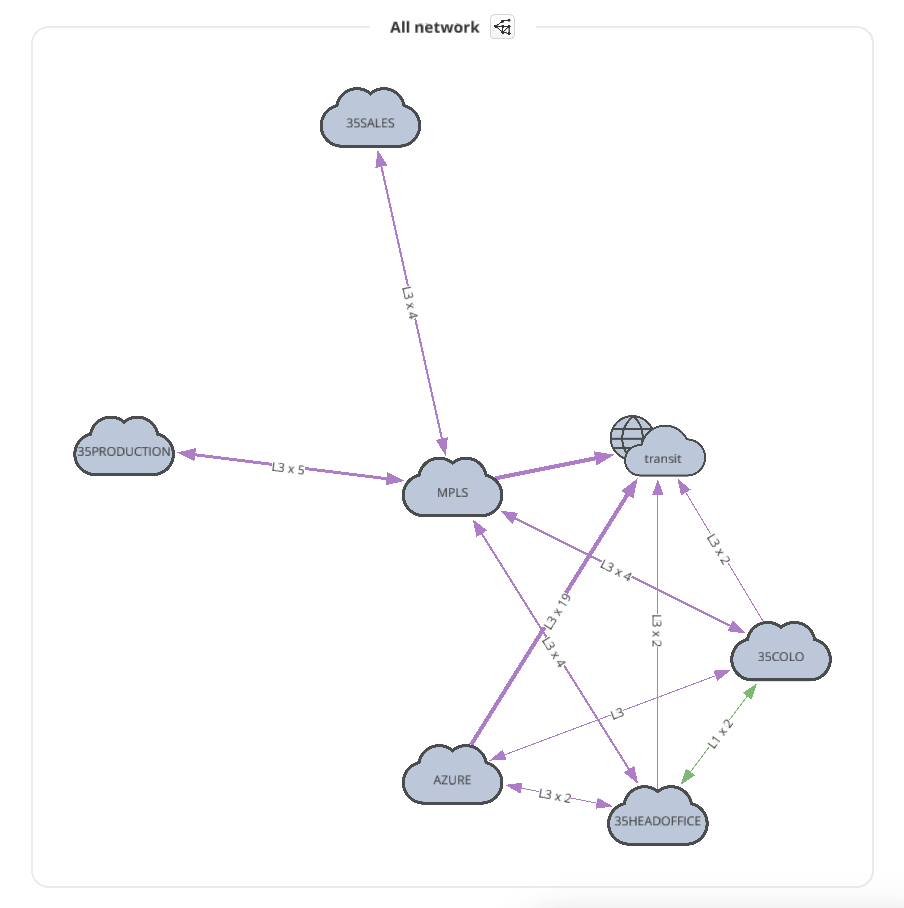
The diagram visually groups the devices based on site name (you can adjust the site naming convention in the discovery settings with regexp string). It’s not a diagram of the practical look of the network, but IP Fabric offers ways of modifying the diagram by clicking the cloud images, hiding site boundaries, showing (or hiding) the L2/L3 connections, etc. With these features, you can use IP Fabric to create a diagram closer to the real topology, like the one shown below.
Now that we’ve covered how quick and easy it is to deploy and use IP Fabric, making it the obvious choice when discovering unknown networks, you’re ready to try it out for yourself.
Lastly, we’re going to delve into more great ways that IP Fabric can help simplify your work life, so keep an eye out for more parts of this series.
To learn more about how IP Fabric’s platform can help you with analytics or intended network behavior reporting, feel free to get in touch with the team, or try our self-guided demo!
Today, we are pleased to release the new version 2.3.0 of IP Fabric platform. This release assists engineers in having a more complete overview of their network by adding support for additional technologies that are especially seen in Internet Service Provider and enterprise Internet Edge environments — Multiprotocol Label Switching (MPLS), Port Mirroring and Network Address Translation (NAT). We have again improved usability of graphs, that now support site renaming directly in graphs and also support visual separation of site interconnects from the general transit clouds.
Frequent feature request from Internet Service Providers and Enterprise customers as well was Multiprotocol Label Switching (MPLS) support. In this release we are adding full support for Label Distribution Protocol (LDP), where we provide the network operator with detail about configured interfaces and what are the LDP neighbor relations, and we also provide with global network MPLS Forwarding Table that is very similar in function to a global routing table we have already. The MPLS is of course supported in graphs as well.
Network Address Translation is pretty common in the enterprise Internet Edge service block and particularly in ISP networks to “sort out” their IPv4 address exhaustion issue. Today we are releasing support for Network Address Translation rules, to give you full End-to-End visibility and packet behaviour.

To support traffic recording efforts of our clients we are introducing support for port mirroring overview and configuration verification. Regardless if the technology used is Switched Port Analyzer (SPAN), RSPAN (Remote SPAN) or ERSPAN (Encapsulated Remote SPAN), we are supporting the overview tables including all the low level details like ACLs applied to the monitoring session or QoS used for the mirrored traffic.
The graphs are definitely one of the most used functionalities of our product. Many of our clients inquired for the functionality to be able to rename sites in easier way and we are now supporting renaming of site directly in the site diagram.
To get better overview about how the specific sites are interconnected, we are now introducing the separated transits for other sites in the diagrams. This way you will be able to find out what is connected to what much faster than before.
When the graph is opened through the hostname link in any table, it will zoom automatically to that specific device.
There are couple vendors out there that are using for their devices Organizationally Unique Identifier (first half of MAC address specific to vendor) that are belonging to other companies. This was causing issues during device discovery as our platform is connecting to well-known vendor OUIs, because we don’t want to log onto everything in the network, but just the network devices. However if you happen to have a device with special OUI portion in its MAC address, this is no longer an issue and you can override the default behaviour and select the MAC addresses, that are relevant to your environment.
We have worked hard on improvements in datacenter portfolio, where we improved support for Cisco Nexus Fabric Extenders (FEX) modules and their environmental parameters. For the memory hungry devices we have added a support for memory consumption overview — this can be used to verify if your network will support further IPv4 BGP routing table growth or it is running already at its' limits.
If you’re interested in learning more about how IP Fabric’s platform can help you with analytics or intended network behavior reporting, contact us through our website, request a demo, follow this blog or sign up for our webinars.
Today, we are delighted to release the new version 2.2.9 of IP Fabric platform. This release assists engineers in having a more complete overview of their network by adding support for additional vendors, such as Arista, HP Aruba, Huawei and F5 loadbalancers. It also provides support for new routing protocol IS-IS and improves End-to-end Path Lookup, which is now more intuitive — we now allow you to save and continuously verify specific path forwarding results, as well as display them on the dashboard.
E2E Path Lookup is one of the most useful features of our platform, allowing you to test and visualize the forwarding of the packet through the network. This will allow you to verify if the traffic is being forwarded as it is intended. Many of you have inquired regarding the possibility to be able to continuously verify specific traffic patterns, such as reachability of the CRM systems from branches. The verification now also extends to verifying if forward and return traffic are symmetric and if the traffic is being flooded somewhere within the network.
In order to receive the detailed information more efficiently regarding End to End path forwarding decision, we have implemented a new tab, which aggregates all the information found during the examining of the specific packet flow.
There are situations when you may wish to only see the edge devices, whether it be for troubleshooting or to see how the WAN works without distractions from the LAN devices and links. Therefore, we are introducing a function that allows for this.
As a committed vendor independent software company, we are always working towards implementing additional support for more widespread networking equipment, so that our software may analyze and verify any network. Therefore, we are providing discovery support for Arista, Hewlett-Packard Aruba, and Huawei networking equipment and loadbalancers from F5.
While we support general routing verifications regardless of the protocol or the route source, with version 2.2.8 we have expanded detailed routing protocol support and added EIGRP and RIP. Today, we are proud to announce that our platform supports all of the most important routing protocols, as we have implemented IS-IS.
Last but not least, based on the feedback that we have received, we have decided to add DNS resolve support for the Discovery Error reports, making it far easier to identify the devices that have not been properly discovered. We are also adding a graphical historical overview of the number of discovered devices.
If you’re interested in learning more about how IP Fabric’s platform can help you with analytics or intended network behavior reporting, contact us through our website, request a demo, follow this blog or sign up for our webinars.
Today, we are delighted to announce a new feature loaded release 2.2.8 of our IP Fabric Network Infrastructure Management Platform — Engineering Edition. This release is full of new exciting features and improvements, ranging from a new routing protocol support — EIGRP and RIP, through additional technology verification for Authentication, Authorization, and Accounting (AAA) to improvements for the existing tables and verification checks. We have listened to your feedback closely and implemented major improvements for the diagrams, so that you can display more information both visually and in the related popup windows.
Many of you have asked for ability to display additional information directly in the diagrams and we are delivering it today. Now you can display or hide additional network detail without going to the Technology Tables.
There is a number of options to display detailed information for various layers and technologies:
These new options, however, created an issue — the diagrams became overloaded with information. Therefore, we created a new straight link style that works better than the default Bezier curves, especially if you need to display more details on multiple parallel links.
Rethinking link style calculation proved very popular, because straight links can represent more information more clearly, especially when displaying multiple paths or protocols.
One of the awesome features of IP Fabric is its End to End path lookup. It allows you to test whether the traffic will be allowed through the whole infrastructure or not and why. However, in complex networks it was not very easy to find what is wrong with the path as there were only arrows to signify the resulting decision, and no clear indication of the problematic devices. To improve visual interpretation of the path lookup result we implemented highlighting of the devices which are causing a problem or are prohibiting traffic to pass, be it either because of ACL, Zone Based Firewall, Routing or Switching. Forwarding verification result has also been added to the device popup windows to provide detail from routing and switching perspective.
The path lookup is truly end to end, meaning we do not stop at the first device denying the traffic but finish the path simulation, so that we can highlight all the issues on that particular path.
This enables you to prepare all the necessary changes at once, instead of moving hop by hop.
IP Fabric now provides detailed information about configured Authentication, Authorization and Accounting (AAA) servers, policies and how they are applied through your network infrastructure. This can be used for validation that all devices are hardened properly, that the users logging in are being properly authenticated and authorized, and that all their activities on the device are logged and accounted for.
This is an example of how intent-based verification is much more robust than text-based golden config checks. With IP Fabric's platform you can ensure that general AAA rules are followed throughout your network, and that operational state complies with your intent of how the network is supposed to operate, regardless what OS device is running or if the device is HP, Juniper or Cisco.
While we support general routing verifications regardless of the protocol or the route source, with 2.2.8 we’re expanding detailed routing protocol support from BGP and OSPF to EIGRP and RIP. As always, the data is presented in the structured technology tables, the knowledge base, as well as in Diagrams.
BGP support was also improved, providing out-of-the box information about internal and external peering as well as details on BGP session uptime. This is very helpful for troubleshooting flapping or recently converged BGP sessions.
Last but not least, based on the feedback, we improved out-of-the-box verification reports to be more accurate and useful. In addition, we added DNS resolve support for the Connectivity report, which makes it easier identify the devices that have not been discovered properly.
If you’re interested in learning more about how IP Fabric’s platform can help you with analytics or intended network behavior reporting, contact us through our website, request a demo, follow this blog or sign up for our webinars.


