This week we released IP Fabric version 2.2.5 which focuses on improvements of network diagram workflow, significantly improving the depth of information provided in the diagram tooltips, and improving readability of the End to End path diagrams. We’ve also added pseudo-STP links, or MAC edges, to correctly interconnect Layer 2 and Layer 3 when discovery protocol is not present between the devices. This release also adds support for GLBP protocol, support for multi-context Cisco ASA firewalls, support for discovery of ExtremeXOS devices, wireless support for HP830/850, and many other improvements and fixes as detailed in the release notes.
Clicking on a device or link in the network diagram now opens a detailed tooltip with information about the object. Information is contained in tabs of each window, and tabs depend on what functions the device is performing and what protocols it is running. For routers there is naturally more Layer 3 information, including ARP and active routing table entries. For switches there is much more Layer 2 detail, such as switchports and MAC address table entries.
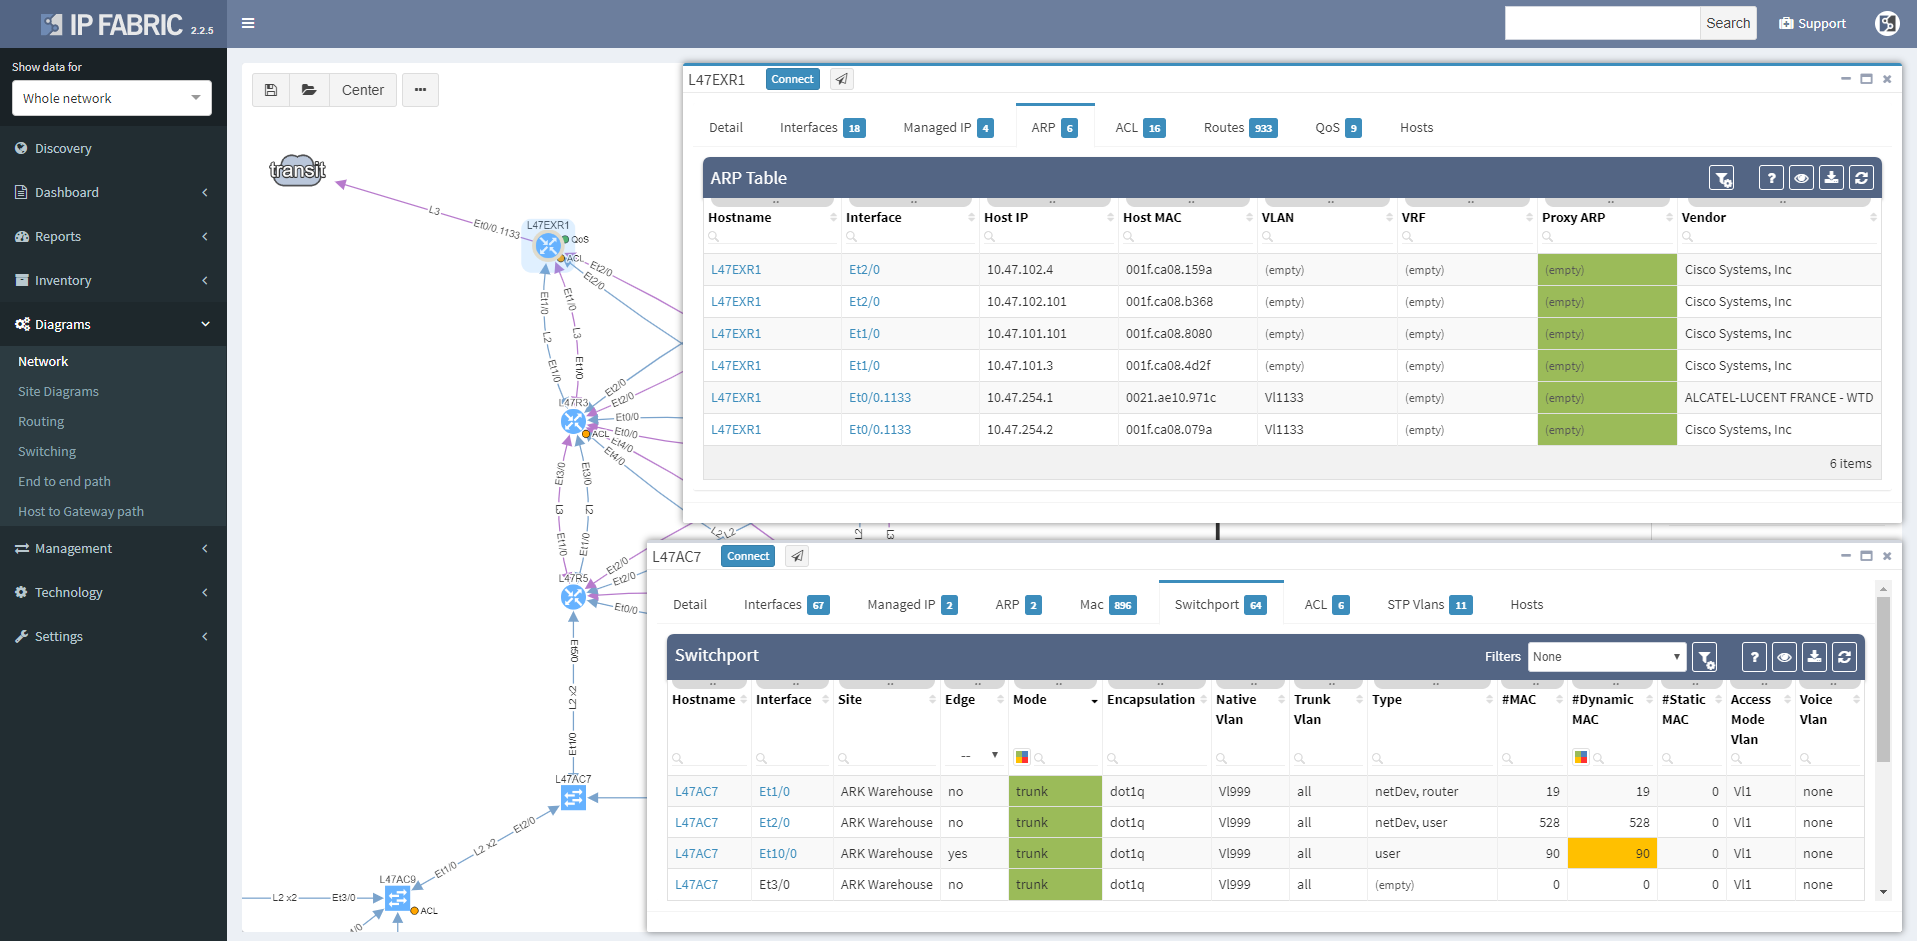
Wireless controller tooltips contain information about APs, firewalls about zones, and so on.
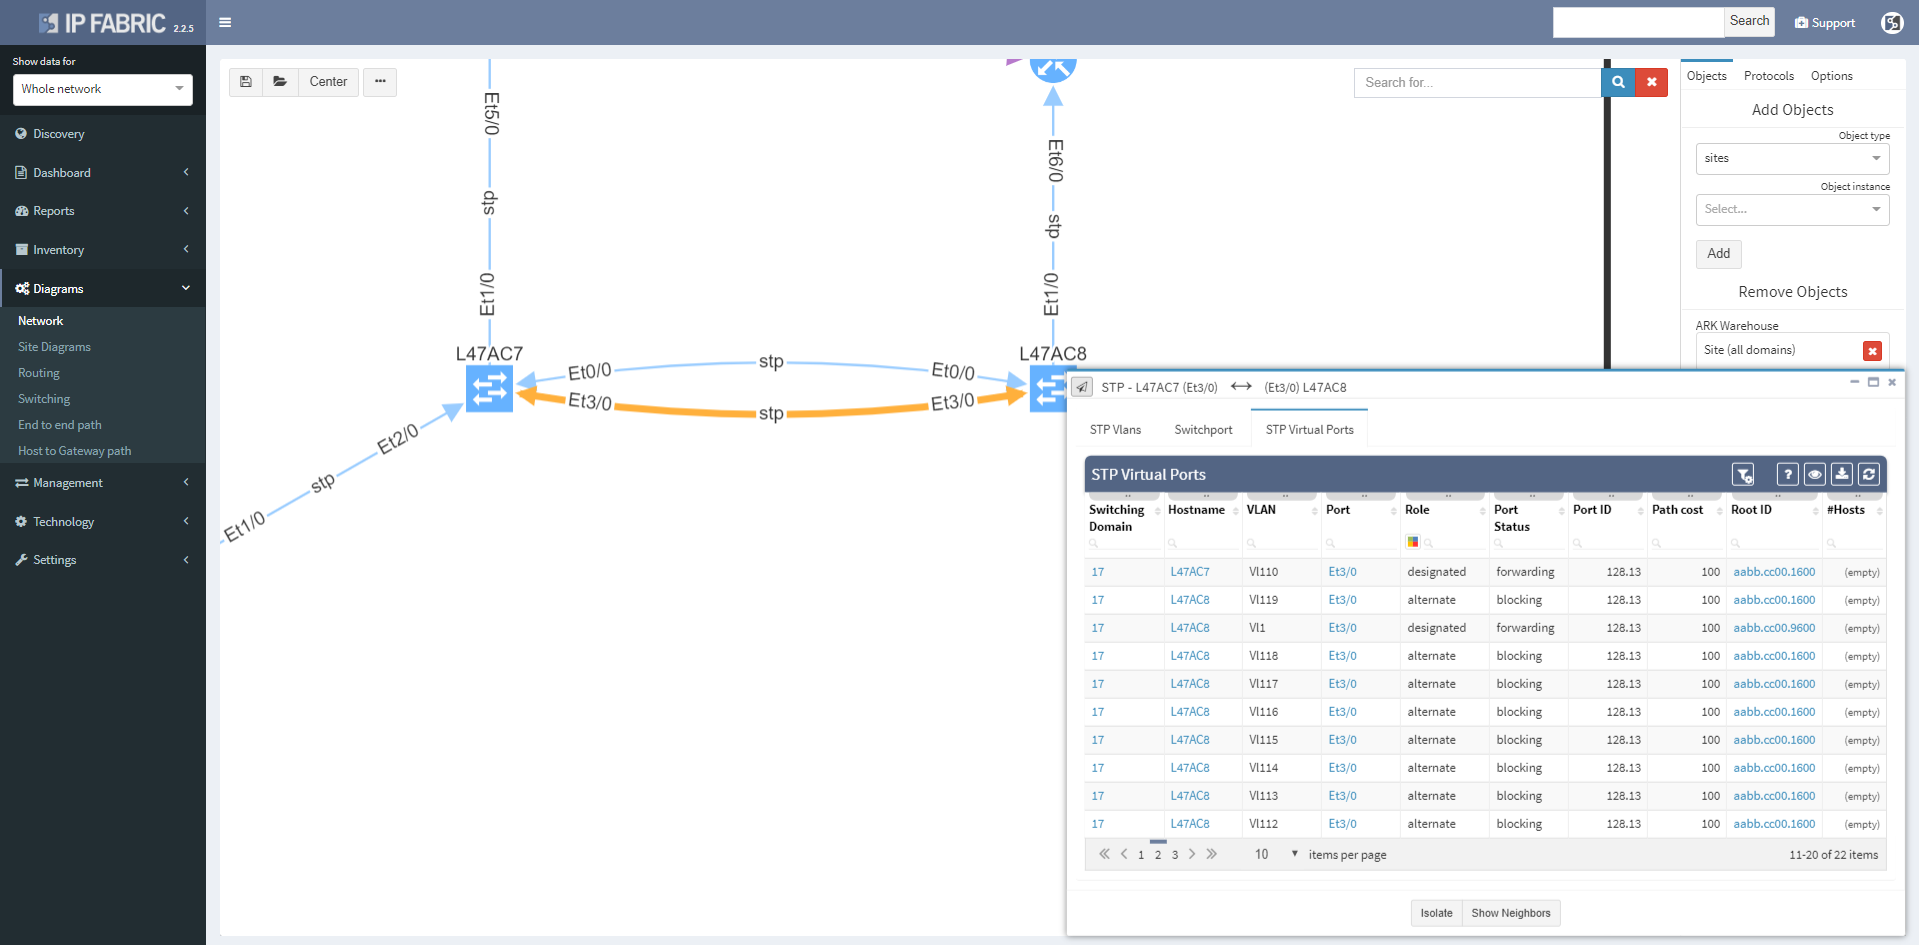
Clicking on a protocol link also opens a window with specific details relevant for the protocol, such as virtual ports and switchport details for the STP link
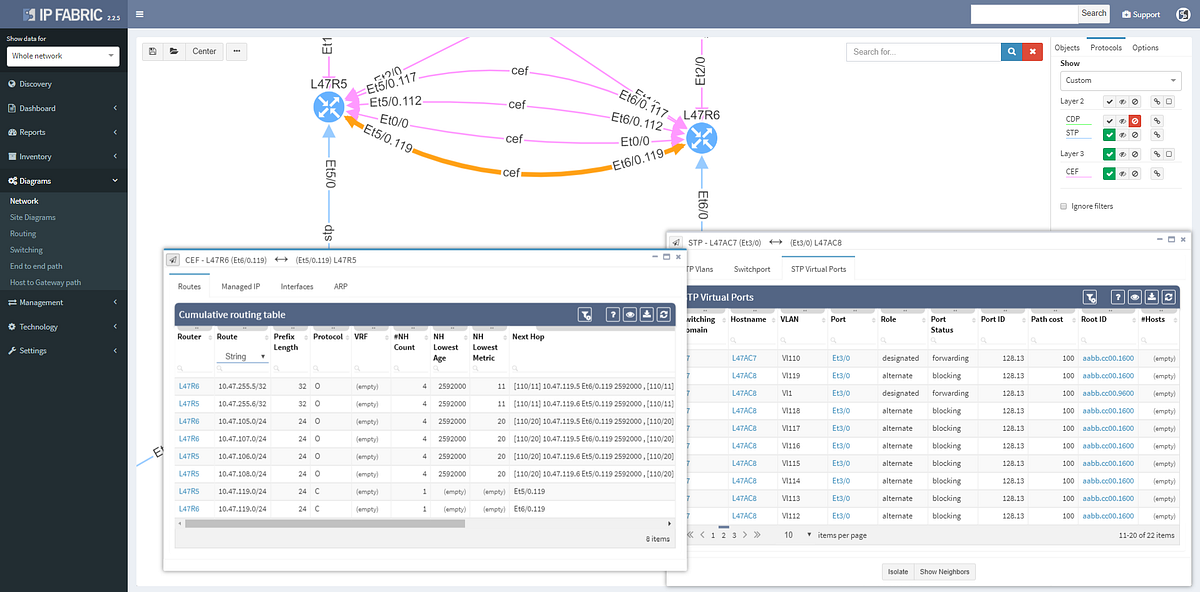
Or routes and for the routed links
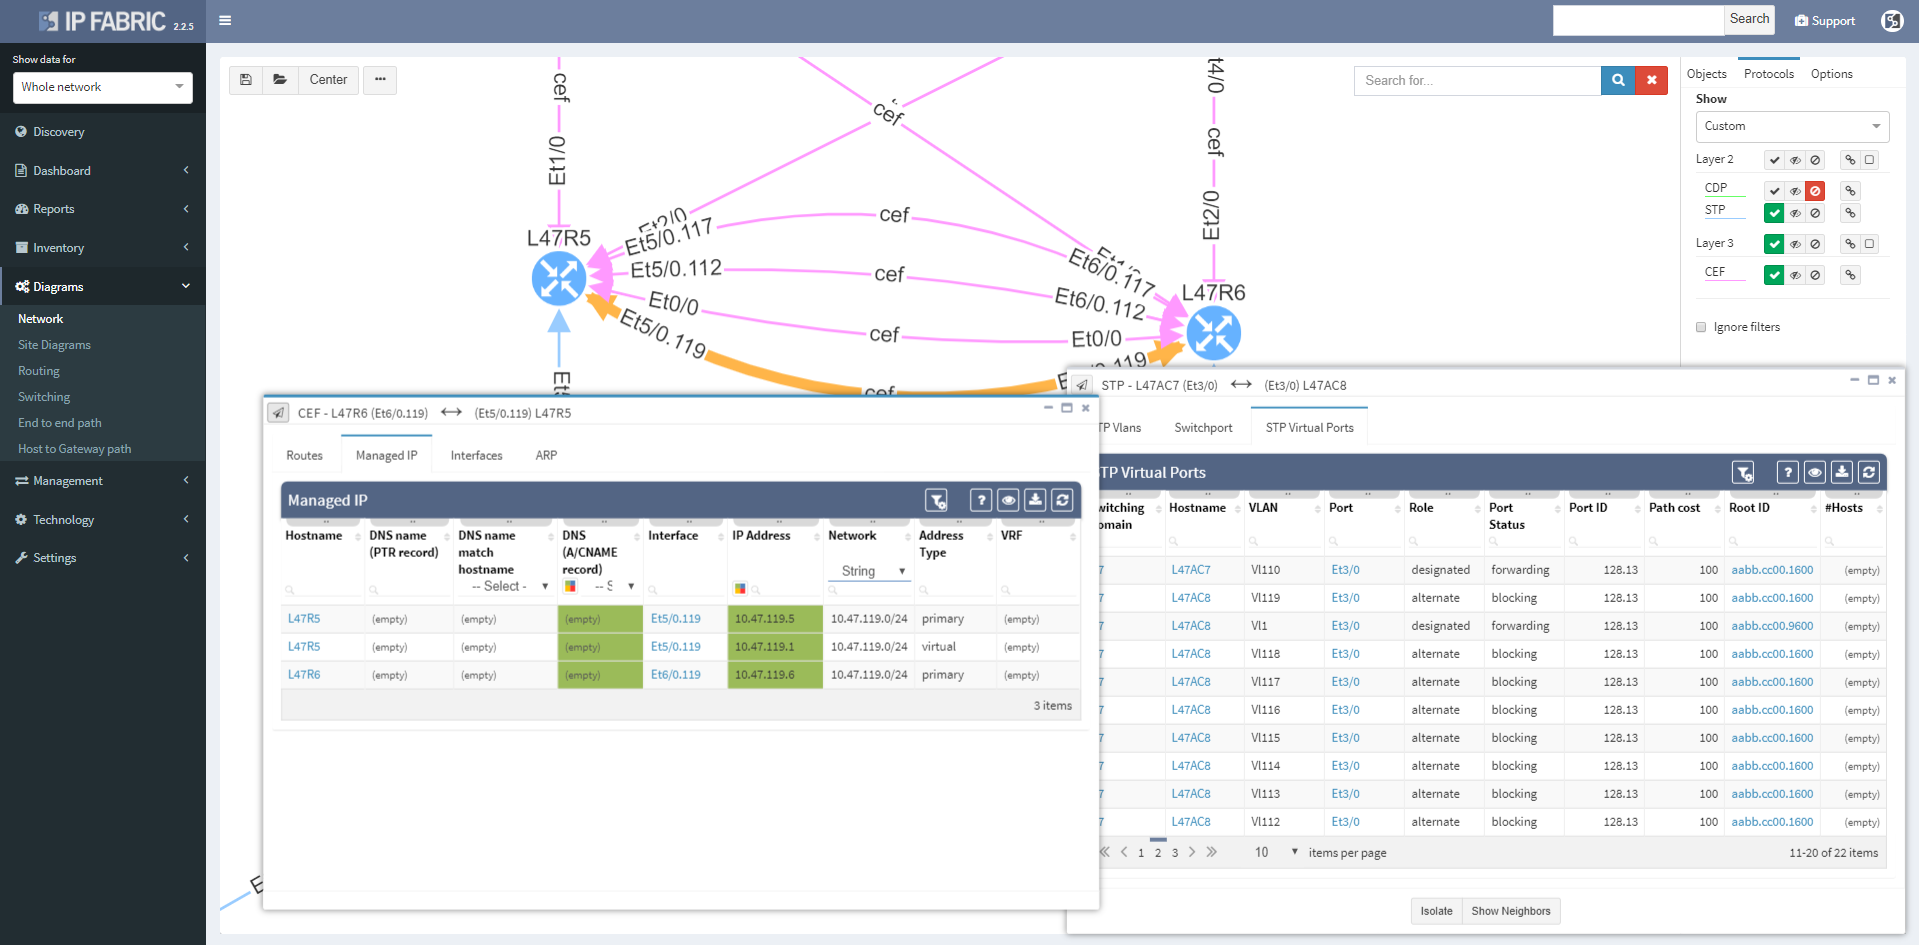
Switching tab to the Managed IP on the routed link shows active IP addresses on both sides of that link.
More time can now be spent in network diagrams and going through the detail without leaving the diagrams by managing tooltip windows. These can be resized, moved, or minimized as needed, and can be referred to later by clicking on the window icon in the bottom right corner of the browser window.

We haven’t focused exclusively on the diagrams, and the Discovery interface has been improved to include information about encountered errors during parsing of device output, grouping issues by error types and enabling to click through to specific output that caused a problem for IP Fabric. This enables to quickly spot issues such as missing authorization for a specific command, or inappropriate timeouts for very long command outputs.
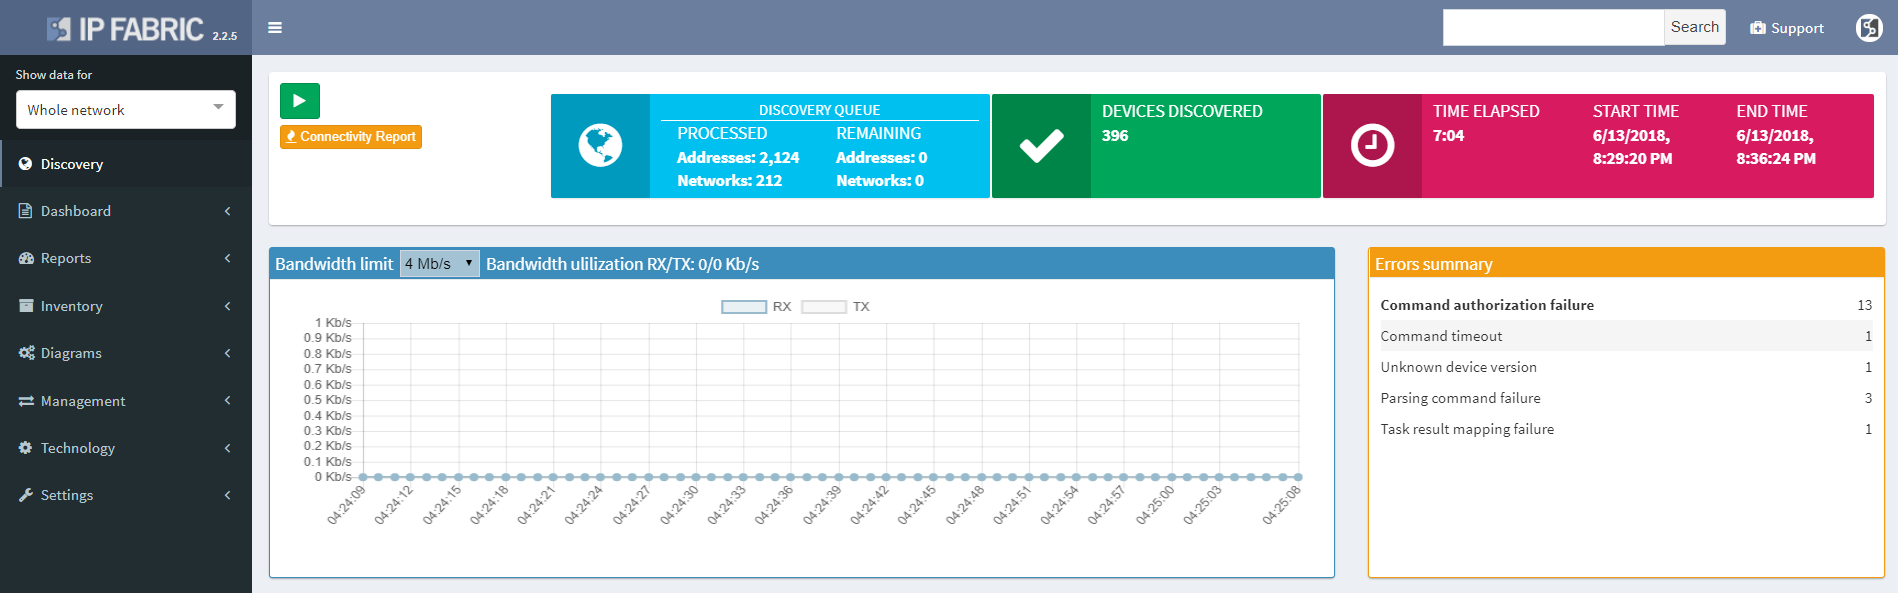
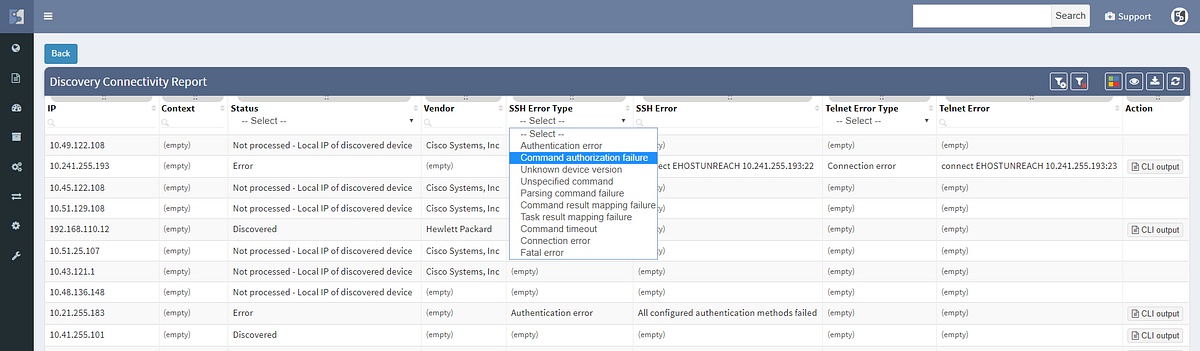
The discovery connectivity report itself has also been improved to include not only successful and failed attempts, but also skipped attempts when an IP in queue was found to be belonging to one of the discovered devices, or halted attempts when device being discovered was found to be discovered in parallel by another process (simultaneous duplicate discovery). A complete CLI output log is also available for each attempt.
If you’re interested in learning more about how IP Fabric’s platform can help you with analytics or intended network behavior reporting, contact us through our website, request a demo, follow this blog or sign up for our webinars.
Today we’re announcing the release of IP Fabric 2.2.4. A network security oriented release, the new version enables you to troubleshoot the paths through firewall clusters, to have deeper insights into routing convergence and redundancy, or to prepare or verify migration changes to 802.1X among other enhancements.
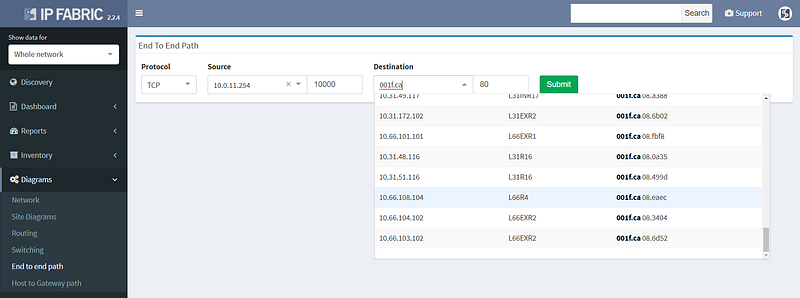
We’ve started by improving the user interface to End to End path lookup, simplifying to the usual combo of source and destination parameters. Typing hostname or IP or MAC address into the source or destination fields looks up the endpoint as you type, greatly simplifying the experience while keeping the most frequently used endpoint identification parameters. The previous lookup tables were much richer in information, but practically the additional information was more related to host location than end to end paths, and therefore seldom used.
Simplifying the user interface was necessary to add L4 parameters of protocol and port, which are now used to calculate the resulting security decision though all of the access-lists or zone-based firewalls on the path. This enables to better troubleshoot complex paths throughout the network. For example, when a user reports that they are not able to access an app on a specific port, you can instantly check if they are allowed to access an app in the first place, and how all do possible paths look like from source to destination, including whether might be an issue with load balancing or missing path symmetry. Of course, to be able to do that, we have to have not only model of routing, but also of traffic filtering mechanisms. These have now been expanded to support zone-based firewalls and clusters.
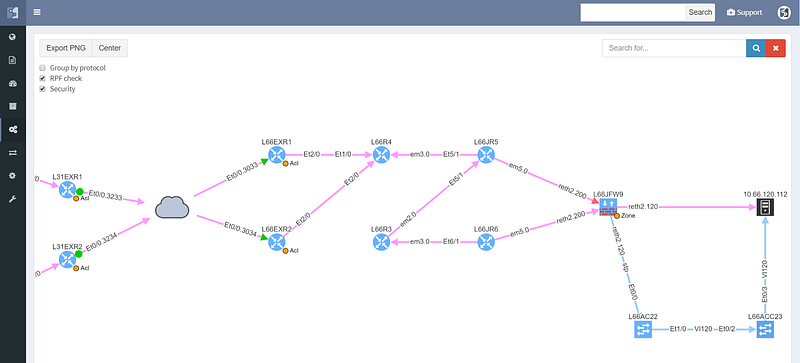
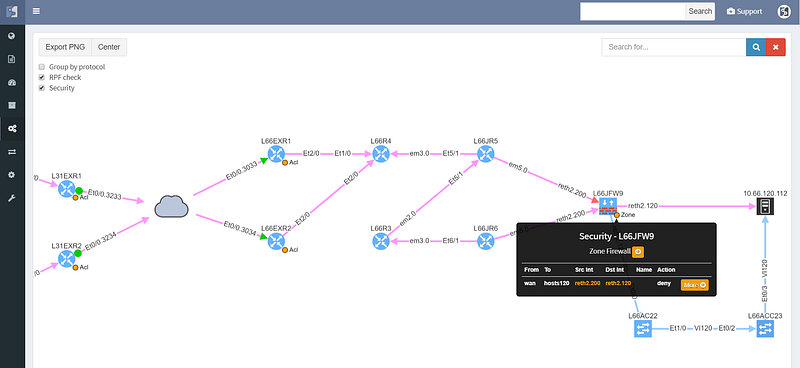
The cloud represents transit outside of administrative domain, such as MPLS carrier or DMVPN, usually a WAN. There is a missing path towards R3, and weird routing going on at R6 that should also be looked at. The WAN routers have egress and ingress filtering on the path that is permitting the communication (green color), however the cluster itself is dropping the packets (red color), so while the routed and switched path is built correctly, the traffic from this particular source/destination combination will never reach it’s destination.
Security rules for path visualization enable drill-down to the zone firewall policy details

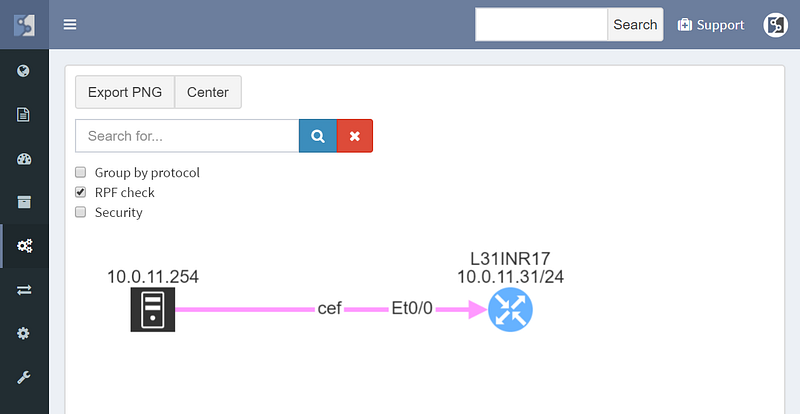
Path lookup was quite useful even in preparation of this demo. The connectivity to the end hosts wasn’t working, and the traceroutes from various points seemed to end in the MPLS cloud. Plotting the end to end path in IP Fabric immediately showed that the route at the source is missing, since the path stopped on the ingress router.
From there it was a matter of checking the cumulative routing table using routing lookup for the particular destination, which showed that no BGP routes can route these prefixes.
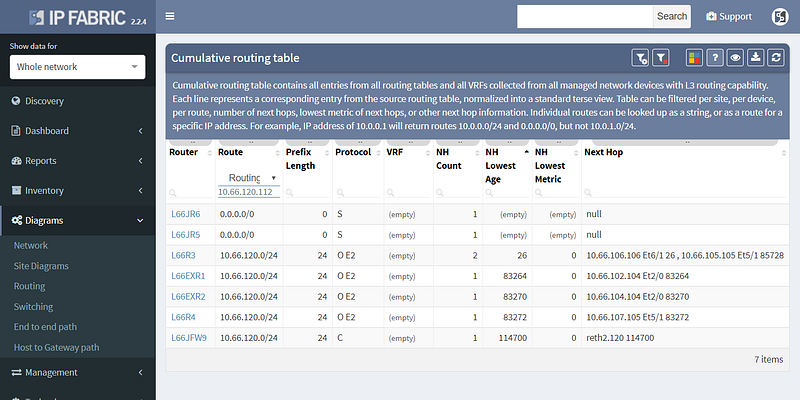
This pinpointed the problem to redistribution, since IGP had the route and BGP didn’t, and led to a quick fix.
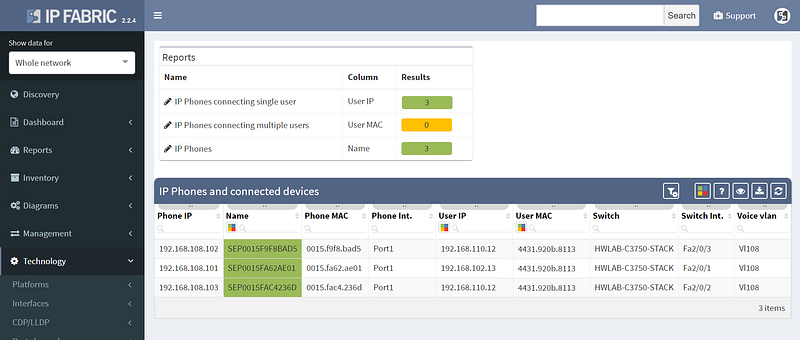
Other improvements in this release include improved 802.1x analytics, addition of STP guard tables, and usability improvements such as DNS resolution for hosts and voice VLANs for IP Phones.
However not all of the improvements were aimed squarely at analytics, as we’ve also added support for LDAP authentication to the platform, so you won’t have to remember the additional password.
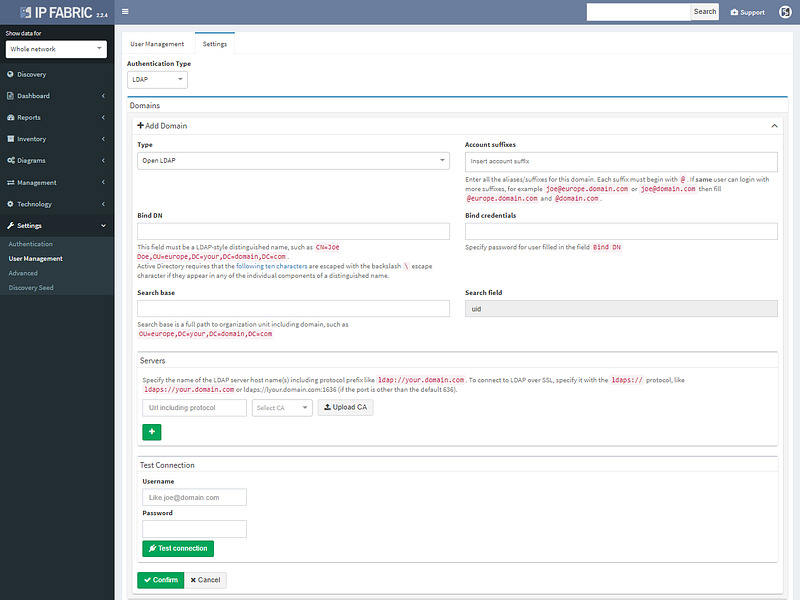
LDAP authentication supports Open LDAP or Microsoft AD.
We’ve also added restrictions per subnet for authentication credentials, so they can be specified more granularity for extensive administrative domains. The full list of changes is in the release notes at https://docs.wordpress-625423-2416527.cloudwaysapps.com/releasenotes.html. If you have IP Fabric installed, you can perform online or offline upgrade through the administrative interface following the guide.
If you’re interested in learning more about how IP Fabric’s platform can help you with analytics or intended network behavior reporting, contact us through our website, request a demo, follow this blog or sign up for our webinars.
I’m pleased to announce the release of IP Fabric® Platform 2.2. Continuing our mission of delivering more capabilities into the hands of the network engineers, this major release exposes all predefined verification checks and enables to edit them or to define your own. Each technology verification can also be added to the dashboard, which is now fully customizable.
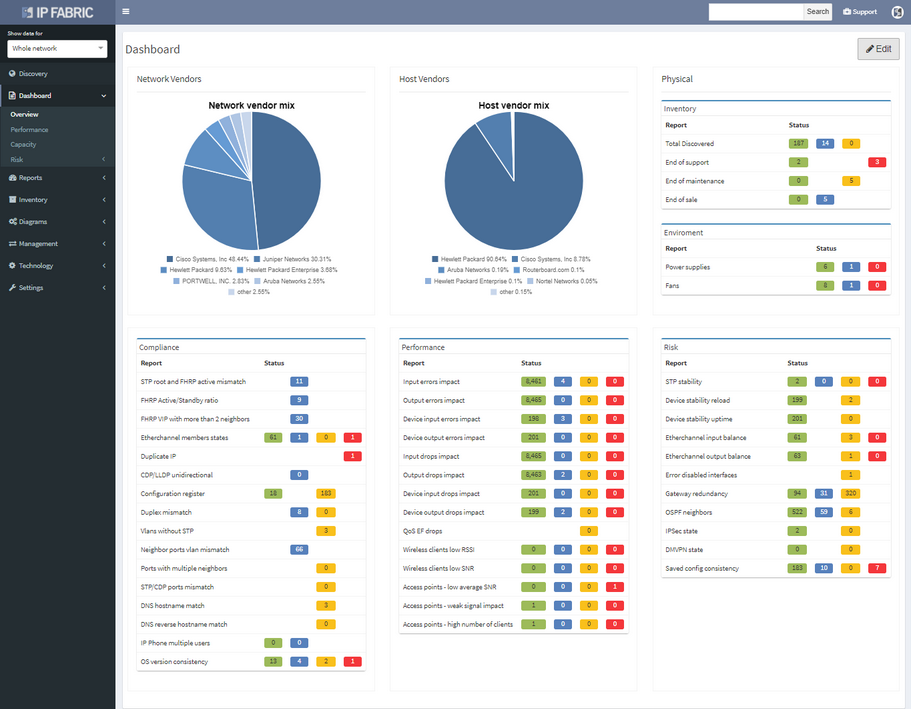
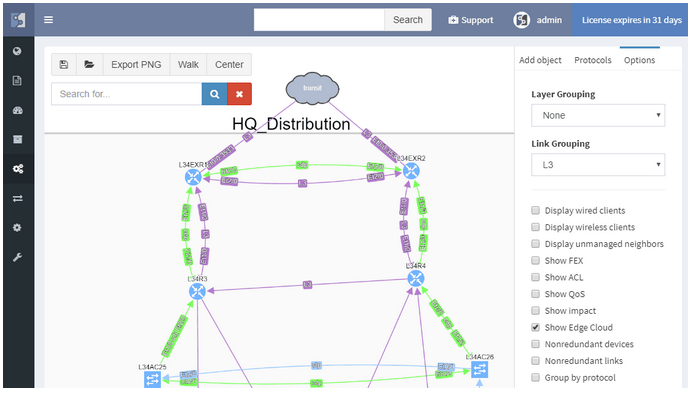
We’ve also revamped our diagrams to handle much larger scale, visualizing thousands of network devices and links on modest client hardware, and added many visualization options.
Version 2.2. also adds support for Junipers routers, switches, and firewalls, and base support for Fortinet FortiGate and Palo Alto.
We also haven’t forgotten about improving system administration, and this release has added options for encrypted backups and automatic updates.
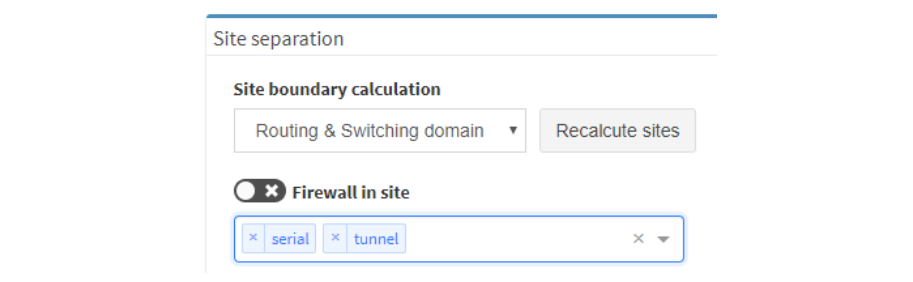
There were many other smaller enhancements such as the ability to recalculate site boundaries without running discovery, and the ability to use multiple nested regular expressions to separate sites based on the naming convention. I especially like that site recalculation also recreates all of the documentation according to the new separation rules, so even historical documentation can be updated.
As always, if you’re interested to know more, you can always drop me a line or request a demo or trial.
The IP Fabric platform 2.0 is a major new version of the network engineer’s best friend. A number of big changes and customer feedback have made it into the release. From tracking all changes in the network to supporting more networking technologies, and going deeper into the technology stack than any other product.
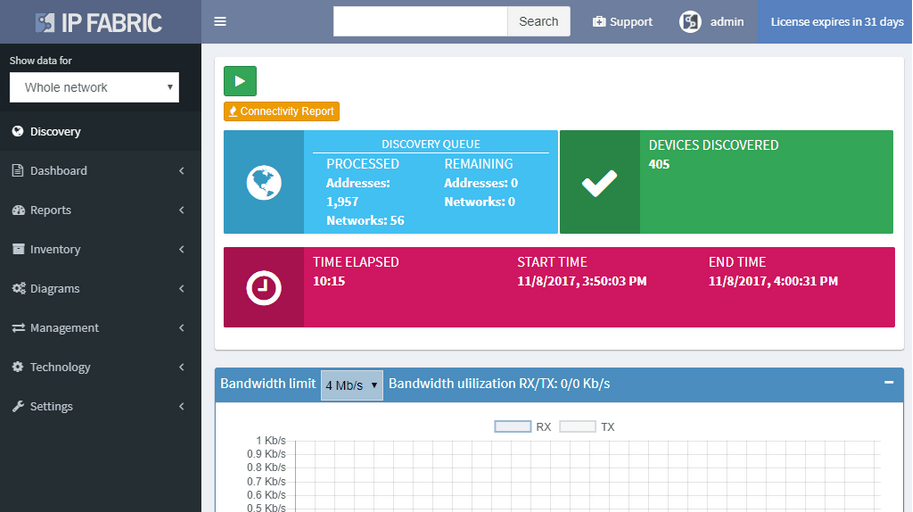
A single button now discovers the network and takes a thorough snapshot at the same time. Large networks are undergoing constant change. Analyzing partial network does not provide a full picture, while discovery alone was not sufficient to provide valuable insight about the network. Discovery of new devices, new connectivity, and new protocols, is now combined with an in-depth network analysis and assessment, user location mapping, and efficiency and risk metrics.
The IP Fabric platform now allows tracking of dynamic changes across the whole of network infrastructure, not just administrative changes in configuration. See whether someone reconnected a device, added a new device, swapped an SFP module, or standby router became an active one. Historical data from any of the two previous network state snapshots can be compared to find dynamic changes in the network, such as:
Administrative changes, or Configuration Management, is also available and shows when the last change on the device has occurred, allows to view most recent or historical configuration, or use the configuration to restore a failed device.
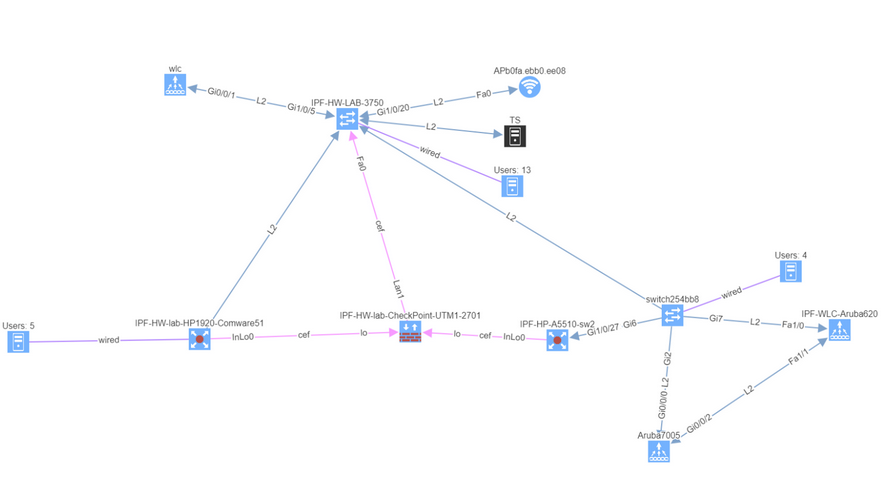
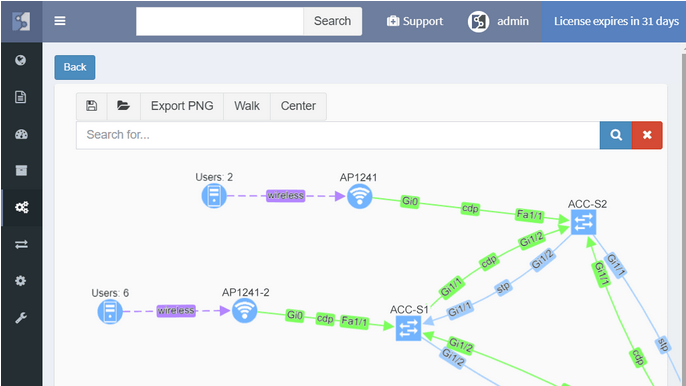
Diagrams have been significantly improved, enabling to zoom in from site overview to individual user. Diagrams allow to display or hide topology and protocols, collapse or expand links and layers, show wired and wireless users, and much more. One of the more important aspects is that topology can be saved, and that element position is unchanged throughout network changes.
While routers and switches are the backbone of any large network, it was clear that network engineers are interested in more than wired infrastructure. Support for Routers, Switches, and Firewalls was expanded with support for Wireless Controllers, Access Points, and IP Phones.
In a continuous quest to support all major enterprise networking technologies, the analytics support for Routing, Spanning Tree, Aggregation links, Link Layer, ACL, and Gateway redundancy have been expanded with QoS, StackWise, and Power Over Ethernet.
New driver system enables to add support for more vendors more easily. In addition to the Cisco IOS, IOS-XE, NX-OS, IOS-XR support, we have added:
To facilitate integration, we’ve transitioned to a single API which we use internally, and which can be used by users. The new version also features more granular TACACS controls, robust user management, encrypted channel for offline tech-support file handling, JumpHost support, and more.
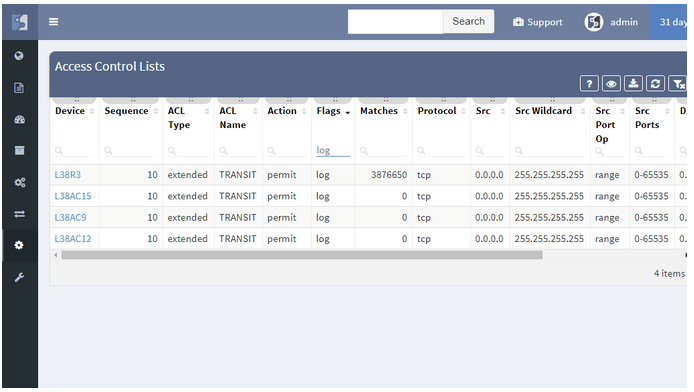
We’re taking user feedback to heart. When it was clear, that IP awareness is needed for routing and host lookups, we’ve added it right away. We're continuing the trend of incremental improvements, and adding routing protocol overview, ACL entry port lookups, ACL options lookup and hit count, Interface rate to supplement rolling over counters, and many others.
The feature I’ve been waiting for since the beginning of my Network Engineering career is finally here: Dynamic Change Monitoring. It’s finally possible to know the answer to the age-old question “What has changed in the network since yesterday?” and actually get a definitive response instead of the usual “Nothing has changed”. And not just the configuration change management, but I’m happy that we’re the first in the market to offer the overall network state change management — whenever a network path changes, if somebody plugs in a new SFP, if a network port goes up or down, or if IP address is starts being served by a new gateway due to a convergence event, the IP Fabric platform will report the change. It’s great for performing the changes as well because I can now perform a pre-change scan, in-flight scan, and post-change scan, and verify that pre-change and post-change do not differ or that they contain only the desired differences, validating change goal.

Dynamic change monitoring is not the only big improvement in version 2.0. Having had a number of large scale production deployments we’ve had a chance to listen to insightful feedback and significantly improve usability, add highly desired features, all the while simplifying product architecture to be able to deliver features more quickly. So here are some of the highlights from the big 2.0 release:
Now a single action discovers, analyzes, and calculates changes in the network. Based on a schedule or on demand, network insight is as current as you need it to be. The single combined action greatly simplifies usability, as it eliminates guesswork if a new discovery is necessary or not. From experience, we’ve found out that networks are so dynamic, that they need rediscovering every single time the network state is collected.
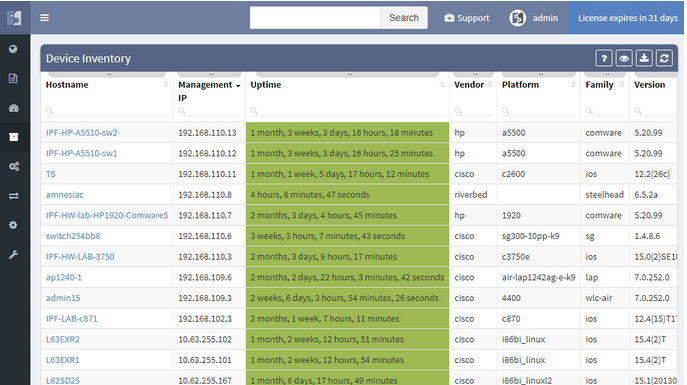
We strive to support all enterprise network infrastructure managed devices, model years from 1997 or 2017 and made by Cisco or anyone else. For version 2.0 we’ve added a driver system, where each vendor family only has to have a family driver for the IP Fabric platform to be able to talk to the whole family. We’ve also added support for HPE Comware v5 and v7 based switches such as 55xx and 59xx, Riverbed WAN accelerators running RiOS, and Cisco SG300-series SMB switches. Paradoxically, the Cisco SG300 had the most complex driver, because a number of key pieces of information are missing from the basic outputs, and multiple detailed outputs have to be painstakingly combined for a meaningful result.
While we started with Routers and Switches, our ultimate goal is to cover the end-to-end transmission path from the source to destination, which includes additional types of forwarding equipment. Wireless is omnipresent, so we’ve added WLC and AP support, so now wireless users connected to lightweight APs can be traced just as easily as wired users. We’ve also added firewalls and WAN accelerators. And because many users are connected through IP Phones, and IP phones are an important part of network infrastructure, we’ve added those as well.
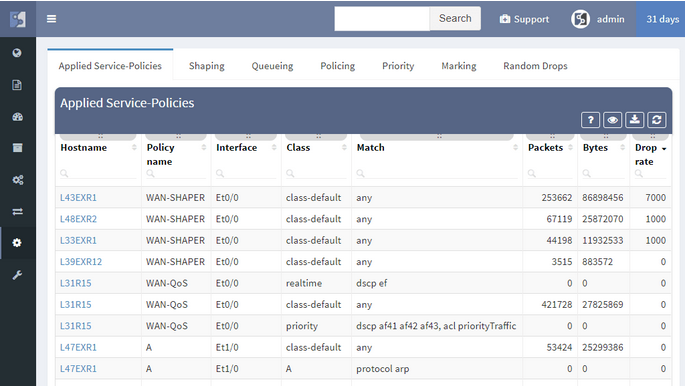
We strive to support all major Enterprise networking technologies and protocols, and although we have some road ahead of us, we’ve expanded VDC, vPC, and FEX support with StackWise, PoE, and Optical Attenuation, added support for QoS classes and applied service policies, improved ACL workflows, and added many smaller improvements, like support for DMVPN tunnels.
Networks follow graph theory, and graphs are naturally visual, so it is not a surprise that diagramming and visualization capabilities are a big draw, for both the customers and internal teams alike. In version 2.0 we’ve moved from simple diagrams to a fully-fledged diagramming UI, which enables to display protocols or features on demand and show network topology from highest overview to the deepest. One of the great additions is persistent diagram saving feature, which stores the diagram layout even across multiple discoveries runs.
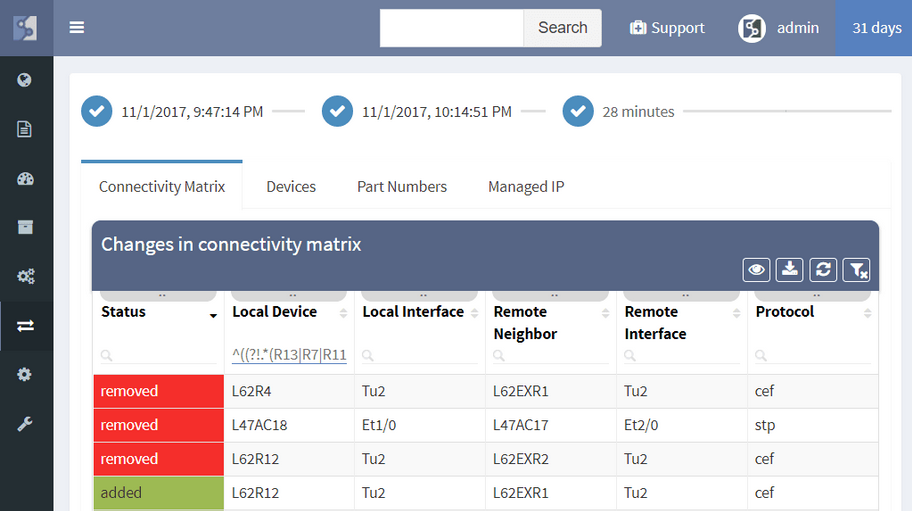
This one is my favorite. Network protocols create topological neighborship to form a forwarding domain and networks paths. Changes in protocol neighborships signify changes in the network topology. Changes in network topology connectivity may inadvertently affect network behavior and can affect a number of users. Tracking connection changes enables to quickly pinpoint non-administrative and administrative changes affecting topology and network paths, user connectivity, and performance, redundancy, resiliency and service availability. Along with configuration management changes, four types of changes are currently tracked: devices, network neighborships (CEF, ARP, RIB, STP, CDP/LLDP), modules and part numbers, and IP addresses. Changes can be displayed for any time interval for which the platform has collected network state information. Changes between last month and last week can be displayed just as easily for last week vs today.
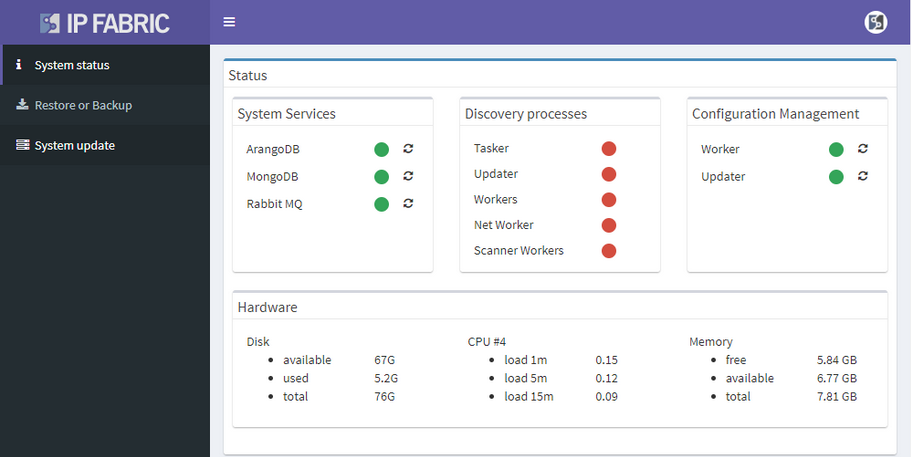
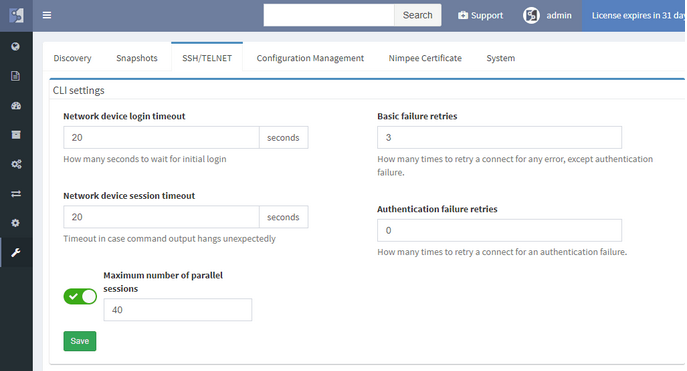
Many other improvements have made it into the big 2.0 release, and although not all are polished, they are functional and can provide value out of the box. User interface now has integrated search, Live Support VPN option, and a status page. Users can now change their password, and we’ve added the enterprise-grade user management system with roles. We’ve added more granularity for CLI interaction, such as a hard limit on a maximum number of parallel sessions. There are also Jumphost, and REST API, and actually much more than can be covered in one post. We’ll be coming back introducing each major feature in more detail, but if you can’t wait, you can always contact us or requests a trial.


