Network teams, deeply engaged with the daily changes and mechanisms of their unique network, understand the general state at a given point in time - especially if they have the right visibility tools in place!
However, the network underpins the entire business, and thus network state is relevant across the organization, not just to network teams. There is, in particular, a need to understand how the network state affects outcomes - the risk and impact of the network state on users and applications is vital business information.
Business leaders and adjacent teams (for example, security or operations) acknowledging the relevance of the network begets the need for clear, condensed, and relevant network reports.
Simply put, if something is going on in the network, what impact does it have on my job and the work I need to do?
These users won't necessarily have the same requirements of network reports as network engineers (nor will they understand the intricacies of specific network tech) so simply passing on large amounts of network data isn't an actionable solution.
This means engineers have to spend time understanding the requirements of different users with different perspectives and priorities, and manually collate and correlate different inputs from the network. And after all that effort, these ad-hoc reporting solutions might still not meet these requirements, or be something that you can replicate regularly.
This mismatch of expectations and needs results in frustrating bottlenecks and friction between teams, not to mention the time and focus dedicated to translating specific network information to satisfy requests from different teams.
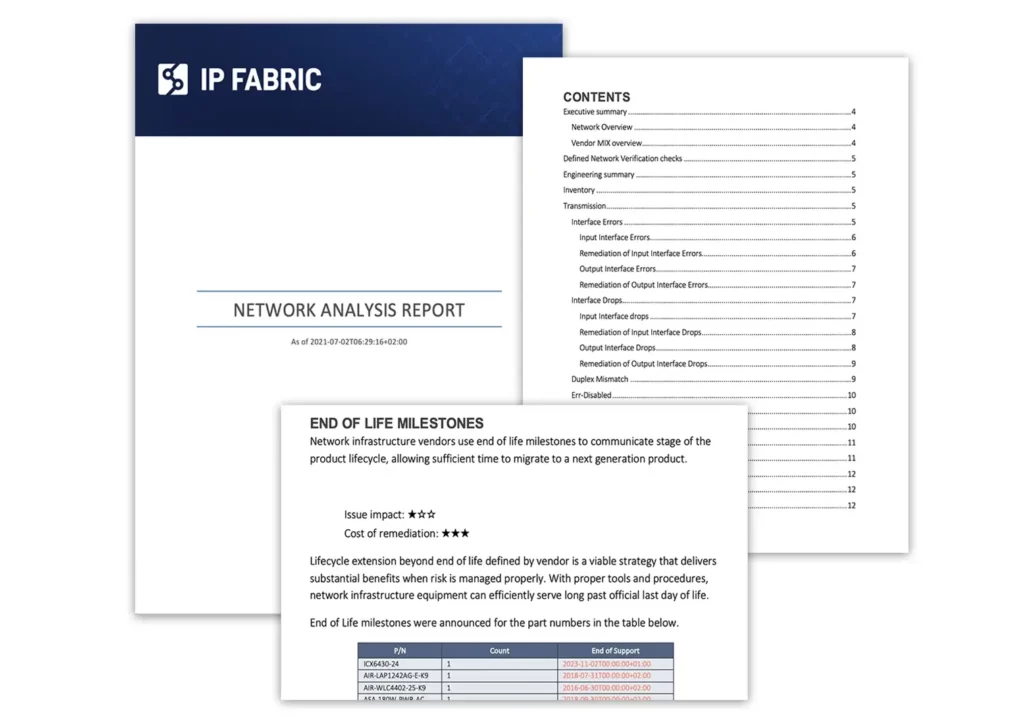
IP Fabric solves this frustration by automatically generating a network-wide analysis report of your network at a specific point in time, providing an invaluable resource to respond quickly and accurately to these requests for information.
This report includes summary information and perceived risks that may affect outcomes in a digestible format. Best of all, this is instantly accessible with a click, with no manual inputs needed. See the 6-second process here:
The cost and time of doing this manually would mean you can't just create these reports whenever you want. With a dynamic enterprise-scale network, regular reporting is crucial to ensure your understanding of the network is up to date so you can make well-informed decisions.
NetMRI has reached end-of-support and you need a new way to discover and model your enterprise network. Take note - a new way, not a replacement discovery tool that gives you the same fractured view of your network that you've been clinging to as some illusion of network visibility.
While traditional network discovery tooling might have offered insight into specific domains or tech, the complex enterprise network of today demands more. Much more. We propose a vendor-neutral, end-to-end network discovery and modeling approach – automated network assurance - as a new approach to enterprise network management.
It is only with this end-to-end view and network-wide visibility that network teams can enjoy benefits like:
Your modern enterprise network spans on-prem and cloud, is vendor-diverse, and embraces software-defined networking technologies (and if you plan to maintain security, compliance, and connectivity requirements amidst increasing demands, you’ll continue seeking out new tech that helps your network support business growth). Your legacy tech sits beside these new innovations, creating an ever-changing, complex brownfield ecosystem to contend with.
So why are you afraid of losing end-to-end network visibility when you never really had it? Use this opportunity to break free of the devil you know - a fragmented view of disparate parts of your network - and embrace a network-level approach. Has your traditional discovery approach resolved the burning issue of siloed (and inaccurate) documentation? Solved cross-team friction? Given you the means to surface and codify tribal knowledge?
Your problem isn’t vendor-specific. Your problem isn’t domain-specific, or technology-specific, or device-specific. Your problem is a need to understand and validate network behavior, with a network-wide scope. So why would you limit your network discovery with a one-to-one replacement of NetMRI? Device-level solutions may solve an immediate compliance issue or connectivity issue, but they don’t solve a long-term reality issue. The reality is your network teams need more - they need an end-to-end network model to be effective.
They need an end-to-end view of your network that includes inventory, state, configuration, and topology information and allows you to run network-wide intent checks to ensure the whole network is operating as intended. It must be built with your tech ecosystem in mind, and support API calls to access and use this essential network data where needed. It must support your SDN projects and your multi-cloud instances. It must be efficient, scalable, and flexible enough to support and future-proof your network as it evolves.
It’s called an automated network assurance platform. IP Fabric.
With Cisco's recent announcement of End-of-life and End-of-support dates for the Cisco Prime Infrastructure network management tool, users are now faced with the task of finding suitable alternatives to ensure seamless business continuity during the transition away from Prime.
While a shift towards Cisco DNA Center may seem the automatic answer, it's crucial for users to take this opportunity to evaluate what truly aligns with their team's specific requirements. Is DNAC capable of meeting your needs while providing better value? The price tag associated with Cisco DNAC and limitations in scope may cause teams to pause when making the leap. For instance, if you're managing a complex multi-cloud or multi-vendor network, DNAC won’t address all your requirements effectively.
There’s also something to consider in a completely new approach to how you manage and operate your network. Traditional tooling views validation of your network as a device-level challenge. While it is certainly useful and necessary to validate the state of each network device, having the big picture – an end-to-end, complete network model – is where traditional tools fall short. Automated network assurance platforms like IP Fabric bring insight to the network as a whole and validate network health rather than just device state. The vast and complex nature of modern IT networks makes this big-picture view all the more necessary; you need to know the outcome of change across your entire network, not just per-device.
So, depending on how you use Prime, there could be other avenues to explore. Automated network assurance, for example, while not pushing config to devices, provides much of the necessary end-to-end network insight that teams rely on Prime for. In fact, a vendor-neutral, cloud-inclusive platform will prove a welcome one-stop shop for business-critical data collection and validation tasks.
Cisco Prime Infrastructure allows users to define custom compliance policies, such as those needed to maintain ISO 27001 compliance and perform audits, evaluate the results, and run a fix job if necessary. Even if this is only done a few times a year, having a method to surface this information automatically avoids a time-intensive process of manually collecting configuration information from individual devices. Simply not a feasible way to work with a large network!
During the network discovery process, IP Fabric uses SSH to collect configuration and state data from supported network devices (there are hundreds of supported models across an always-expanding list of vendors). This is interpreted, normalized, and visualized in flexible snapshots of your network that provide both a holistic overview and allow users to dig into granular detail where needed.
Additionally, for this use case in particular, you can make use of 150+ built-in or custom intent checks (in this case, compliance checks) to highlight drift from network intent, which is informed by your compliance rules. Every time you take a network snapshot, you can easily see misconfigurations that violate your own organizational standards or that of specific industry regulations like PCI or ISO 27001.
Once the correct config has been pushed, IP Fabric can take another snapshot to validate that the whole network, regardless of vendor or domain, is operating as intended. IP Fabric runs end-to-end path simulations and can validate that your security policies are being applied as you intend.
This means fast, accurate, and continuous compliance, giving you confidence when those security or regulatory compliance audits come around year after year.
Regularly scheduled backups of your switch, router, and firewall configurations are standard best practice to ensure easy rollbacks after that “oh no” moment when a change has unexpected consequences, for routine device upgrades, for disaster recovery, and of course, to ensure compliance. Cisco Prime Infrastructure allows users to backup and restore switch, router, and firewall configurations on a customizable schedule, and seamlessly migrating this process over to a new platform is essential.
Since all the network state and configuration info is collected in an IP Fabric network snapshot, and these snapshots can be scheduled as often as your team prefers (or be made on-demand), you’ll have access to a historical database of your switch and router backups at different times whenever you need them.
Note that this is for your whole network, end-to-end, all vendors, and through to the Cloud. Additionally, unlike platforms that offer similar functionality, IP Fabric has the benefit of keeping all these snapshots available on the platform for you to query at any time, making it a perfect resource for historical troubleshooting.
You can’t escape that your enterprise network is subject to change, and as daily demands ebb and flow, you need to have a pulse on system health and performance. Cisco Prime Infrastructure collects real-time and historical data from network devices. It then presents key device health indicators like CPU and memory use in dashboards. Users can set thresholds for alerts and quickly identify potential issues.
Network engineers can leverage IP Fabric in a similar way to ensure their network infrastructure is performing optimally and swiftly address any anomalies that might affect performance or uptime. The in-depth, normalized data that IP Fabric collects via snapshots can be integrated via open API with real-time monitoring tools to contextualize and prioritize incoming alerts, ensure that you’re monitoring everything in your network, and give engineers what they need to proactively solve high-priority incidents. And, of course, this utility extends beyond just Cisco devices.
As Cisco sunsets an essential resource for key network data and operations, there’s no need to feel backed into a corner and buy an expensive, vendor-restrictive solution to cover these gaps. Automated network assurance gives you a normalized and consumable bank of network intelligence that allows you to cover many Cisco Prime Infrastructure use cases more comprehensively at a fraction of the cost. In addition, A move toward a network model-based approach can also open new doors to innovation that previously, traditional tooling focused on device-level validation simply didn’t consider.
Consider this moment – which could be a frustrating headache - an opportunity to optimize your network tolling ecosystem with a solution that grows in value over time with straightforward, per-device licensing and an open API.
Let's demonstrate how to integrate IP Fabric directly with Grafana using an Infinity Datasource and creating a Dashboard to visualize the data. This is easily accomplished with the template file located on GitLab and provides your teams a single pane of glass to monitor your network without having to navigate to another website. Following these instructions or those located in the GitLab repo will have you up and running in approximately 5 minutes, so let's get started!


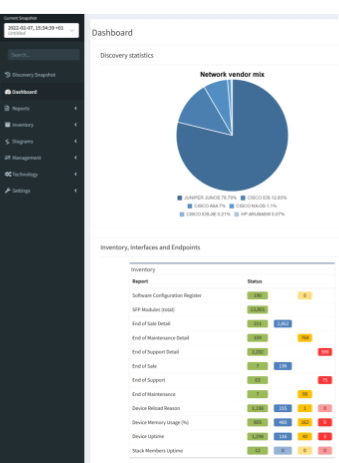
In the top left we see three variables that can be set to change the dashboard data:
IP Fabric Instance: Used for customers with two or more deployments (this can be disabled for customers with a single deployment which is documented below).Snapshot: Provides a way to switch between the loaded snapshots to update the dashboard's data.
The next section provides an overview of the number of licensed and unlicensed devices discovered in the snapshot and the Device Inventory table (limited to 5,000 devices).
hostname: Filtered hyperlink to the Inventory > Devices table.loginIp: Link to directly SSH to the device (see Telment/SSH URL Handler On MS Windows 7 And Later).version: Hyperlink to Inventory > OS Version Consistency filtered on the platform and version.
The IP Fabric Dashboard is a mirrored copy of what is seen in the GUI. This also contains links back to IP Fabric tables. Clicking the URL in the Name column will take you to the unfiltered table, however the links in the Green, Blue, Amber, and Red columns will filter that table based on the color you selected.
Also included are tooltips on all the hyperlinks with the description configured in IP Fabric.
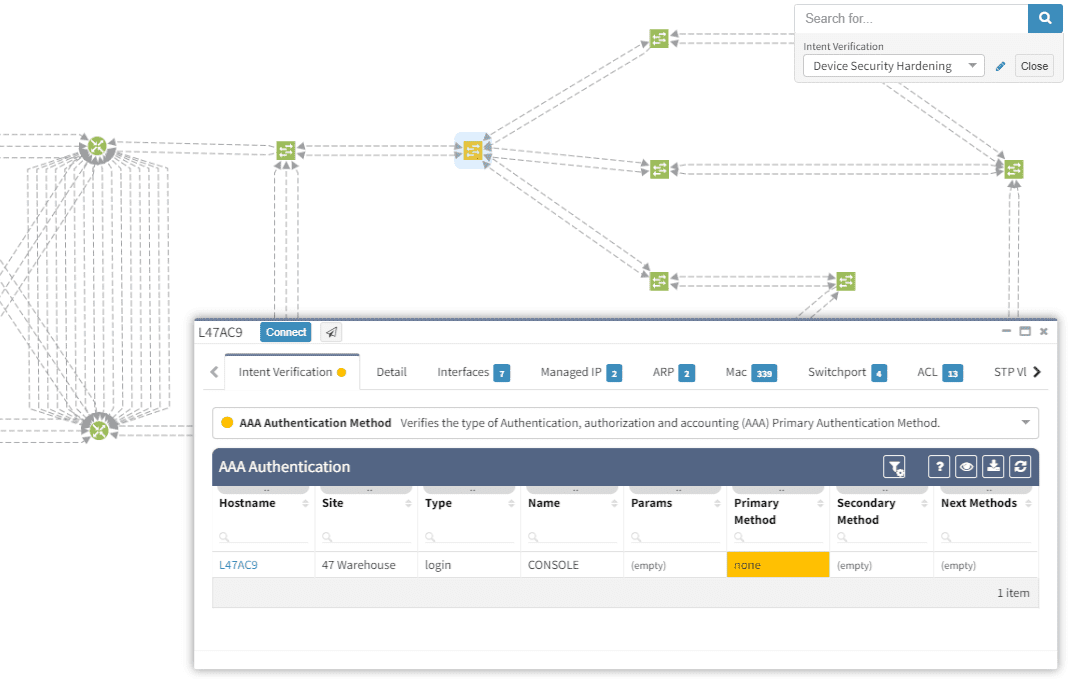
Pro Tip: When creating new intent verification rules or editing the defaults, be sure to add or update the descriptions on each color to ensure your users understand what the rule is signifying. This is seen in the below picture where the highlighted green box has a descriptive message to convey the green color's purpose whereas the red box is used to describe the entire intent check.


Finally included in this template are some examples of creating custom visualizations for data your team may want to more closely monitor. These are created using table filters in the GUI and utilizing the API Description to copy those rules into Grafana. To speed up loading of the dashboard, the query is limited to return a single row of data and the value displayed is derived from the returning _meta.count field in the JSON response.
It is not recommended to display tables of data in Grafana due to the current paging limitation. Requesting large amounts of data from IP Fabric using the API without paging can degrade performance for all users.
In this section, we will set up the Infinity data source(s) for connection to the IP Fabric instance which the dashboard will use to pull the data.
In Grafana, navigate using the right hand menu to Connections > Add new connection, search for "Infinity", and select it to create the new connection.

Authentication and select API Key.
Key is required to be set to X-API-Token.Value is the API token you created in the IP Fabric GUI.Allowed hosts with https:// prepending it and pressing Add (i.e. https://demo1.eu.ipfabric.io).Save & test button at the bottom of the page.Cache tab to speed up queries and Dashboard loading.TLS/SSL & Network Settings there is an option to skip TLS verification if your IP Fabric instance does not have a trusted certificate installed.This Dashboard template has been developed to support multiple IP Fabric instances and if this applies to your environment simply create a new data source following these instructions for each of your IP Fabric FQDN(s).
Now that the connection to IP Fabric has been established we can import the Dashboard. This is done by going to the Grafana Dashboards page selecting New and Import. You will need to access the grafana_model.json file from GitLab and either upload the file or copy/paste the contents in the Import via panel json.
After selecting the Load option you have the ability to change the default Dashboard Name from and the folder it will be located under prior to importing.
Once loaded it should take you to the new IP Fabric Dashboard however there is one configuration change to ensure that the dashboard selects the correct data source. Because this template was built to support multiple IP Fabric instances it is required to filter the list of Infinity data sources that are configured across the entire Grafana environment.
Dashboard settings.Variables menu select the instance variable to edit it.Show on dashboard value to Nothing which will disable the drop down to select different servers which is not needed.Instance name filter regex.
/^FQDN$/ (i.e. /^demo1.us.ipfabric.io$/)./^demo1....ipfabric.io$/ or /^demo1.us.ipfabric.io$|^demo1.eu.ipfabric.io$/).Apply.Save dashboard and Close at the top right of the page to return to the Dashboard to verify data is loaded.Also included is a query to fetch the IP Fabric apiVersion for use in all the queries the Dashboard may request. This should ensure stability after upgrading your deployment(s) to a newer version however it is always recommended to check the Release Notes for any breaking changes that may occur between versions.
A fix has been added to resolve an issue after upgrading to IP Fabric 6.3.x on August 10th, 2023. If you imported the Dashboard prior to the fix and have issues with hyperlinks after upgrading please follow the migration documentation on GitLab.
In summary using this IP Fabric Integration template can maximize your teams network monitoring visibility into your already preferred dashboard application Grafana. This template is meant to be a jumping point to provide examples of how to interact with IP Fabric using Grafana and can be further customized to your team's needs.
If you have any questions, ideas for new functionality, or need assistance with installation or configuration please reach out to your Solution Architect for assistance. I hope you found this an exciting new way to extend the capabilities of your IP Fabric deployment!
If this post has piqued your interest, and you'd like to see the integration in action, please check out #TechFabric 7 - Integrating IP Fabric with Grafana Webinar on LinkedIn!
Want to see IP Fabric in action for yourself? Try our free, self-guided demo here.
Prefer the personal touch? Reach out to us to schedule a free demo, zero obligations required!
IP Fabric's GUI provides you with Excel-like tables for filtering and querying data, but sometimes engineers require data to be extracted for more advanced reporting or Power BI dashboards. In this blog, I will demonstrate how to directly connect IP Fabric to Microsoft Excel or Power BI without using CSV exports. This has been simplified into functions stored in template files allowing you to pull any IP Fabric table in seconds!
Documentation and template files are located in the IP Fabric Integrations GitLab.
You must have web API access to the IP Fabric server (default is port 443). If running these queries from Excel in Office 365 or Power BI in the cloud, your IP Fabric instance must be reachable from the public Internet.
Microsoft Excel and Power BI will only allow you to communicate with websites that have valid and trusted SSL certificates. The easiest solution is to install a trusted certificate on the IP Fabric server that has been signed by a CA in your Trusted Root Certification Authorities. If you are unable to create a signed certificate you are also able to use a self-signed cert and install it on your location machine. This must be done for every user/computer that will be running the Power Query and you will not be allowed to run these queries in the Cloud.
Finally, you will also need to have, or create, an API Token. This token will be saved within the file (or the data source on powerbi.com) so sharing is not recommended. We recommend either removing your personal token before sharing the file (or posting the file to a shared cloud space, i.e. SharePoint) or creating a limited read-only account and API token. If you need more information or assistance with read-only accounts and RBAC please reach out to your Solution Architect.
After opening either the Excel or Power BI template file there are two required configurations that must be done prior to accessing data. You may be required to accept some warning messages about communicating with external content prior to being able to continue.
In Excel open the Data Ribbon and click "Queries & Connections" and right-click the IPF_URL query and select edit. This will bring up the Power Query Editor where you are able to input your information. Example configuration:
12dd8c61-129c-431a-b98b-4c9211571f89If you are using Power BI when you open the template file you will be prompted with a pop-up to enter these variables. To access the Power Query Editor simply click "Transform data" in the Queries section of the Home ribbon.
Finally, you should be asked about data source settings prior to connecting, if not then select the Snapshots connection and in the Home ribbon in the Power Query Editor select select Refresh Preview. For the Credentials select Anonymous and for Privacy level either check the Ignore Privacy Levels box or select any level and press save. Once completed you should now see a table of the loaded Snapshots.
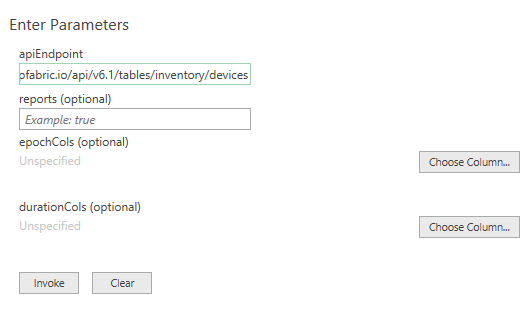
The queryIPF function simplifies the pulling of data with only one required parameter, the API endpoint of the table. This can be located by selecting the Table Description or the ? icon on any of the tables and copying the URL under the API Description. For example, I would like to pull my Inventory > Devices table into Excel.
The reports variable defaults to false, setting to true will include the Intent Checks for the table if any are configured. This will be a new column named colname.severity where severity equals one of the following:
Once configured select Invoke (the epochCols and durationCols can be specified after invoking the function which will be discussed later).
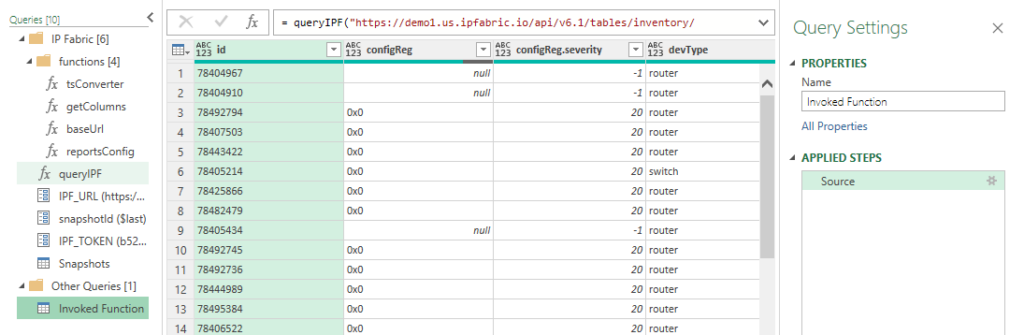
Now we have the Inventory > Devices table loaded. Changing the Properties > Name will change the Excel Worksheet name so it is recommended to update this value. In this example I specified reports=true and we can see the new configReg.severity column.
Finally, click the Home ribbon Close & Load which will update work workbook or to add more tables simply repeat this process for each table you desire! It is really that simple.
Times in IP Fabric are stored in two different formats. When you use the API you will see that an integer is returned unlike when you view it in the GUI. Let's take a look at these formats:
colnameAsDatecolnameAsTimeIn the Device Inventory, the uptime can be converted into a human-readable format in Excel. Simply change the query by adding a list and the column name.
Original:
= queryIPF("https://demo1.us.ipfabric.io/api/v6.1/tables/inventory/devices", true, null, null)
Modified:
= queryIPF("https://demo1.us.ipfabric.io/api/v6.1/tables/inventory/devices", true, null, {"uptime"})
This then converts 3435180 into 39.18:13:00 (39 days, 18 hours, 13 minutes and 0 seconds.)
Epoch example with the End of Life detail table:
= queryIPF("https://demo1.us.ipfabric.io/api/v6.1/tables/reports/eof/detail", true, {"endSale", "endMaintenance", "endSupport"}, null)
As valuable as contextualized network data is for your engineering teams, we know how insightful it can be also for adjacent teams, leadership, or third parties. Using our IP Fabric-developed Excel and Power BI template files, you can communicate directly with IP Fabric without exporting CSVs, seamlessly leveraging this data for high-level and detailed reports and presentations.
If you found this interesting and want to implement this in your environment, please look at the following quick videos for a visual demonstration and more advanced information. This includes how to work with nested objects and/or lists as well as joining tables. Reach out to your IP Fabric Solution Architect for more information or assistance!
Want to try out IP Fabric yourself? Sign up for our self-guided demo and see what automated assurance could do for your network teams.
There are many elements that contribute to the availability of services delivered across any network. Redundancy in the topology, coupled with resilience in the configuration are key. Routing protocols are used to manage that redundancy and failover to backup traffic paths should a failure occur in the active path. For this to work successfully, it is vital that the environment remains as stable as possible and is not subject to constant change. IP Fabric can help you by analyzing routing protocol stability and pinpointing issues.
As we know, the stability of BGP peering can cause performance problems with large networks. Events such as link failures can trigger sequences of updates along paths in the network - this can cause:
As an example of this, consider that the Internet routing table has reached such a size that it never actually fully converges. This is a symptom of the churn - the number of updates and withdrawals - caused by link events within and between ASs which of course occur around the clock!
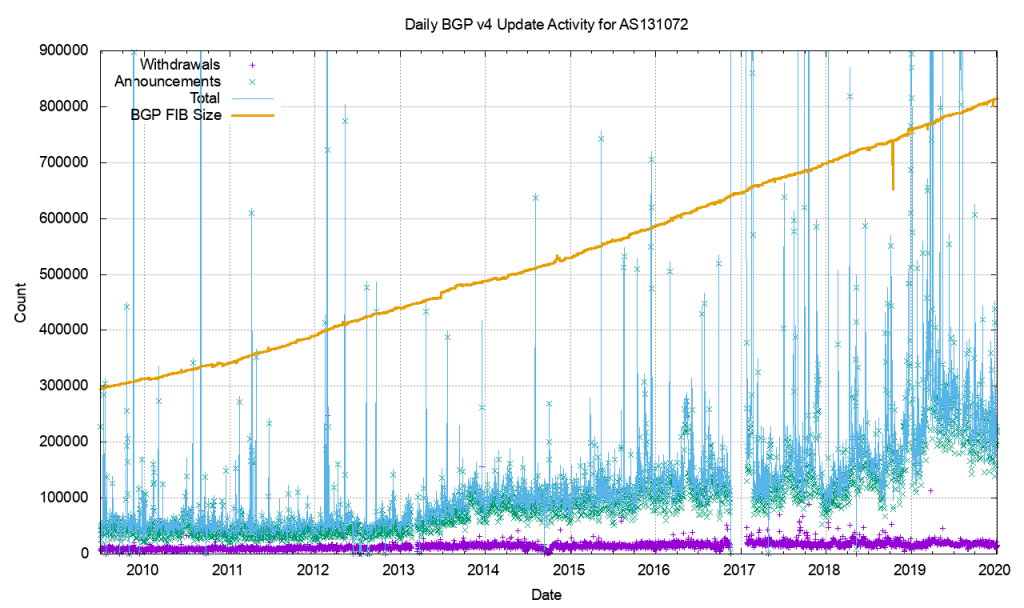
BGP is usually used in an enterprise to connect together networks that are managed by different organizations or different parts of the same organization. It follows then that once established, the connections should stay up and remain so. Fluctuations in that connectivity have the potential to have far-reaching consequences and so it pays to keep track of the stability of that peering.
But how do we measure that stability? In particular, we might address this by focussing on two particular elements. For each BGP peering relationship in the network we might look to answer two questions:
In order to check that manually, a network analyst might have to
Or you could spend the time to write the scripts and develop the tooling to automate the process so you can repeat the checks at regular intervals.
Alternatively, you could give the job to IP Fabric.
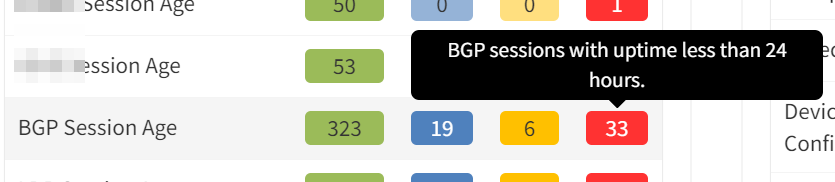
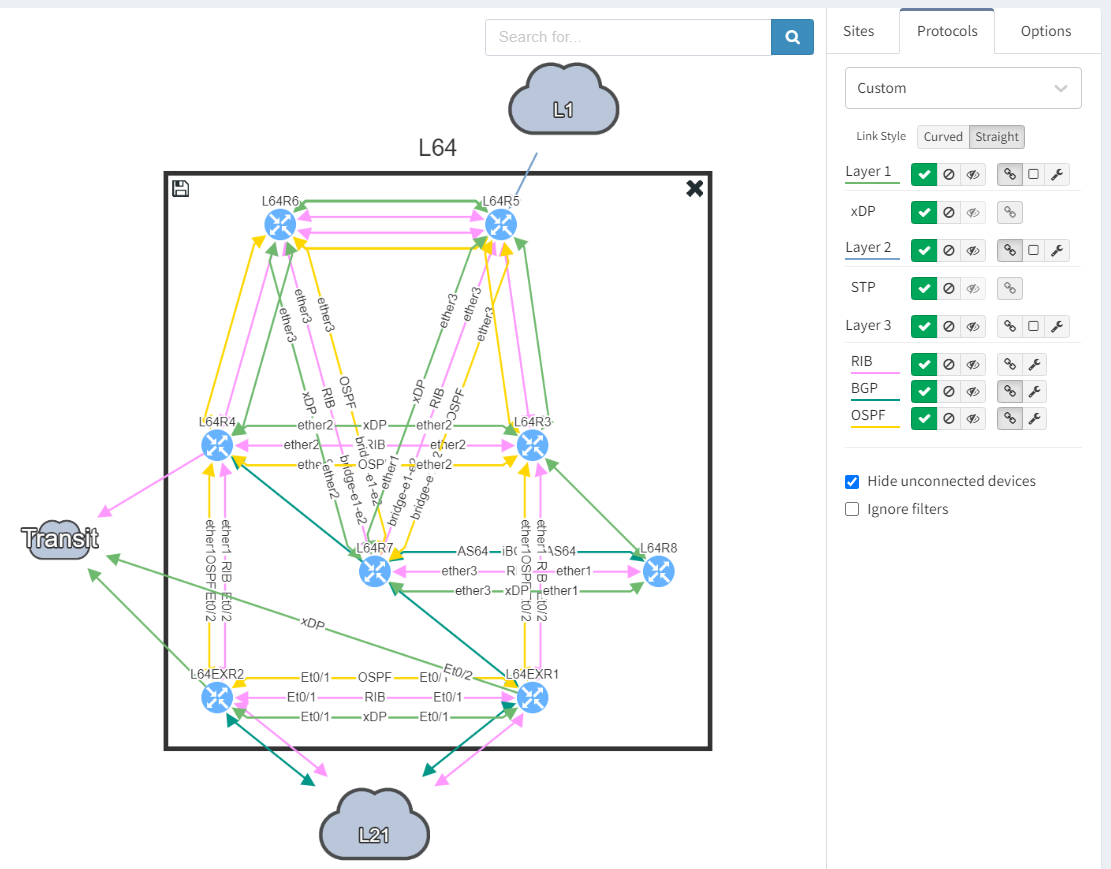
IP Fabric analyses configuration and operational state of the devices in the network records them in a vendor-agnostic form in its database, then runs 120+ standard validation checks and presents the results on the product dashboard. These checks include identifying BGP peering across platforms and vendors and checking the relationships for the length of the establishment of peering:
and for current state:
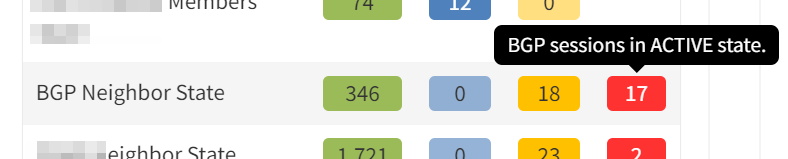
Clicking through the dashboard on peerings in an active state shows a table of the details for those peerings, and you have all the details to hand.
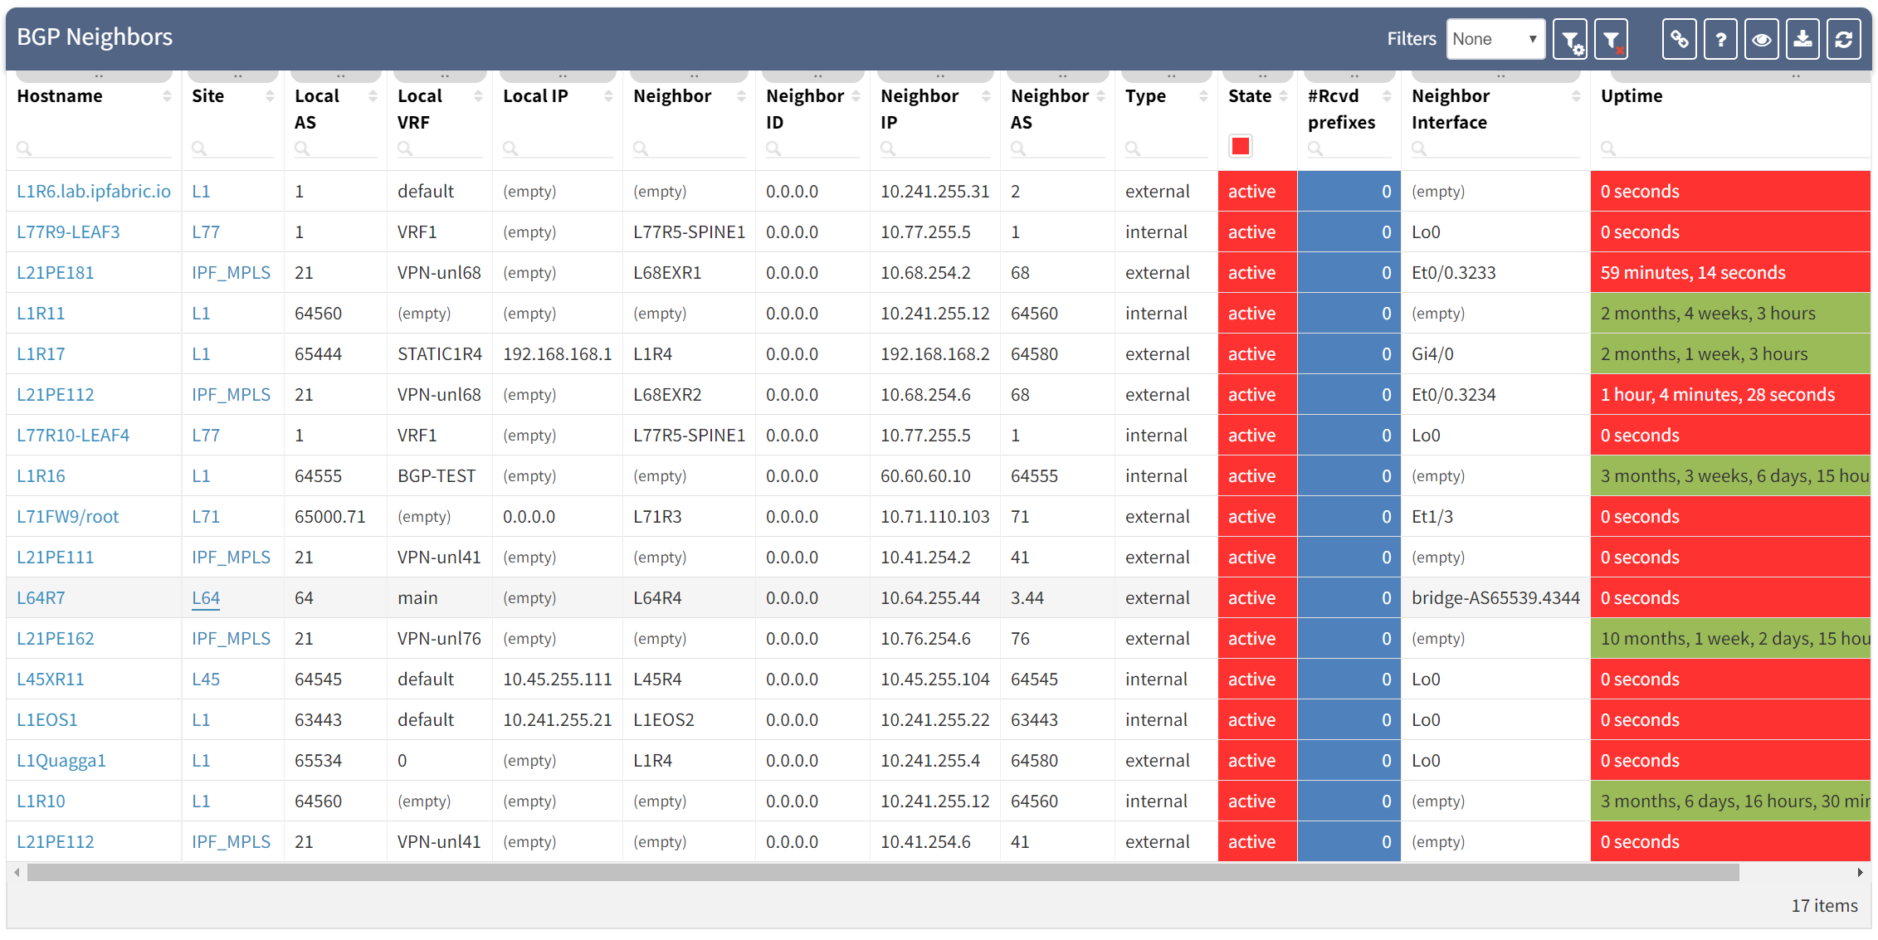
Taking a step further, click through the site location in the table to see the topology with the peering in question from the "live" documentation:
Next, we focus on BGP topology by disabling all other protocols and enable the BGP Compliance intent verification check.
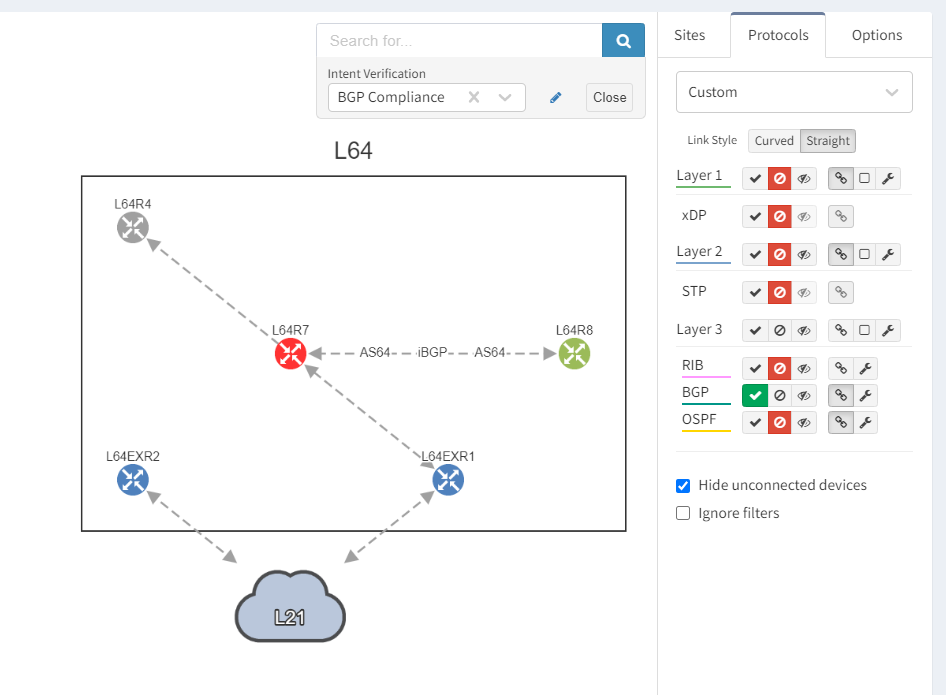
We can see that the platform has highlighted the problem with L64R7. IP Fabric presents information on the problematic peering with L64R4 when we select the router in question. The implication here is that L64R4 is not configured to peer with L64R7.
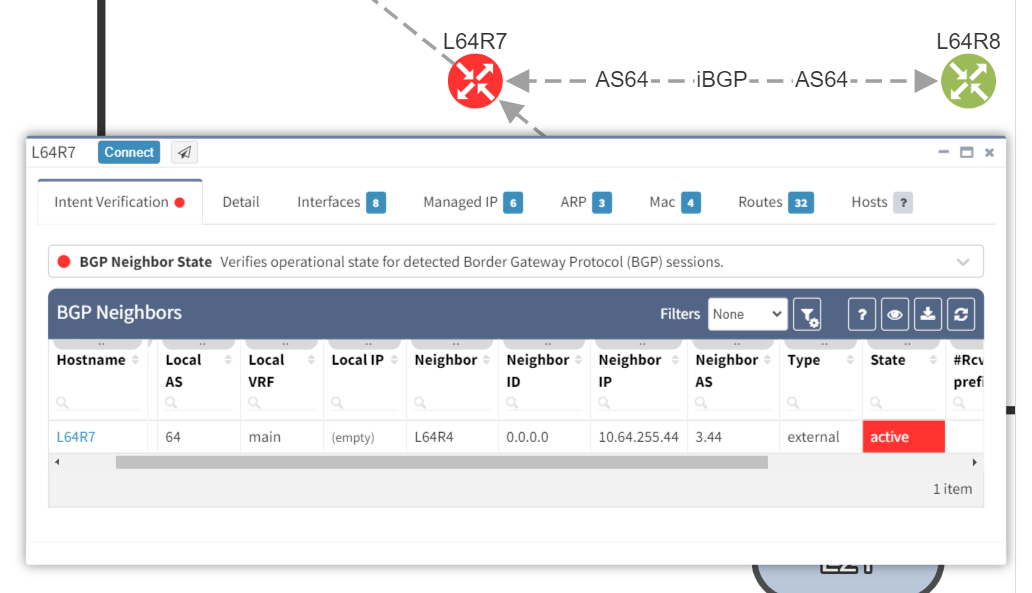
It is apparent that the peering appears to be configured in one direction and not the other from the arrows in the diagram. From the table, it looks like an IP address doesn't appear to be assigned to the peering. On inspecting the routers we can see that L64R7 looks fine:
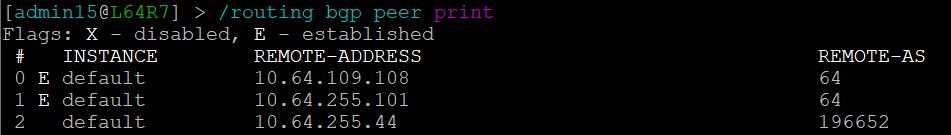
but the peering is disabled on L64R4:

And so IP Fabric has allowed us to drill down and reach the conclusion far quicker than going through a process of having to extract the detail, analyze it and troubleshoot manually.
If you have found this article helpful, please follow our company’s LinkedIn or Blog, where more content will be emerging. If you would like to test our solution to see for yourself how IP Fabric can help you manage your network more effectively, please contact us through www.ipfabric.io.
Ever since engineers started operating computer networks, they started to use network analysis tools to measure performance, calculate risks and improve visibility. As technologies in general evolved, so did the tools for their administration. However, it has become quite common that many operators stick to old-fashioned Command-Line Interface (CLI) only and avoid any automation.
Don't get me wrong, there's nothing wrong with being capable of using CLI. I believe that every network or system administrator should be familiar with the approach. CLI is fast, self-explanatory and very output oriented. The problem lies in scalability. One person is capable of running multiple CLI sessions at a time, but the attention span dedicated to each one is low. As a matter of fact, multiple CLIs are not a type of network analysis tools when it comes to
Rather than viewing one output at a time, we should be getting a bigger picture. The only way is to implement automation. There are many ways of doing that. First, we can start with automation scripts for data collection. However, that may come at a cost of utilizing network engineers for building scripts. Or secondly, we can choose from many available platforms on the market. The second options comes at a cost as well, as we are paying fees for the software.
Because there are many available platforms on the market already. Let's focus on the main features that every one of them should include.
If the provided network analytics platform comes with automated network discovery, it's a good job done already. The most important is always up to date information. If the discovery is completely automated, one can be sure they will never lose track of new devices.
Each network vendor is more than happy to provide its users with their own management platform. That's great, however, most of the times it only works for one specific vendor! There's no best vendor for all services. You can have datacenter firewalls from Juniper, web secured with F5, distribution network running on Arista and core on Extreme. The flexibility is the key here and to manage 5 separate systems for one complex network is not an option, it's cumbersome.
The network analysis tool should be able to provide security and compliance feedback. It should automate data collection and verification at the same time. It's great to have all data but without proper analysis, it's lacking the finish line.
From any network tool, the admin should be able to easily export data in multiple formats. It can be either CSV, JSON or any Image format for diagrams. It's critical for teams to collaborate and proper export options can elevate that greatly.

The IP Fabric platform provides multiple export formats and two main automated documents on the fly.
If you have found this article resourceful, please follow our company’s LinkedIn or Blog, where there will be more content emerging. Furthermore, if you would like to test our platform to observe how it can assist you in more efficiently managing your network, please write us through our web page www.ipfabric.io
To begin with, IP network gateway redundancy has become a very standard high availability solution. In IP Fabric's platform it’s described as First Hop Redundancy Protocol (FHRP) feature that currently umbrellas HSRP, VRRP and GLBP protocol.
I have prepared a little scenario in our virtual lab with a LAN switched network protected by a firewall that is forwarding all traffic out with a default static route towards virtual VRRP gateway. The virtual gateway is created with the help of two Juniper boxes, vMX and vSRX in packet mode with no security policies defined (functions as a router).
After successful discovery with IP Fabric version 2.2.5 we will confirm correct VRRP setup by using diagrams and by slightly modifying our view.
There’s a simple ring topology consisting of 6 routers total (3 of them are SRX, that are considered correctly as device with firewall capabilities, specifically static1r16, static1r17 and static1r18, but all act as routers). Other three routers in the ring are vMX routers.
First, I would like to verify that VRRP is operational and correct virtual gateway is active. In IP Fabric in diagram Options panel we check ‘Show FHRP’ and if configured properly, both gateways would pop-up on the diagram. Afterwards, by simply navigating to FHRP yellow button in diagram, we would discover further VRRP setup, which seems to be correct. Router static1r18 is supposed to be the primary gateway. It’s closer towards exit points and it has greater link capacity with LACP interface compared to router static1r17.
We are currently seeing only IP related connections between routers, there’s single area OSPF as primary IGP protocol, with static routing already mentioned above (originating from static1fw56–1, pointing towards VRRP gateway). Well, let’s verify that.
There’re more options about how to obtain routing information in IP Fabric, but we can go directly from our current diagram. We simply click the firewall node on screen and all information are there. In the routes panel we only filtered all routes for ‘S’ (static routes). We verified next hop IP and interface, route metric and it seems we are good to go!
If you’re interested in learning more about how IP Fabric’s platform can help you with analytics or intended network behavior reporting, contact us through our website, request a demo, follow this blog or sign up for our webinars.
This week we released IP Fabric version 2.2.5 which focuses on improvements of network diagram workflow, significantly improving the depth of information provided in the diagram tooltips, and improving readability of the End to End path diagrams. We’ve also added pseudo-STP links, or MAC edges, to correctly interconnect Layer 2 and Layer 3 when discovery protocol is not present between the devices. This release also adds support for GLBP protocol, support for multi-context Cisco ASA firewalls, support for discovery of ExtremeXOS devices, wireless support for HP830/850, and many other improvements and fixes as detailed in the release notes.
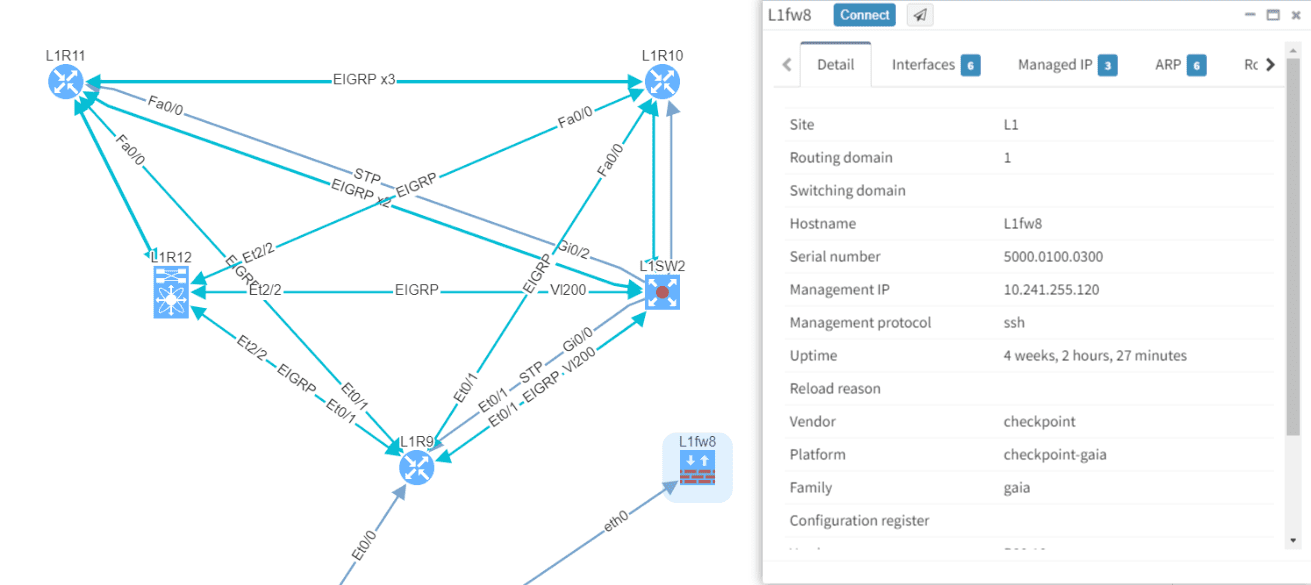
Clicking on a device or link in the network diagram now opens a detailed tooltip with information about the object. Information is contained in tabs of each window, and tabs depend on what functions the device is performing and what protocols it is running. For routers there is naturally more Layer 3 information, including ARP and active routing table entries. For switches there is much more Layer 2 detail, such as switchports and MAC address table entries.
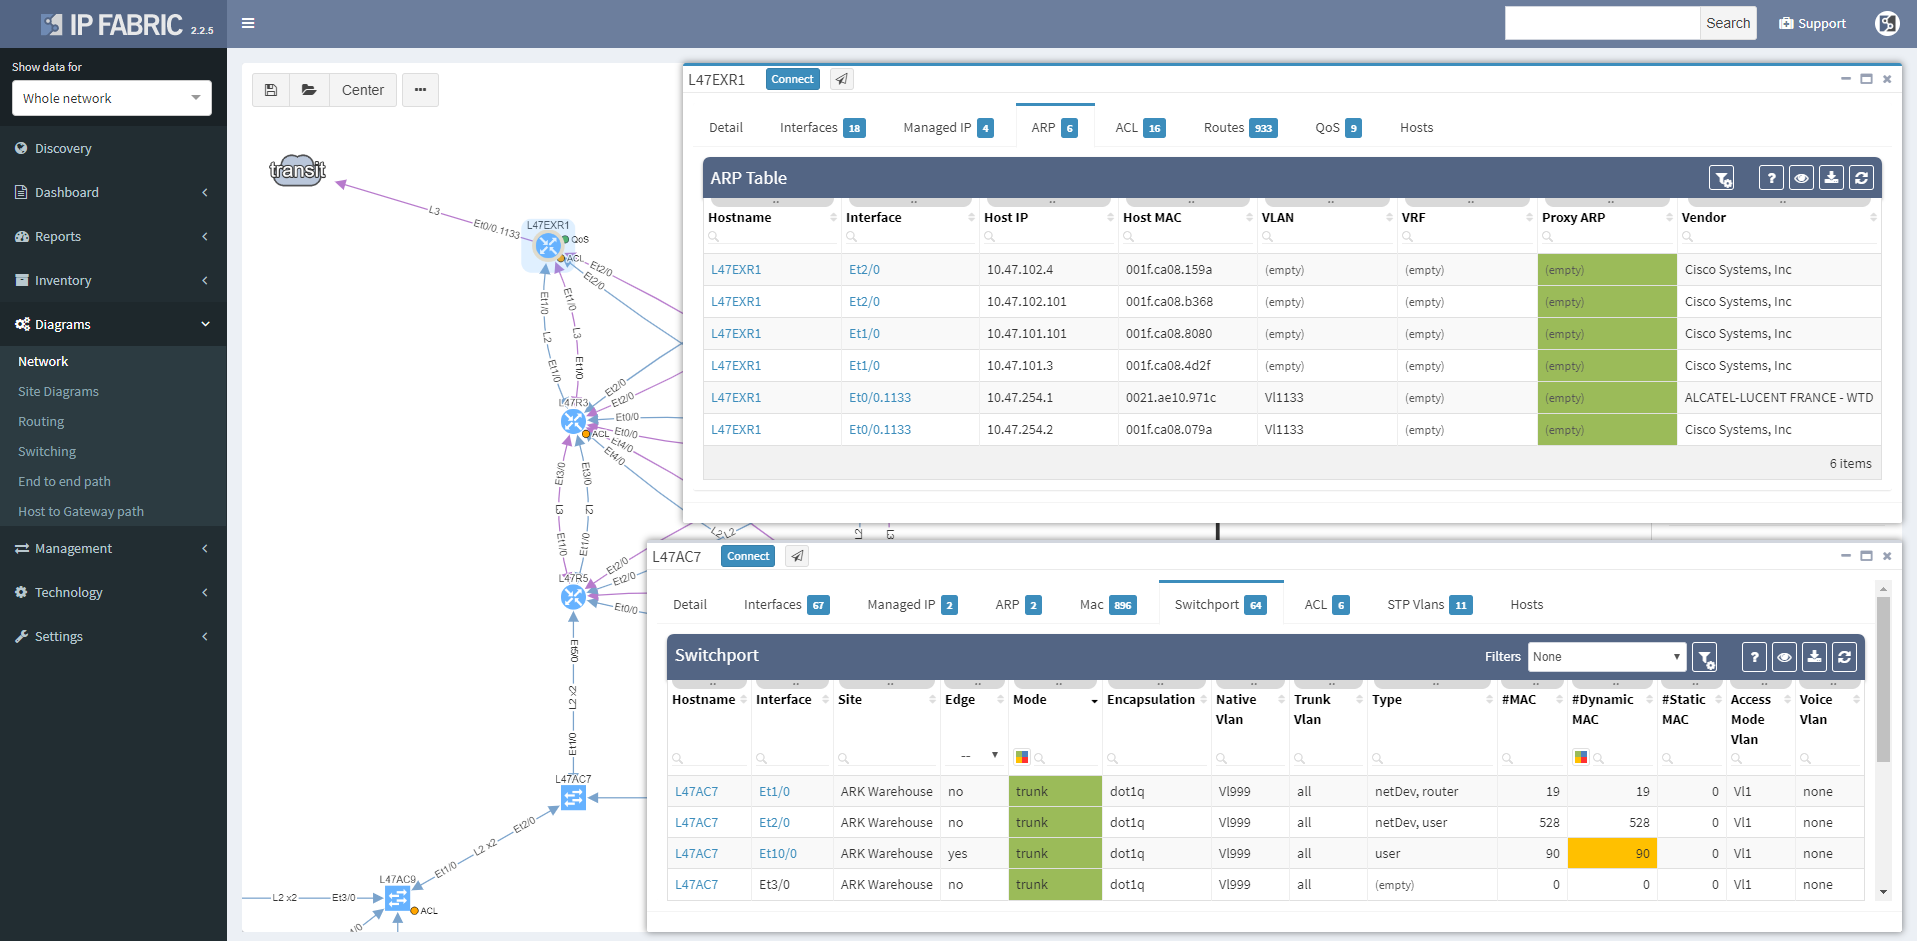
Wireless controller tooltips contain information about APs, firewalls about zones, and so on.
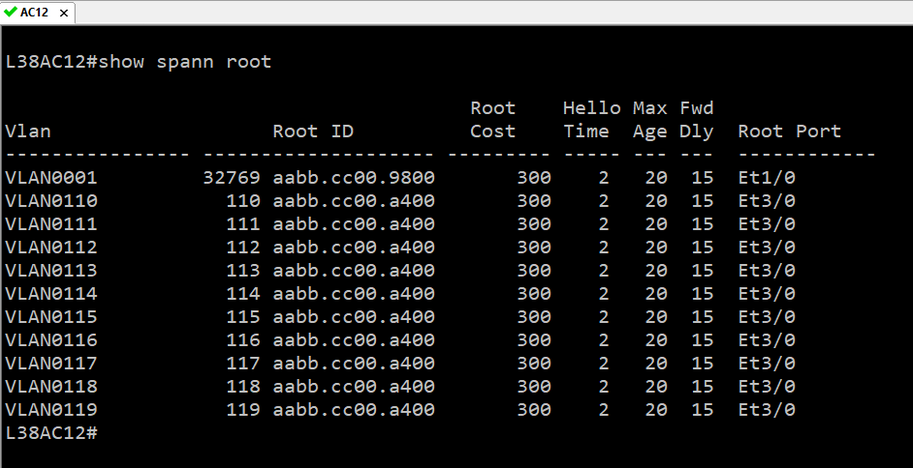
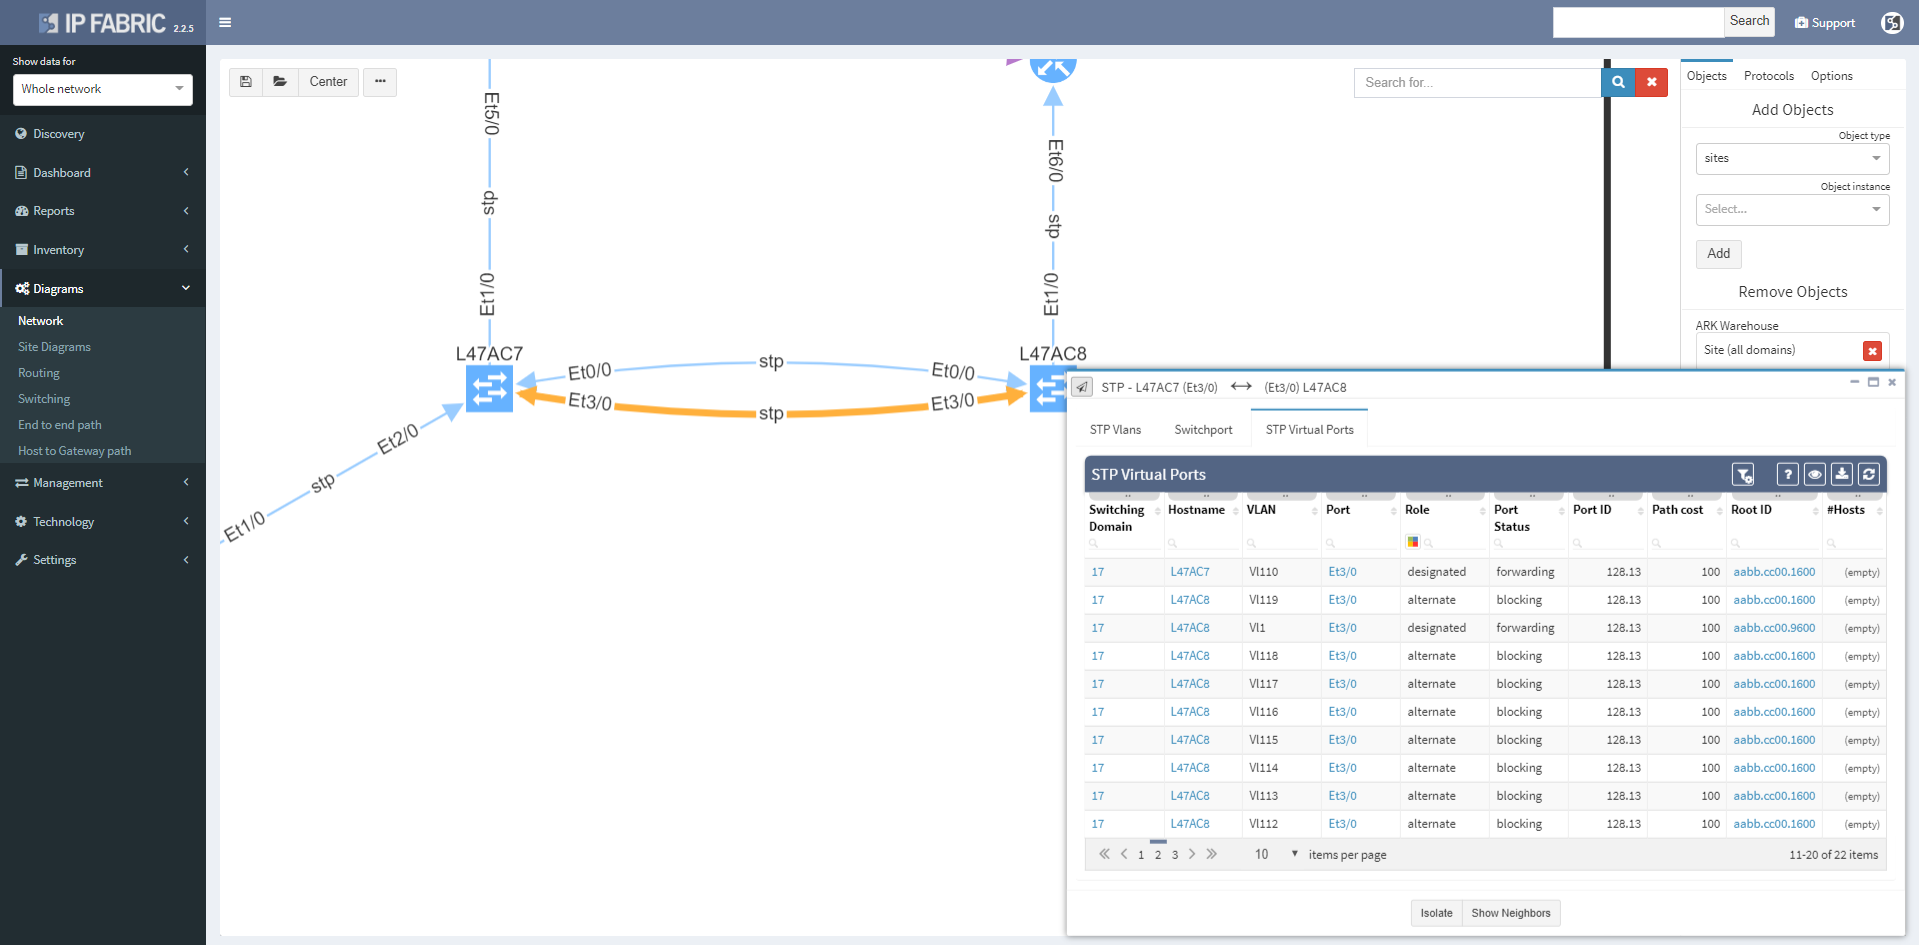
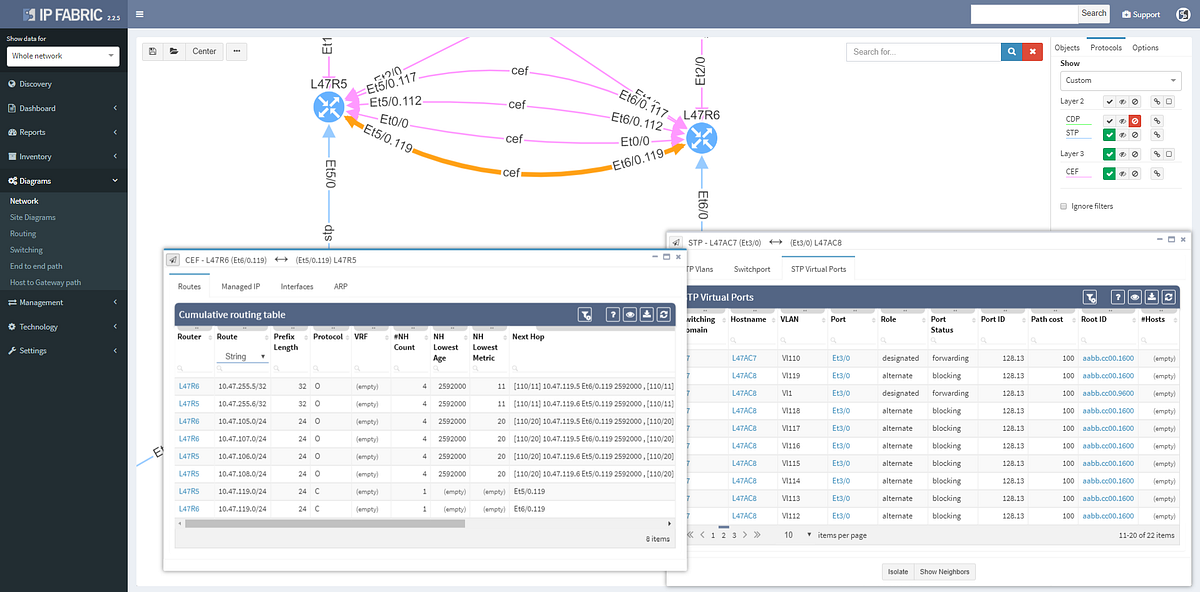
Clicking on a protocol link also opens a window with specific details relevant for the protocol, such as virtual ports and switchport details for the STP link
Or routes and for the routed links
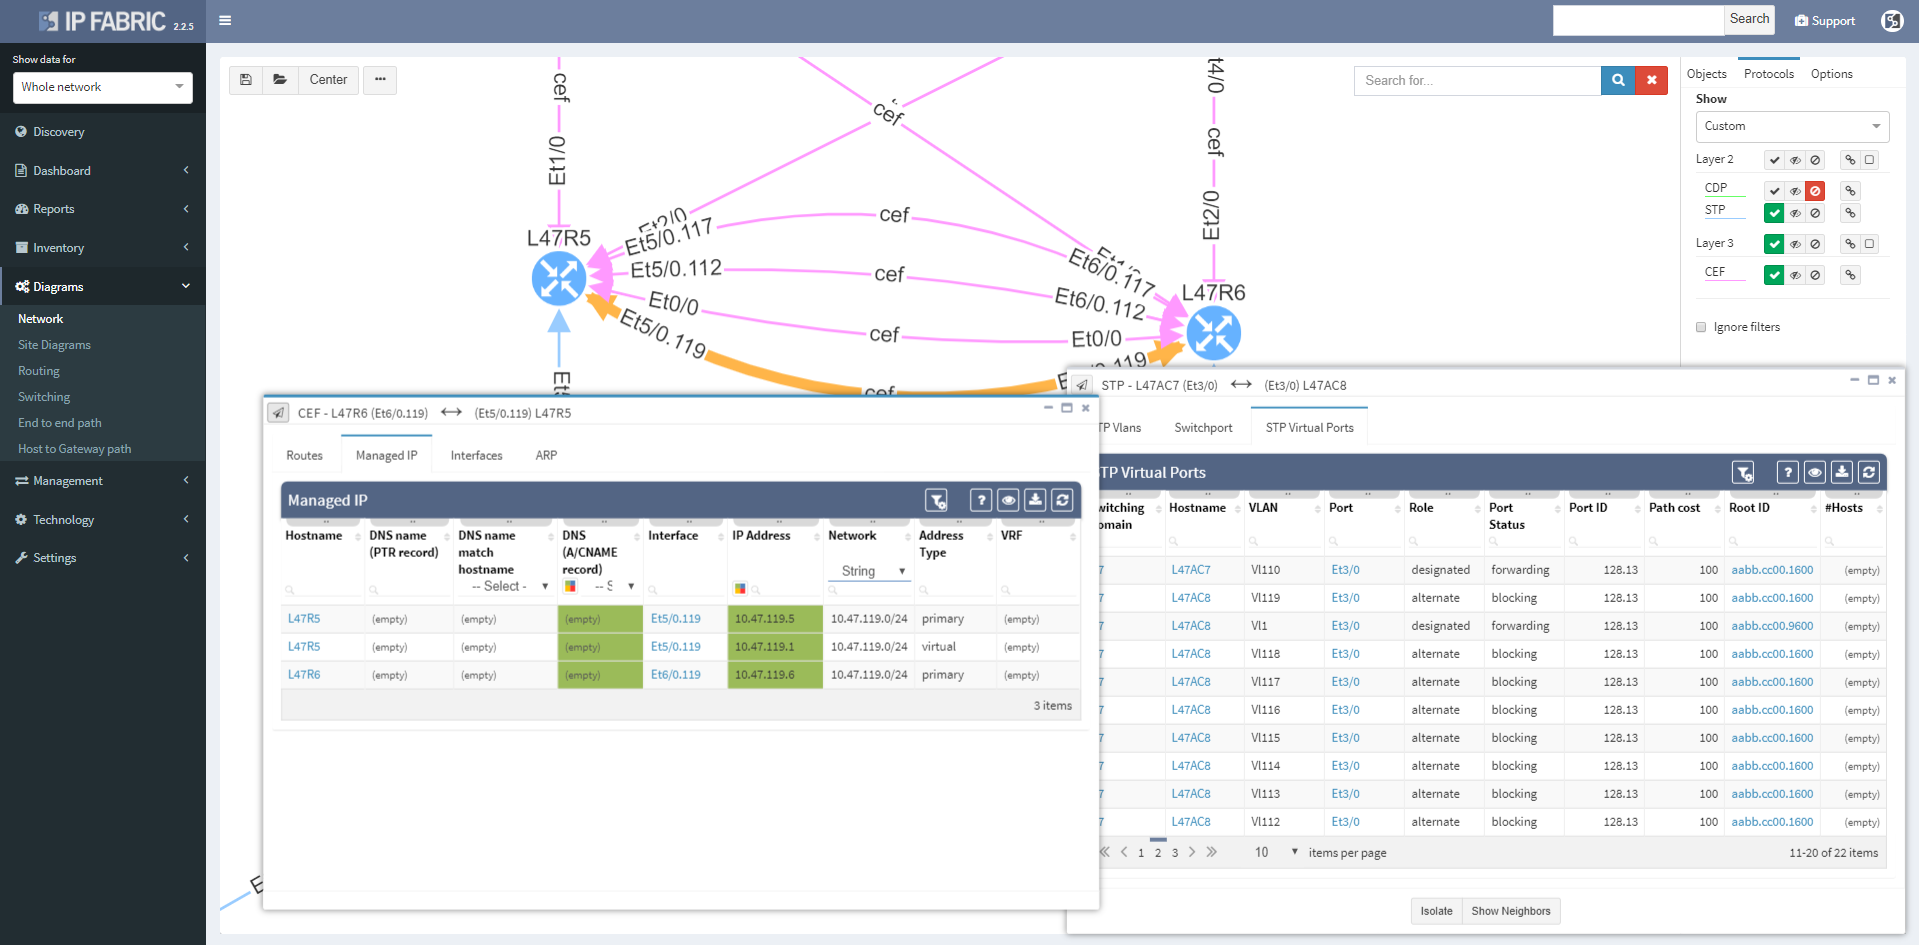
Switching tab to the Managed IP on the routed link shows active IP addresses on both sides of that link.
More time can now be spent in network diagrams and going through the detail without leaving the diagrams by managing tooltip windows. These can be resized, moved, or minimized as needed, and can be referred to later by clicking on the window icon in the bottom right corner of the browser window.

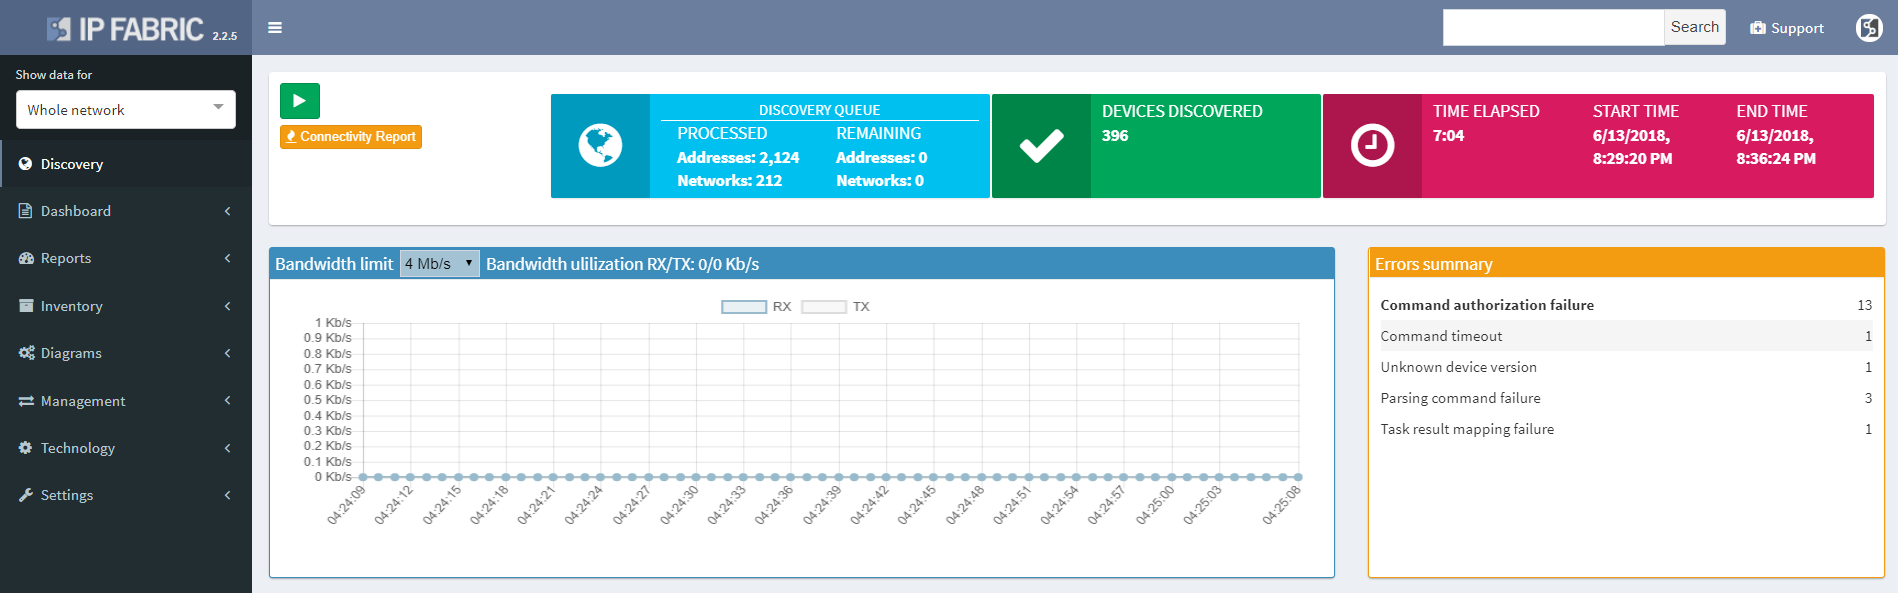
We haven’t focused exclusively on the diagrams, and the Discovery interface has been improved to include information about encountered errors during parsing of device output, grouping issues by error types and enabling to click through to specific output that caused a problem for IP Fabric. This enables to quickly spot issues such as missing authorization for a specific command, or inappropriate timeouts for very long command outputs.
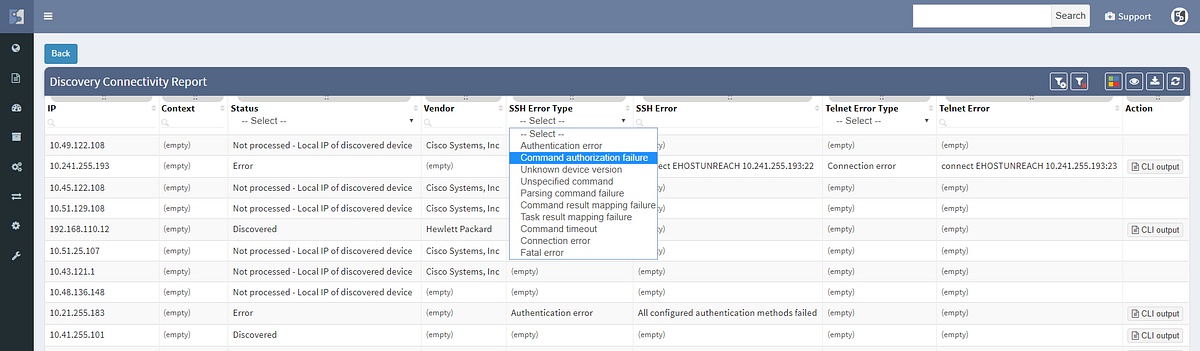
The discovery connectivity report itself has also been improved to include not only successful and failed attempts, but also skipped attempts when an IP in queue was found to be belonging to one of the discovered devices, or halted attempts when device being discovered was found to be discovered in parallel by another process (simultaneous duplicate discovery). A complete CLI output log is also available for each attempt.
If you’re interested in learning more about how IP Fabric’s platform can help you with analytics or intended network behavior reporting, contact us through our website, request a demo, follow this blog or sign up for our webinars.
If a user reports that a certain application is not working for them, especially after a migration or a change, how do you verify the connectivity?
Finding a path in a complex network can be hard enough by itself, having to map active switching and routing forwarding and balancing decisions, but additionally mapping security decisions of all the L2 and L3 filters take days if the network is complex enough, especially if multiple Zone Based firewall clusters are involved.
In this example we’ll see how IP Fabric can help you with a migration of a warehouse telemetry app that is publishing data from sensors to the secured servers from one port to another, verifying all forwarding parameters of end to end connectivity.
We can find the telemetry endpoints by looking at the network map of the warehouse.
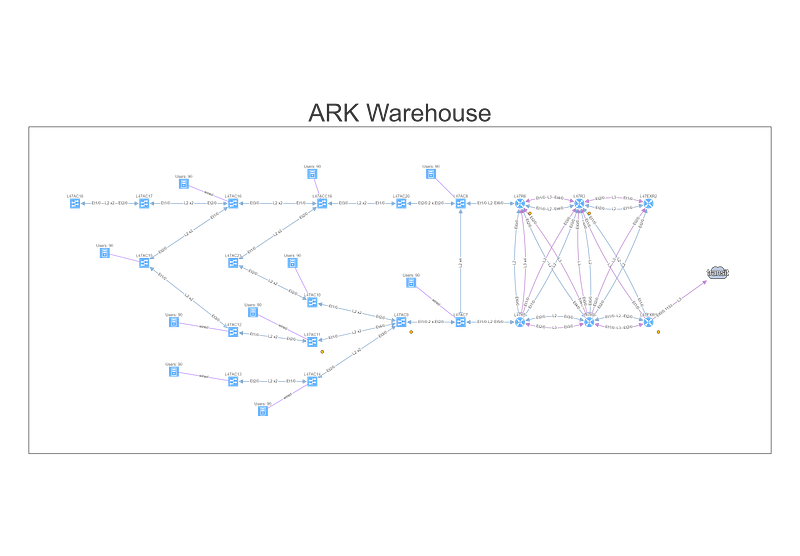
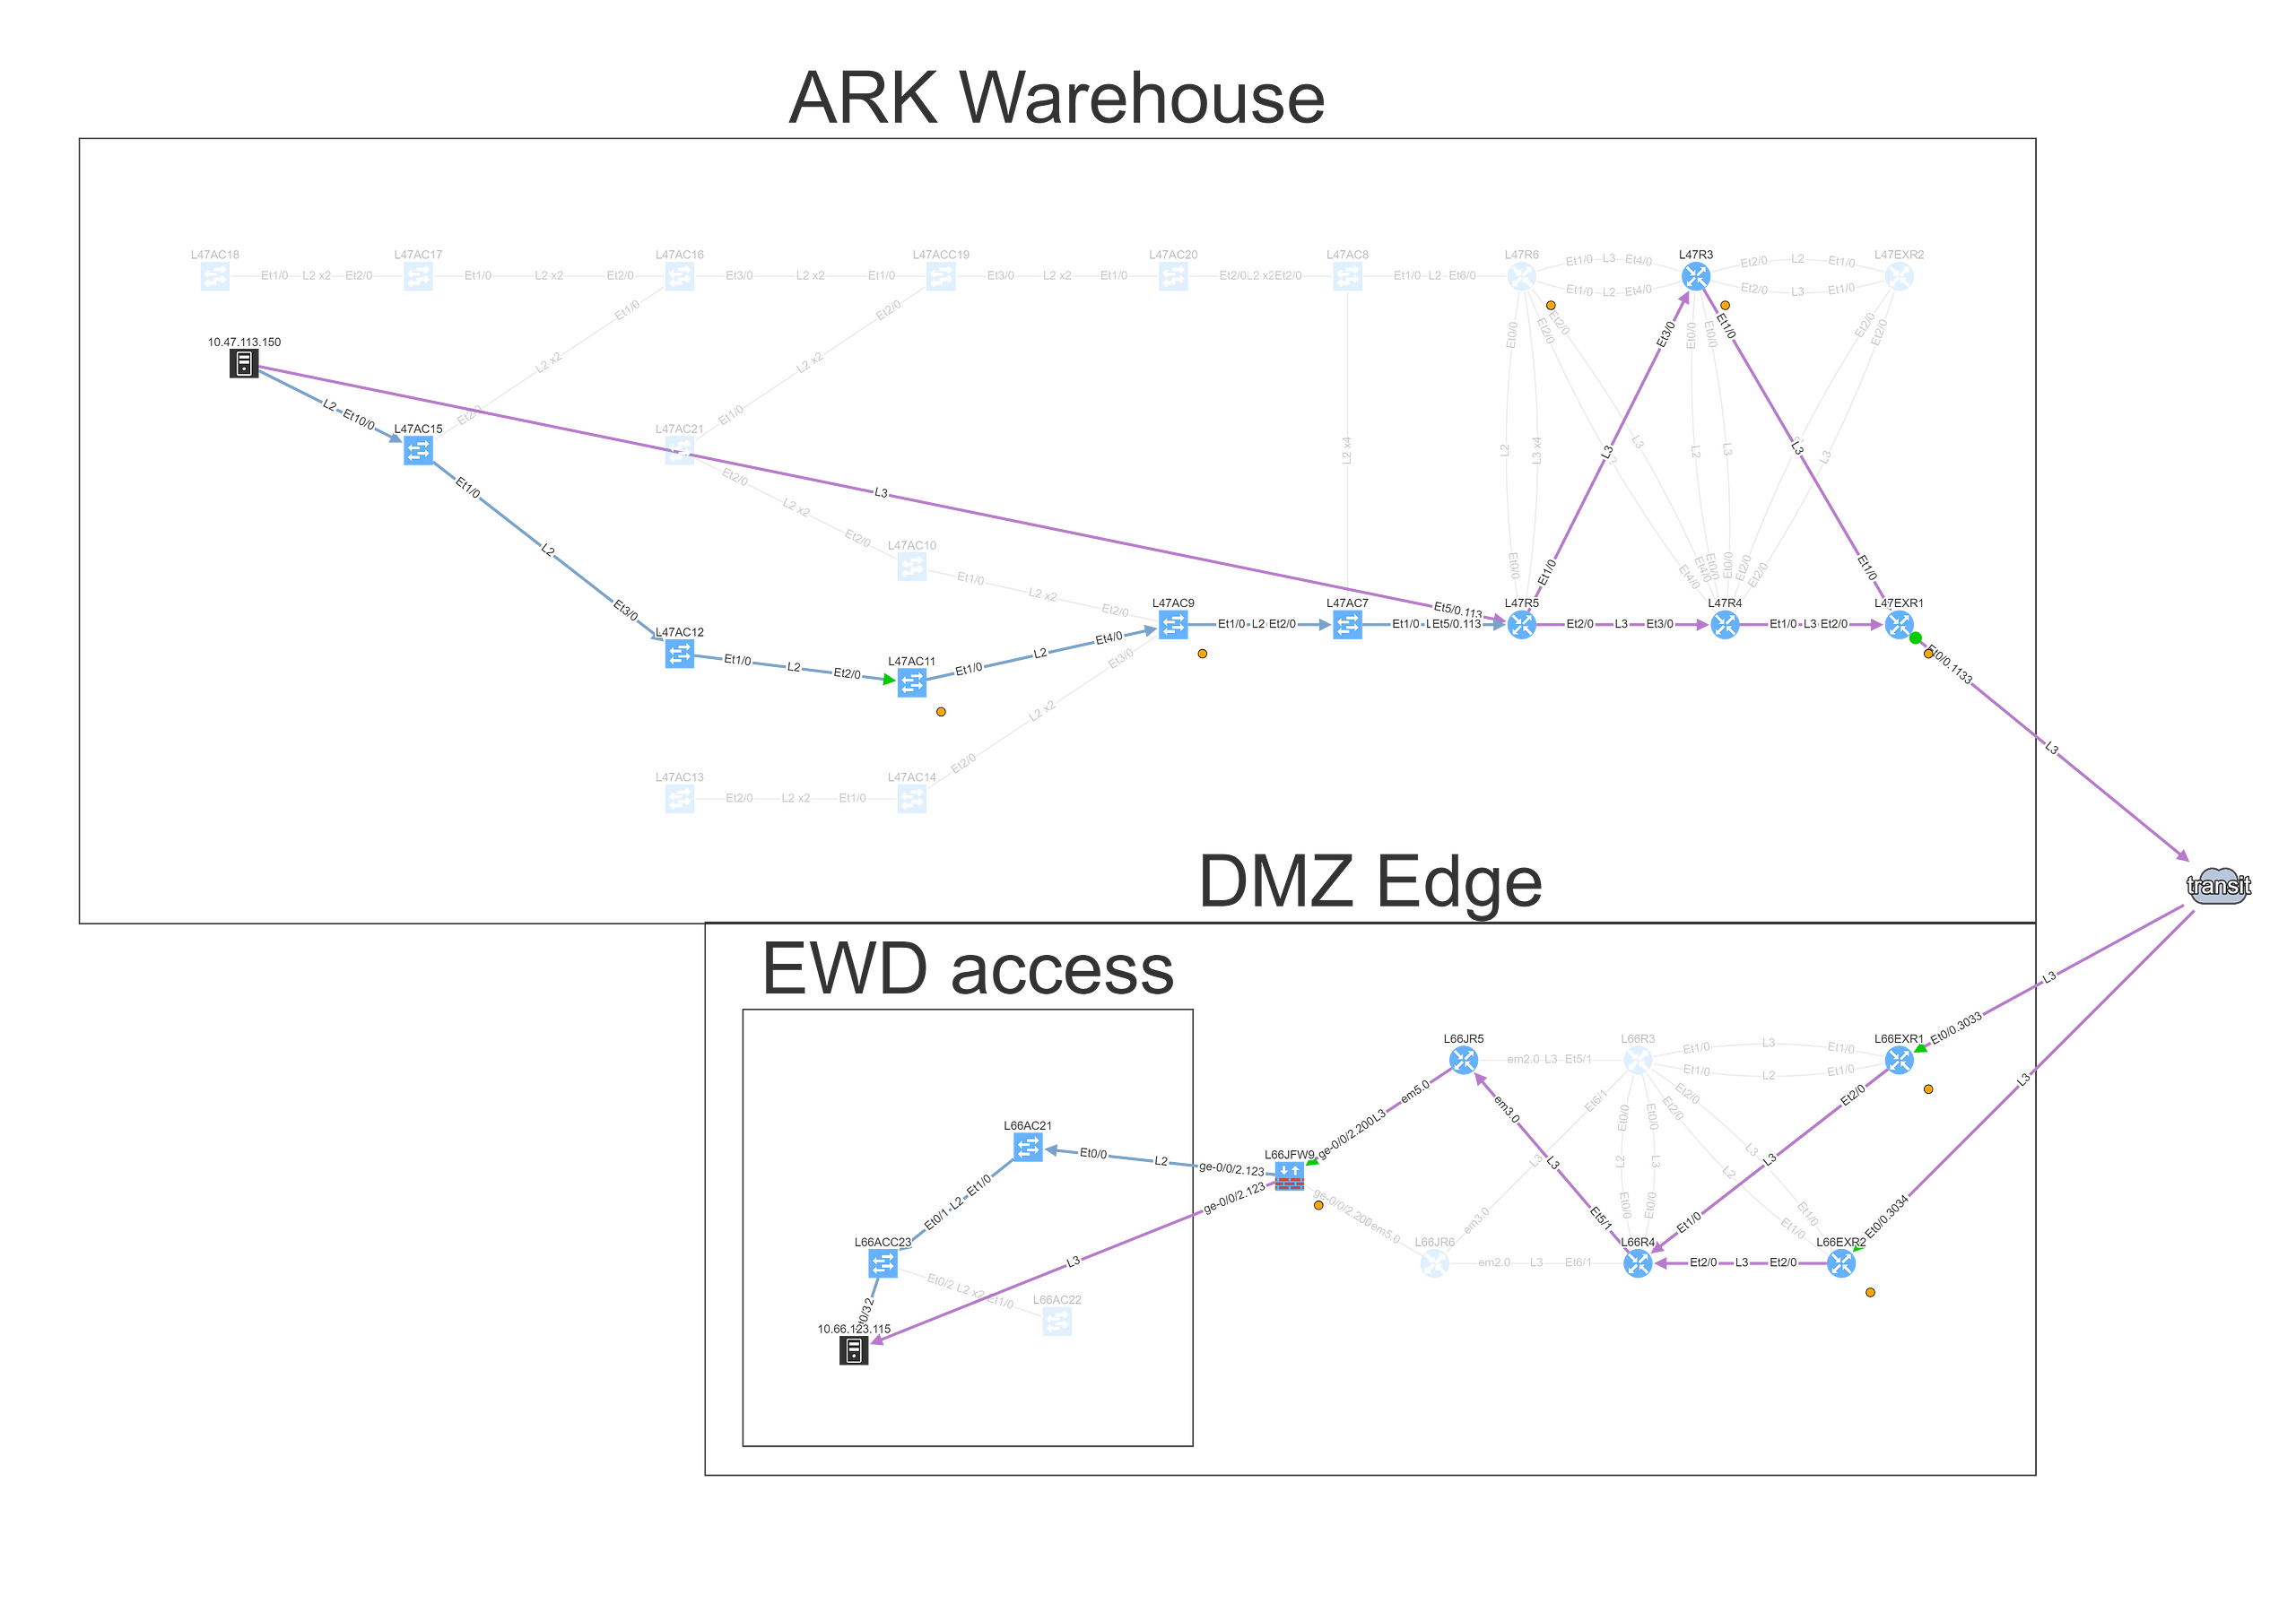
To understand topology better we can see where the site is connected to the transit, group forwarding topology into layer 3 and layer 2 islands, and then finding a specific endpoint connected to a switch that is far from the site’s edge, and using it in the End to End path lookup dialog window.
Alternatively, we can simply type part of the DNS name or an address, and find endpoint that way, which we’ll do for the server.
Looking at the path reveals a number of balancing and filtering decisions of interest, including layer 2 filters, wan edge filters, missing path redundancy within the site, and the filter on the Zone based firewall cluster.
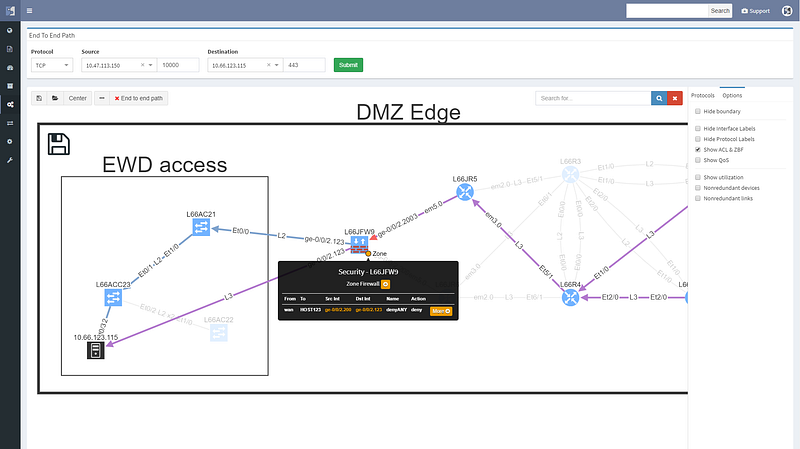
We can see that this particular flow would be allowed signified by the green arrow, and the matching decision at every point can be drilled down to reveal the detail of the policy.
Changing the port to 443 reveals that this traffic would not be allowed, and connectivity would not be possible, so policy on the firewall will need to be updated for the migration.
We can save path lookup result to refer to later or share with the team, and export the image for reporting purposes.
If you’re interested in learning more about how IP Fabric’s platform can help you with analytics or intended network behavior reporting, contact us through our website, request a demo, follow this blog or sign up for our webinars.


