Pete Crocker's (Director of Solutions and Product at IP Fabric) statement, "So you're still doing firefighting, and begging for some time to be able to do Network Automation" highlights a common scenario in many network operations centers, pointing to the ongoing challenge of moving from reactive to proactive network management. This statement serves as a reminder of this challenge, urging networking teams towards network automation. It was also a major theme at the recent NetDevOps Day in NYC!

Networking teams are often mired in the cycle of Reactive Management, responding to issues as they arise, rather than proactively managing the network infrastructure to prevent problems before they occur. This reactive stance is further exacerbated by manual configuration changes which are not only time-consuming but are prone to human error, creating a cascade of issues that demand immediate attention.
The lack of resources, both in personnel and expertise in automation skills, further stalls the progression towards a more efficient and proactive NetDevOps approach. This situation underscores the urgent need for a shift in mindset, from reactive to proactive management, and from manual to automated operations. Embracing this shift is crucial for networking teams to break free from the incessant firefighting, and move towards a more streamlined, automated, and efficient network management paradigm in line with NetDevOps principles.
The opening presentation in our day full of NetDevOps topics underscored the core principles of DevOps -achieving agility and maintaining a stable infrastructure as essential steps to modernize network operations. Reflecting on the '90s where Perl and Expect scripts were used, it seems not much has changed. Network engineers are still using random scripts from random locations (mainly their desktop), and this has become the norm for ensuring network compliance. The need for a more streamlined and robust network configuration, devoid of outdated decision patterns, was clearly expressed as the pathway towards better network automation practices. IP Fabric's platform aligns seamlessly with the NetDevOps model, bringing an API-first approach to networking.
Even in environments where network devices lack built-in APIs, IP Fabric bridges the gap by offering a structured way to access critical network data. This facilitation of data accessibility is crucial for automation, allowing for more seamless interactions and data exchanges between network operations and development teams. Real-time network insights and analytics provided by IP Fabric enable informed decision-making, which is aligned with the model's ethos of promoting agility while ensuring a stable infrastructure. Through this, teams can not only swiftly identify and address network issues, but also foster a collaborative culture, underpinning continuous improvement in network automation practices.
If you are interested in learning more about what you can do with IP Fabric and our API first principles, check out our public Gitlab repository!
The lack of substantial progress in network automation stems from existing complexity and the insufficient availability of direct APIs from hardware vendors. Felix, the CTO at Dartmouth, shared insights on navigating network automation in Brownfield networks - environments with existing, often outdated, infrastructures. Convincing stakeholders of the benefits of network automation is crucial, especially when the network is seen as a cost center rather than a profit center. The emphasis is on improving the bottom line, whether through enhancing reliability or streamlining self-service workflows.
Initiating network automation necessitates a clear plan, which includes choosing the right initial projects and ensuring the team has the required skills. Setting realistic expectations, fostering a culture of continuous feedback, and adopting an iterative approach are fundamental for the success of network automation initiatives.
Nathanael Jean-Francois, the Senior Director of Edge Architecture at NS1, stressed the importance of having a single source of truth (SOT) when managing network configurations and data. Tools like Netbox can serve as centralized repositories, enabling streamlined data management and provisioning processes.

Embracing Simulation and Emulation: The Containerlab Discussion
On the other hand, Pete and Jerrod from Nokia highlighted a new approach to networking, touching on concepts like emulation and simulation. Tools like containerlab, which allow for quick setup of emulated networks, bring in a level of agility and experimentation that is crucial for modern network operations.
However, as with any technology, there are limitations to be considered. The remarks bring to light some inherent challenges, like the ability to emulate only parts of the network or certain technologies, underscoring that a complete Network Digital Twin scenario might be a distant reality. The distinction between simulation and emulation is key here - simulation might offer a more comprehensive representation of network behaviors, but it sometimes fall short as a less realistic environment when compared to emulation. While containerlab provides a robust platform for emulating network configurations, understanding and accepting its limitations is crucial for leveraging its capabilities effectively within the NetDevOps paradigm.
Community-Driven Projects
Some other topics covered open-source tools and community-driven projects like Arista Validated Designs (AVD), which provide extensible data models for network architecture as code. The collaboration within the community accelerates the development and adoption of such tools, promoting a culture of shared learning and continuous improvement. The journey towards NetDevOps is layered with challenges, from overcoming the fear of automation to ensuring a machine-focused process. Engaging different teams, establishing a single source of truth, and embracing open-source tools are steps in the right direction, paving the way for a more agile, automated, and collaborative network operations landscape.
Want to learn more about IP Fabric's Open Source projects? Check out some of our other blog posts:
Getting Started with IP Fabric's APIs
Getting Started with IP Fabric and Netbox
Create your own Reporting with IP Fabric Data

My fellow Solution Architect, Justin, stated in his blog post about API Programmability that
One of the most difficult parts in a Network Automation journey is collecting the data you need.
and that
IP Fabric extracts your important network data directly from the devices and places it in our vendor-neutral data models which remove this parsing burden from your development teams.
We are now pleased to announce the release of our IP Fabric Ansible collection to allow network professionals to get the information they need into one of the most popular network automation frameworks available.
So, what is an Ansible collection? Ansible collections are a distribution format for Ansible content. It is a way to package and distribute Ansible roles, modules, and plugins as a single archive file. A collection can include multiple roles, modules, and plugins and can be used to organize and distribute related content together. One of the main benefits of collections is their ability to be shared and reused across multiple projects.
Our collection is currently hosted on our GitLab, distributed through Ansible Galaxy and contains the following:
Find our full collection documentation here.
Before the Ansible collection can be used there are some basics that need to have to get going:
pip3 install ipfabricpip3 install ansibleOnce the pre-requisites are installed the Ansible collection can be installed on the command line by using the following command: ansible-galaxy collection install community_fabric.ansible.
Ansible dynamic inventory is a feature that allows Ansible to automatically discover and manage hosts in a dynamic environment. Instead of specifying the hosts to be managed in a static inventory file, a dynamic inventory retrieves the host information from an external source, in our case, it's IP Fabric.
There can be several benefits to dynamic inventories over static inventories:
plugin: community_fabric.ansible.inventory
provider:
  base_url: https://<url>
  token: <token>
compose:
  ansible_network_os: family
keyed_groups:
  - key: family
    prefix: ""
    separator: ""
The file above if saved as ipf_inventory.yml upon execution will query IP Fabric and as a result return a list of hosts with information IP Fabric has provided such as site name, uptime etc. The highlighted code in red will create a dynamic variable for each host called ansible_network_os which is the value of the key family returned from IP Fabric. The section highlighted in orange will group devices based on their device families such as eos, ios and junos. More parameters are available and they can be found in the documentation.
Ansible modules are pre-written scripts that can be used to perform specific tasks on managed hosts. They are written in Python and can be used to perform tasks such as installing software and configuring network devices. Ansible modules can be used in playbooks, which are written in YAML and describe a set of tasks to be executed on managed hosts.
In the initial release of the Ansible collection, there are three modules, snapshot_info, snapshot and table_info. Let's take a look at each of these modules and see what they do.
snapshot_infoThis module is intended to gather snapshot information from IP Fabric such as the name, ID, how many devices are in the snapshot and much more.
- name: Snapshot Info
  community_fabric.ansible.snapshot_info:
    provider:
      base_url: https://<url>
      token: <token>
    snapshot_id:
The above task shows how to use this module within a playbook. The provider information contains how to connect to the IP Fabric API but this can be achieved with environment variables. Going forward I will exclude the provider parameter from the examples. The last parameter is snapshot_id, this is an optional parameter that if not used will return a list of loaded/unloaded snapshots to the user. If the snapshot_id is specified then only one snapshot will be returned.
snapshotThe snapshot module allows snapshots to be manipulated from within Ansible. Everything from starting a discovery to deleting a snapshot can be done with this module.
- name: Start Snapshot (state=present)
  community_fabric.ansible.snapshot:

- name: Delete Snapshot
  community_fabric.ansible.snapshot:
    snaphot_id: 12dd8c61-129c-431a-b98b-4c9211571f89
    state: absent

- name: Unload Snapshot
  community_fabric.ansible.snapshot:
    snaphot_id: 12dd8c61-129c-431a-b98b-4c9211571f89
    state: unload

- name: Clone Snapshot
  community_fabric.ansible.snapshot:
    snaphot_id: 12dd8c61-129c-431a-b98b-4c9211571f89
    state: clone

- name: Clone Snapshot
  community_fabric.ansible.snapshot:
    snaphot_id: 12dd8c61-129c-431a-b98b-4c9211571f89
    devices:
      - 9AMSST2E75V
    state: rediscover
There are currently eight states that the snapshot module can have each performing a different function.
| State | Description |
present | present is the default state it will start a new discovery with the global settings. If the snapshot_id parameter is present with snapshot_name and snapshot_note it will edit a snapshot to contain specific name and note. |
absent | Absent will delete a snapshot when the snapshot_id parameter is present. |
load/unload | This state will unload or load a specific snapshot when the snapshot_id is present. |
lock/unlock | This state will unlock or lock a specific snapshot when the snapshot_id is present. |
clone | When the snapshot_id is specified it will clone the snapshot and load it. |
rediscover | Rediscover allows a list of device serial numbers to be specified in the devices parameter which will be rediscovered in the specified snapshot with snapshot_id. |
table_infoThe table_info module allows Ansible users to gather data from all IP Fabric tables such as NTP Summary, VRF Interfaces, Port Channels and many more. We want our IP Fabric users to get as much of the information we provide into the tools that they love and this module is great for that.
- name: Snapshot Info
community_fabric.ansible.table_info:
# snapshot_id:
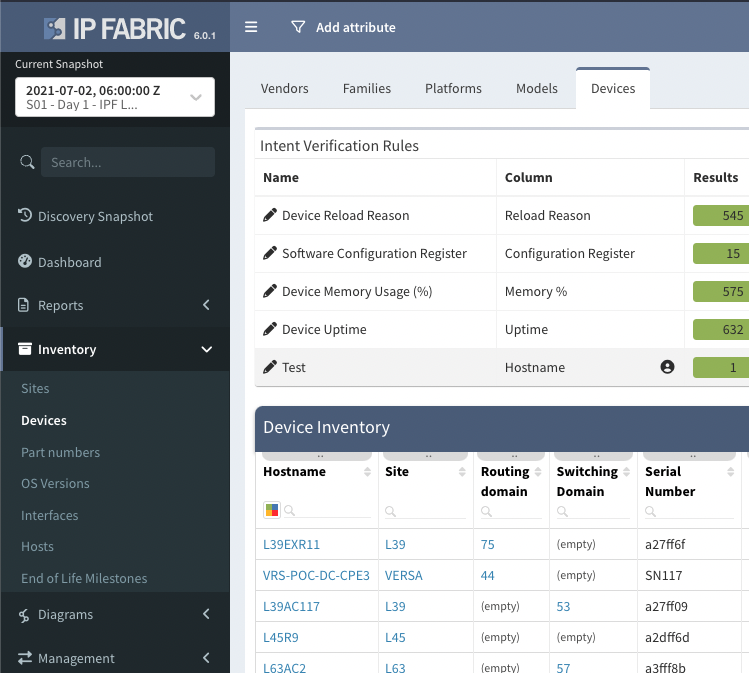
technology: inventory
table: devicesThis module has three key parameters technology, table and snapshot_id. The technology parameter allows a user to specify what area of IP Fabric to gather the information from each technology that has a corresponding table. The example above shows the technology inventory with the table of devices this corresponds to our UI as we can find the devices table within the inventory menu item within our product. If snapshot_id is not specified the latest loaded snapshot will be used.
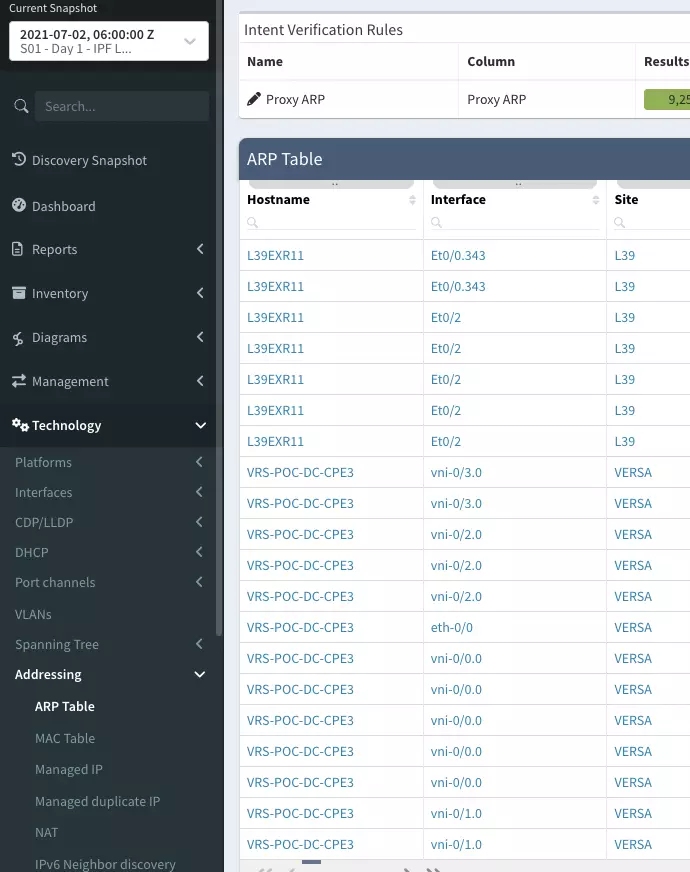
Let's provide another example - say we want to return the ARP table we can use the technology of 'addressing' and the table of 'arp_table'. A full list of available technologies and tables can be found in the module documentation.
- name: Find IP address belonging to a MAC address
  community_fabric.ansible.table_info:
    # snapshot_id:
    technology: addressing
    table: arp_table
    filter:
      mac:
        - like
        - 5254.00d3.45c5
    columns:
      - hostname
      - intName
      - ip
      - mac
As we can see, we are gathering the ARP table from IP Fabric. However, we have highlighted some new parameters that could be used within this module. In red we have a filter this allows users to add as many filters required to the API query into IP Fabric as they need. This example only returns ARP entries that have a specific MAC address. The columns parameter in orange allows the user to specify columns to be returned by the module to make the returned response more concise.
The final example shows how to use the table_info module to return information from IP Fabric that has failed an Intent Verification Rule.
- name: Filter and noncompliant NTP configurations
  community_fabric.ansible.table_info:
    # snapshot_id:
    technology: management
    table: ntp_summary
    filter: {sources: ["color", "eq", "30"]}
    report: /technology/management/ntp/summary
  register: ntp_summary
Using the filter and the report parameter allows tables to be returned with specific Intent Verification Rules selected. This can be very useful for Ansible users as we can use this information to auto-remediate any configuration discrepancies (as I will demonstrate shortly).
Ansible lookup plugins allow Ansible to access data from external sources, such as data stored in a file, a database, or a web service. These plugins are called during task execution to retrieve data that can be used to dynamically construct tasks, such as generating a list of hosts to target for a specific operation. Lookup plugins can be used in conjunction with other Ansible modules to retrieve and manipulate data as part of a playbook.
table_infoThe table_info lookup plugin is the same as the table_info module shown above. The plugin allows you to perform the query within different areas of a playbook, such as a template or a string as part of a module. The following code is the same query as the last within the debug module. See the documentation for more information.
- name: Check non-compliant devices
  debug:
    msg: "Number of non-compliant devices: {{ lookup('community_fabric.ansible.table_info', 'management', 'ntp_summary', filter={'sources': ['color', 'eq', '30']}, report='/technology/management/ntp/summary', base_url=provider.base_url, token=provider.token, verify=False, snapshot_id=new_snapshot.data.id) | length }}"
  delegate_to: localhost
  run_once: true

## output example
localhost: Number of non-compliant devices: 24Now that we have had a brief overview of all the components, plugins, and modules available in the Ansible Collection, let's see how we can use them in practice.
---
- hosts: all
  gather_facts: False

  tasks:
    - name: Filter and select columns on technology table
      community_fabric.ansible.table_info:
        provider: "{{ provider }}"
        # snapshot_id: 07b338d0-4cc1-48e9-a99d-12ce100b0bb8
        technology: management
        table: ntp_summary
        filter: {sources: ["color", "eq", "30"]}
        report: /technology/management/ntp/summary
      delegate_to: localhost
      run_once: true
      register: NTP_DATA

    - debug:
        msg: "Number of non-compliant devices: {{ NTP_DATA.data | length }}"
      delegate_to: localhost
      run_once: true

    - name: Configure Junos NTP
      junipernetworks.junos.junos_ntp_global:
        config:
          servers: "{{ ntp.servers }}"
        state: overridden
      when: ansible_network_os == 'junos'

    - name: Configure EOS NTP
      arista.eos.eos_ntp_global:
        config:
          servers:
            - server: "{{ ntp_server }}"
        state: overridden
      when: (ansible_network_os == 'eos') and (item.hostname == hostvars[inventory_hostname]['hostname'])
      loop: "{{ NTP_DATA.data }}"

    - name: Configure IOS NTP
      cisco.ios.ios_ntp_global:
        config:
          servers:
            - server: "{{ ntp_server }}"
              vrf: MGMT
        state: overridden
      when: (ansible_network_os == 'ios') and (item.hostname == hostvars[inventory_hostname]['hostname'])
      loop: "{{ NTP_DATA.data }}"

    - name: Start Snapshot
      community_fabric.ansible.snapshot:
        provider: "{{ provider }}"
      delegate_to: localhost
      run_once: true
      register: new_snapshot

    - name: check snapshot
      community_fabric.ansible.snapshot_info:
        provider: "{{ provider }}"
        snapshot_id: "{{ new_snapshot.data.id }}"
      register: result
      until: result.data.status == 'done'
      retries: 20
      delay: 30
      delegate_to: localhost
      run_once: true

- name: Check non-compliant devices
  debug:
    msg: "Number of non-compliant devices: {{ lookup('community_fabric.ansible.table_info', 'management', 'ntp_summary', filter={'sources': ['color', 'eq', '30']}, report='/technology/management/ntp/summary', base_url=provider.base_url, token=provider.token, verify=False, snapshot_id=new_snapshot.data.id) | length }}"
  delegate_to: localhost
  run_once: true
The code above is very primitive, but it allows for the auto-remediation of NTP via IP Fabric and Ansible. Firstly, the playbook uses the dynamic inventory when running this playbook against all hosts. The first task we have seen before collects the number of non-compliant devices with NTP incorrectly configured this is saved to the NTP_DATA variable. The second task is a debug that shows the number of non-compliant devices to the user.
The configure statements for junos, ios and eos loop over the data within the NTP response and only configure the correct NTP server if the conditionals are met. These conditionals first check that the current host is a junos, ios or eos device, and the second check makes sure that the hostname of the current device matches the hostname from the NTP output from IP Fabric. The device can be configured with the correct NTP server. if these are both correct. Once the configuration is complete, Ansible will start a new snapshot of the network. It will wait for the snapshot to be completed until we check the non-compliant devices again using the lookup command.
The command to execute this playbook would look like the following:
ansible-playbook -i ipf_inventory.yml pb.4.fix-ntp.yml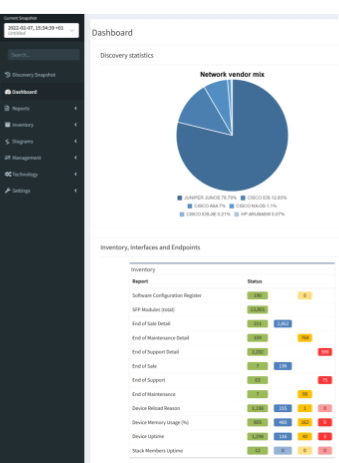
In Part 3, we discussed using the python-ipfabric SDK to interact with IP Fabric's API - did you know that you can also use it to create diagrams using the API?
Find a coding example on GitLab at 2022-05-20-api-programmability-part-4-diagramming.
Blog post updated 2023-11-15 for ipfabric SDK version 6.5.0.
There are four options for returning data in the Diagram class.
IPFClient().diagram.png(): Returns PNG image as a bytes string.IPFClient().diagram.svg(): Returns SVG image as a bytes string.IPFClient().diagram.json(): Returns the raw JSON from IP Fabric.IPFClient().diagram.model(): Takes the raw JSON and converts it into a python object with type hints.Each of these methods has five input parameters, and only the first one is required:
This is the most basic diagram as it takes a single IP address. The imports will differ depending on the type of graph.
# 1_host2gateway.py
from os import path

from ipfabric import IPFClient
from ipfabric.diagrams import Host2GW

if __name__ == '__main__':
    ipf = IPFClient()  # IPFClient(base_url='https://demo3.ipfabric.io/', auth='token', verify=False, timeout=15)

    # Get Random Host
    host = ipf.inventory.hosts.all(filters={"ip": ["cidr", "10.35.0.0/16"]})[3]['ip']

    with open(path.join('path_lookup', '1_host2gateway.png'), 'wb') as f:
        f.write(ipf.diagram.png(Host2GW(startingPoint=host)))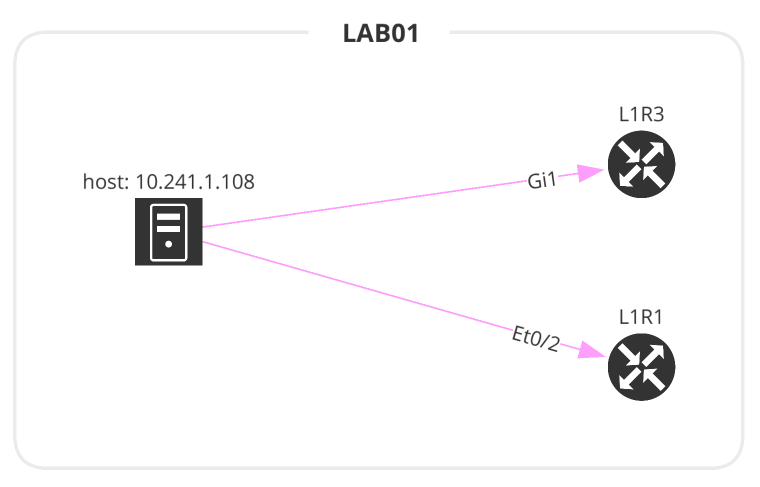
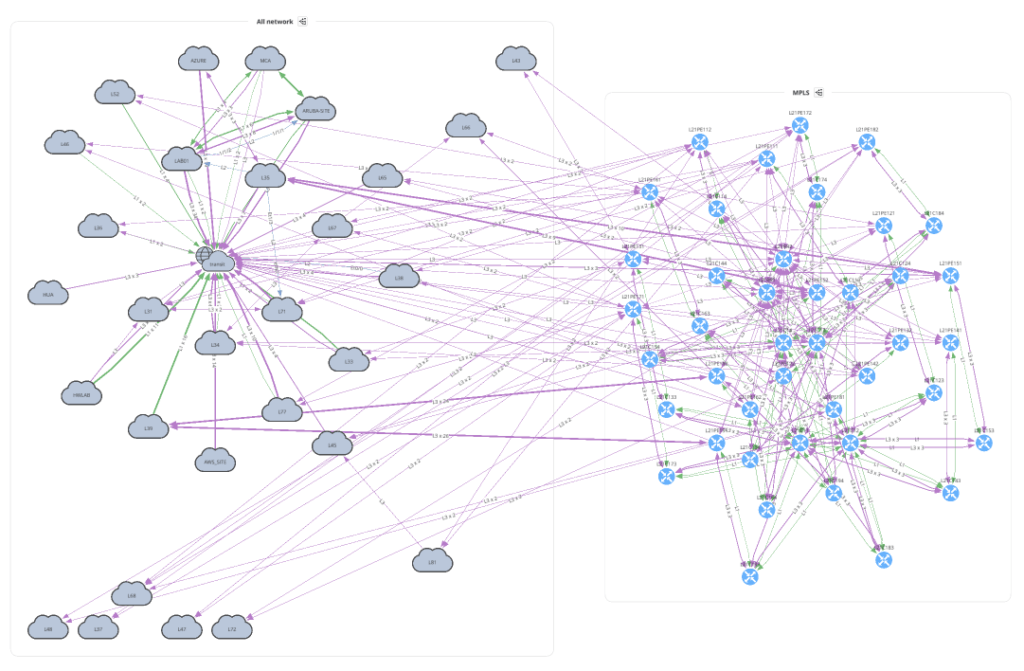
The Network class accepts 3 input parameters. If no parameters are defined, this will create a graph similar to going to the UI and Diagrams > Network.
site name or a List of site names.# 2_network.py
from os import path
from ipfabric import IPFClient
from ipfabric.diagrams import Network, Layout
if __name__ == '__main__':
ipf = IPFClient() # IPFClient(base_url='https://demo3.ipfabric.io/', auth='token', verify=False, timeout=15)
with open(path.join('network', '2_1_network.png'), 'wb') as f:
f.write(ipf.diagram.png(Network(sites='MPLS', all_network=True)))
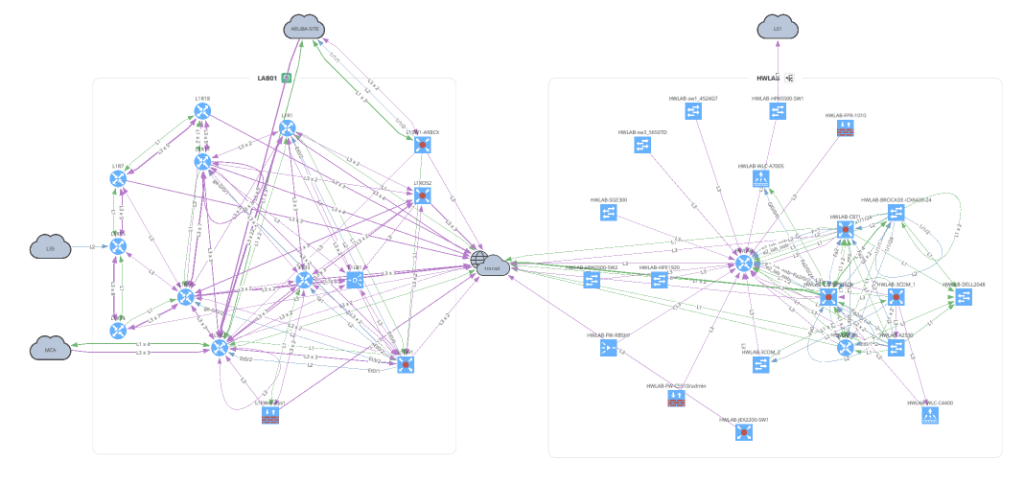
with open(path.join('network', '2_2_network.png'), 'wb') as f:
f.write(ipf.diagram.png(Network(sites=['LAB01', 'HWLAB'], all_network=False)))
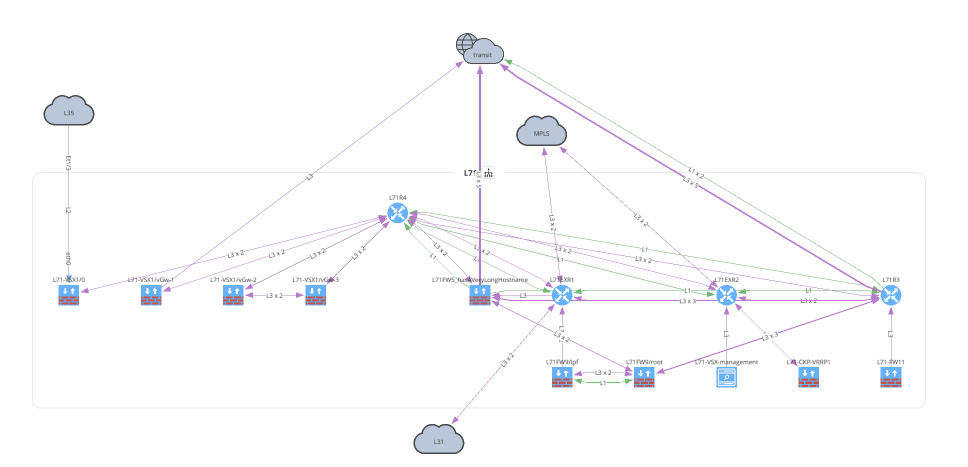
with open(path.join('network', '2_3_network.png'), 'wb') as f:
f.write(ipf.diagram.png(
Network(sites='L71', all_network=False, layouts=[Layout(path='L71', layout='upwardTree')])
))
Before moving on to Unicast and Multicast let's take a look at how to overlay a snapshot comparison or specific intent rule onto your graph. You can apply this to any type of graph.
# 3_network_overlay.py
from os import path

from ipfabric import IPFClient
from ipfabric.diagrams import Network, Overlay

if __name__ == '__main__':
    ipf = IPFClient()  # IPFClient(base_url='https://demo3.ipfabric.io/', auth='token', verify=False, timeout=15)

    with open(path.join('network', '3_1_network_snap_overlay.png'), 'wb') as f:
        f.write(ipf.diagram.png(Network(sites='MPLS', all_network=False),
                                    overlay=Overlay(snapshotToCompare='$prev')))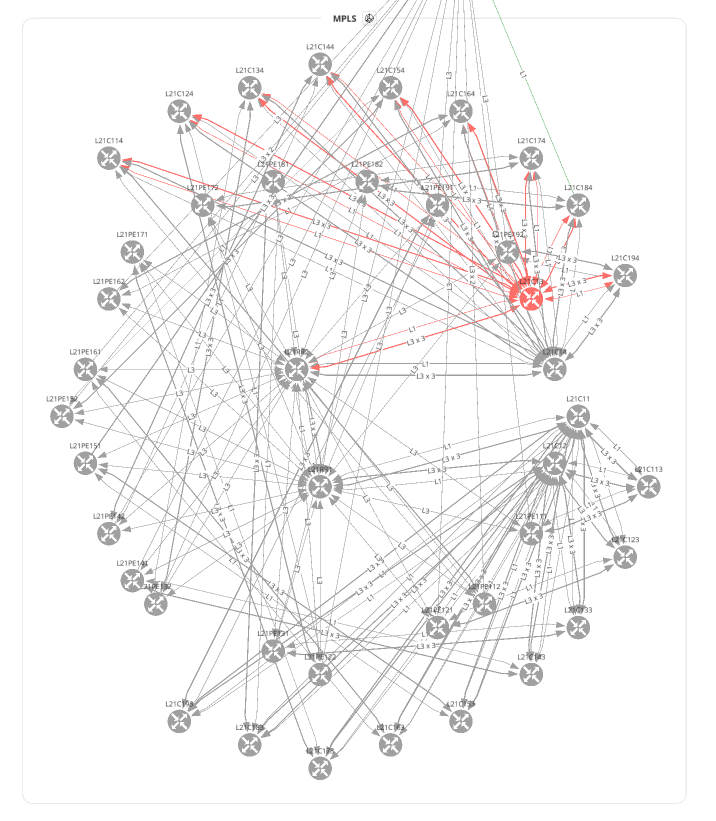
To overlay an Intent Rule you must first get the ID of the rule to submit. In this example, we are using the ipfabric package to load the intents and get a rule by name. Find more examples of extracting intent rule IDs here.
# 3_network_overlay.py
from os import path

from ipfabric import IPFClient
from ipfabric.diagrams import Network, Overlay

if __name__ == '__main__':
    ipf = IPFClient()  # IPFClient(base_url='https://demo3.ipfabric.io/', auth='token', verify=False, timeout=15)

    # Get intent rule ID
    ipf.intent.load_intent()
    intent_rule_id = ipf.intent.intent_by_name['NTP Reachable Sources'].intent_id

    with open(path.join('network', '3_2_network_intent_overlay.png'), 'wb') as f:
        f.write(ipf.diagram.png(Network(sites=['L71'], all_network=False),
                                overlay=Overlay(intentRuleId=intent_rule_id)))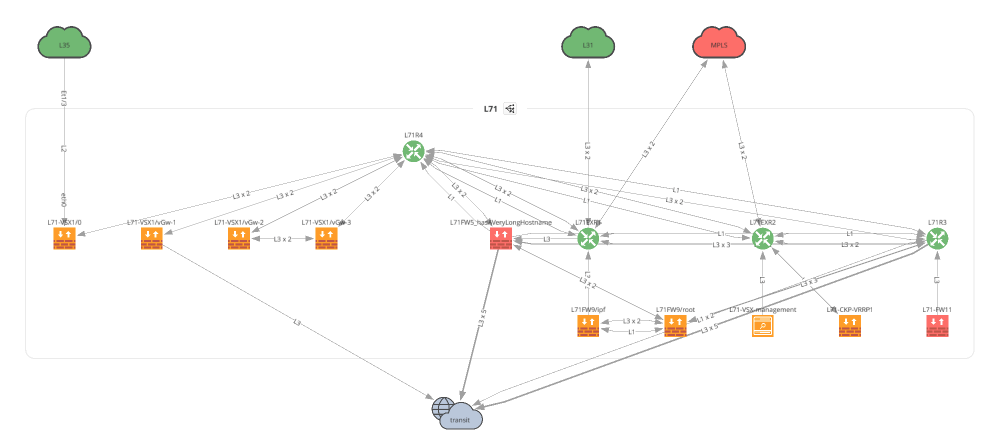
The next two examples make it a bit clearer why we first create a python object and then pass it into the diagramming functions. The amount of options required are quite lengthy, and this keeps your code cleaner and provides great type hints (see below). Additionally, it has many built-in checks to ensure you provide the correct data before submitting the payload to IP Fabric and returning an error.
For all valid ICMP types please refer to icmp.py.
# 5_unicast_path_lookup.py
from os import path

from ipfabric import IPFClient
from ipfabric.diagrams import icmp, Unicast

if __name__ == '__main__':
    ipf = IPFClient()  # IPFClient(base_url='https://demo3.ipfabric.io/', auth='token', verify=False, timeout=15)

    unicast_icmp = Unicast(
        startingPoint='10.47.117.112',
        destinationPoint='10.66.123.117',
        protocol='icmp',
        icmp=icmp.ECHO_REQUEST,  # Dict is also valid: {'type': 0, 'code': 0}
        ttl=64,
        securedPath=False  # UI Option 'Security Rules'; True == 'Drop'; False == 'Continue'
    )

    with open(path.join('path_lookup', '5_1_unicast_icmp.png'), 'wb') as f:
        f.write(ipf.diagram.png(unicast_icmp))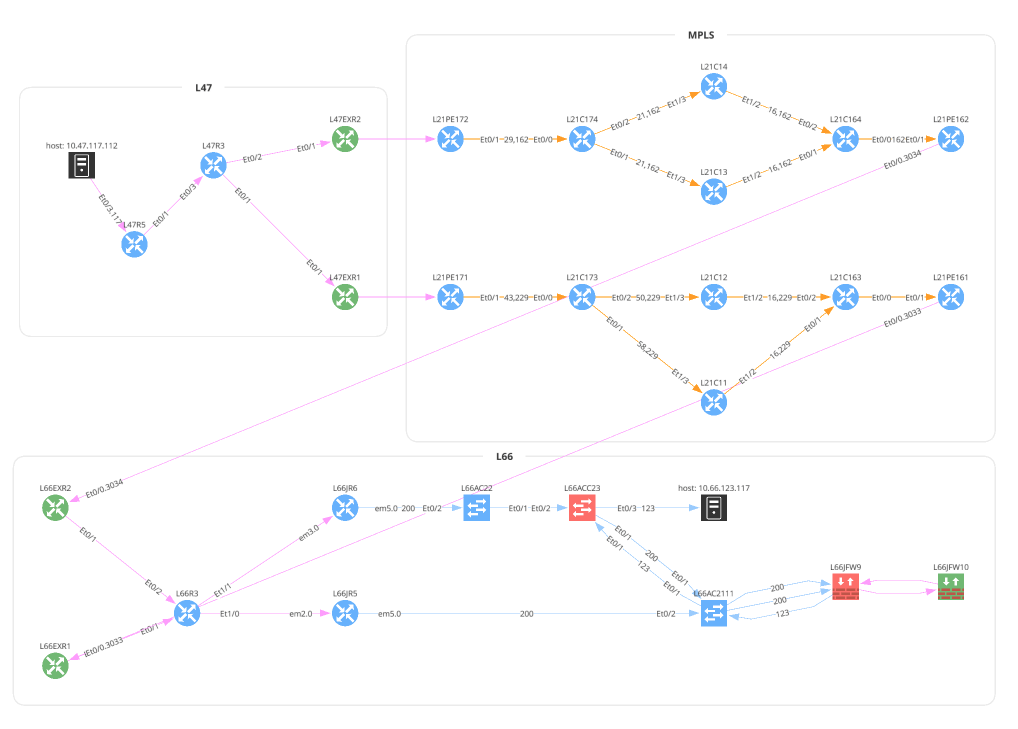
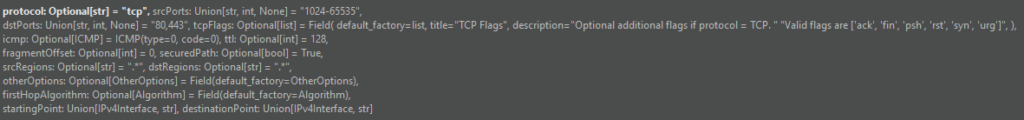
TCP and UDP accept srcPorts and dstPorts which can be a single port number, a comma-separated list, a range of ports separated by a -, or any combination of them. The applications, srcRegions, and dstRegions arguments are used for Zone Firewall rule checks and these default to any (.*).
# 5_unicast_path_lookup.py
from os import path

from ipfabric import IPFClient
from ipfabric.diagrams import Unicast, OtherOptions

if __name__ == '__main__':
    ipf = IPFClient()  # IPFClient(base_url='https://demo3.ipfabric.io/', auth='token', verify=False, timeout=15)

    unicast_tcp = Unicast(
        startingPoint='10.47.117.112',
        destinationPoint='10.66.123.117',
        protocol='tcp',
        srcPorts='1024,2048-4096',
        dstPorts='80,443',
        otherOptions=OtherOptions(applications='(web|http|https)', tracked=False),
        srcRegions='US',
        dstRegions='CZ',
        ttl=64,
        securedPath=False
    )

    with open(path.join('path_lookup', '5_2_unicast_tcp.png'), 'wb') as f:
        f.write(ipf.diagram.png(unicast_tcp))

    with open(path.join('path_lookup', '5_3_unicast_tcp_swap_src_dst.png'), 'wb') as f:
        f.write(ipf.diagram.png(unicast_tcp, unicast_swap_src_dst=True))

    # Subnet Example
    unicast_subnet = Unicast(
        startingPoint='10.38.115.0/24',
        destinationPoint='10.66.126.0/24',
        protocol='tcp',
        srcPorts='1025',
        dstPorts='22',
        securedPath=False
    )

    with open(path.join('path_lookup', '5_4_unicast_subnet.png'), 'wb') as f:
        f.write(ipf.diagram.png(unicast_subnet))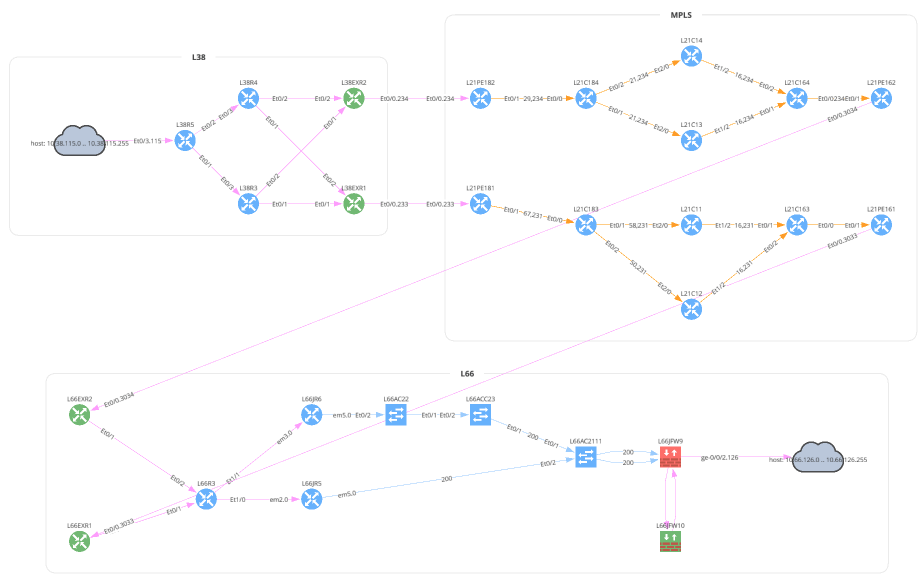
This is a new graphing feature in version 4.3 and above that allows you to specify a device and interface a packet enters your network. Perhaps you have a firewall rule to allow a certain IP address or subnet and want to verify that this is functioning correctly. The sn value is the IP Fabric unique serial number, iface is the intName or Interface column (not to be confused with Original Name), and the hostname is also required. The easiest way to collect this information is from the Inventory > Interfaces table. The sn is not a visible column in the UI, but is available from the API.
# Example pulling Interface Inventory table
from ipfabric import IPFClient
ipf = IPFClient(base_url='https://demo3.ipfabric.io/', token='token', verify=False)
interfaces = ipf.inventory.interfaces.all(columns=['sn', 'hostname', 'intName'])
# 5_unicast_path_lookup.py
from os import path
from ipfabric import IPFClient
from ipfabric.diagrams import Unicast, Algorithm, EntryPoint
if __name__ == '__main__':
ipf = IPFClient() # IPFClient(base_url='https://demo3.ipfabric.io/', auth='token', verify=False, timeout=15)
# User Defined Entry Point Example
unicast_entry_point = Unicast(
startingPoint='1.0.0.1',
destinationPoint='10.66.126.0/24',
protocol='tcp',
srcPorts='1025',
dstPorts='22',
securedPath=True,
firstHopAlgorithm=Algorithm(entryPoints=[
EntryPoint(sn='test', iface='eth0', hostname='test'),
dict(sn='test', iface='eth0', hostname='test') # You can also use a dictionary
])
)Multicast is very similar to Unicast except some of the parameter names have changed. You can also specify a receiver IP address but this is optional.
# 7_multicast.py
from os import path

from ipfabric import IPFClient
from ipfabric.diagrams import Multicast

if __name__ == '__main__':
    ipf = IPFClient()  # IPFClient(base_url='https://demo3.ipfabric.io/', auth='token', verify=False, timeout=15)

    multicast = Multicast(
        source='10.33.230.2',
        group='233.1.1.1',
        receiver='10.33.244.200',
        protocol='tcp',
        srcPorts='1024,2048-4096',
        dstPorts='80,443',
    )

    with open(path.join('path_lookup', '7_multicast.png'), 'wb') as f:
        f.write(ipf.diagram.png(multicast))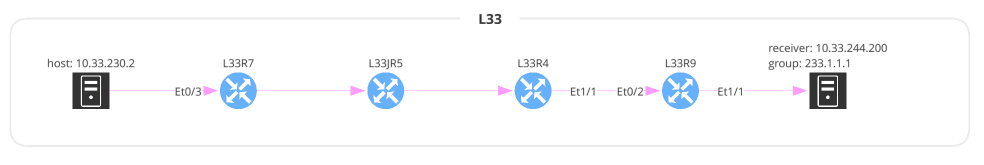
One of the great advantages of using this package is returning a Python object instead of returning the raw JSON. This allows a user to more easily understand the complex textual data returned by IP Fabric that represents how the edges (links) connect to the nodes (devices, clouds, etc.) and the decisions a packet may take. You can accomplish this via the JSON output but returning an object provides type hints along with the ability to export the model as a JSON schema. Please note that the model is not the exact same as the JSON output and some structure has been changed for ease of use. It also dynamically links some internal objects to eliminate the need to do extra lookups and references.
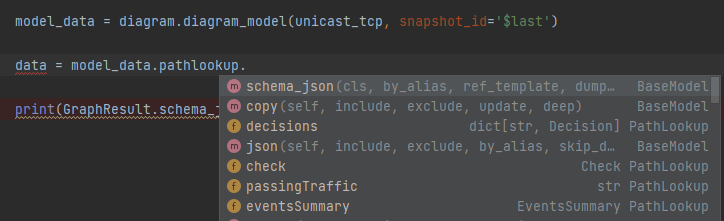
# 6_json_vs_model.py
from ipfabric.diagrams.output_models.graph_result import GraphResult

if __name__ == '__main__':
    print(GraphResult.model_json_schema())
"""
{
  "title": "GraphResult",
  "type": "object",
  "properties": {
    "nodes": {
      "title": "Nodes",
      "type": "object",
      "additionalProperties": {
        "$ref": "#/definitions/Node"
      }
    },
    "edges": {
      "title": "Edges",
      "type": "object",
      "additionalProperties": {
        "anyOf": [
          {
            "$ref": "#/definitions/NetworkEdge"
          },
          {
            "$ref": "#/definitions/PathLookupEdge"
          }
        ]
      }
    },
...
"""The ability to create diagrams using the API allows for greater automation and integration into other applications. Many of our customers use this feature to create chatbots to speed up troubleshooting, as shown below. This example is from the Network to Code nautobot-plugin-chatops[ipfabric] plugin.
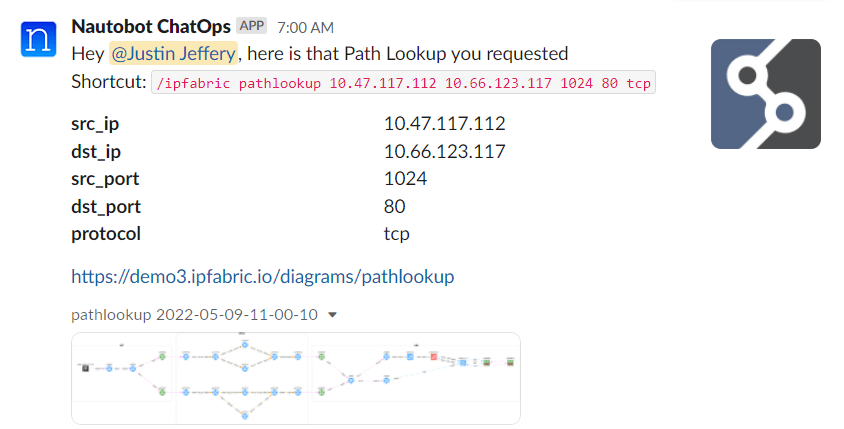
Another useful feature is performing a Path Lookup and parsing the JSON output to ensure traffic is flowing apart of a review process. We have partnered with Itential to demonstrate how using their low-code automation platform can automate ServiceNow requests and ensure that a newly deployed IP has access to correct network services during a Change Control review. Keep an eye out for a video of this exciting demonstration!
If you have any questions, comments, or bug requests please send an email to [email protected] or open an issue request on the GitLab repository.
In API Programmability - Part 2 we showed you the basics of how to use IP Fabric’s Python SDK. In this post, we will create a web server using FastAPI to receive webhooks from IP Fabric. After certain events occur, we will use python-ipfabric to extract and manipulate data to enhance your automation efforts.
Find today's code example on GitLab at 2022-05-06-api-programmability-part-3-webhooks.
Today we will be importing IP Fabric data into a PostgreSQL database after a Snapshot Discovery is completed. This is beneficial for visualizing trending analysis of important information such as the number of devices, End of Life migrations, or Intent Verifications. Due to the IP Fabric limit of five loaded snapshots, it is very difficult to see last week's KPI's or 6 months ago. Long historical analysis can be accomplished by extracting a subset of the data using the API, transforming it into a Python data model, and loading it into a PostgreSQL database. Connecting this database to a visualization tool like Grafana or Tableau will allow your teams to create interactive dashboards.
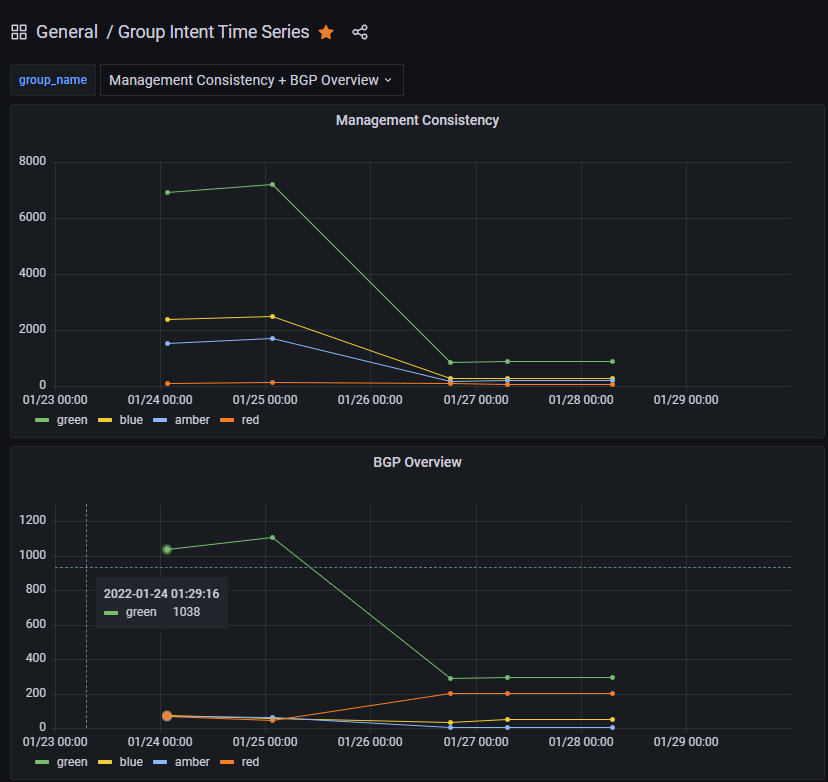
This example takes all the Intent Rules in an Intent Group and adds severities together to summarize the entire group.
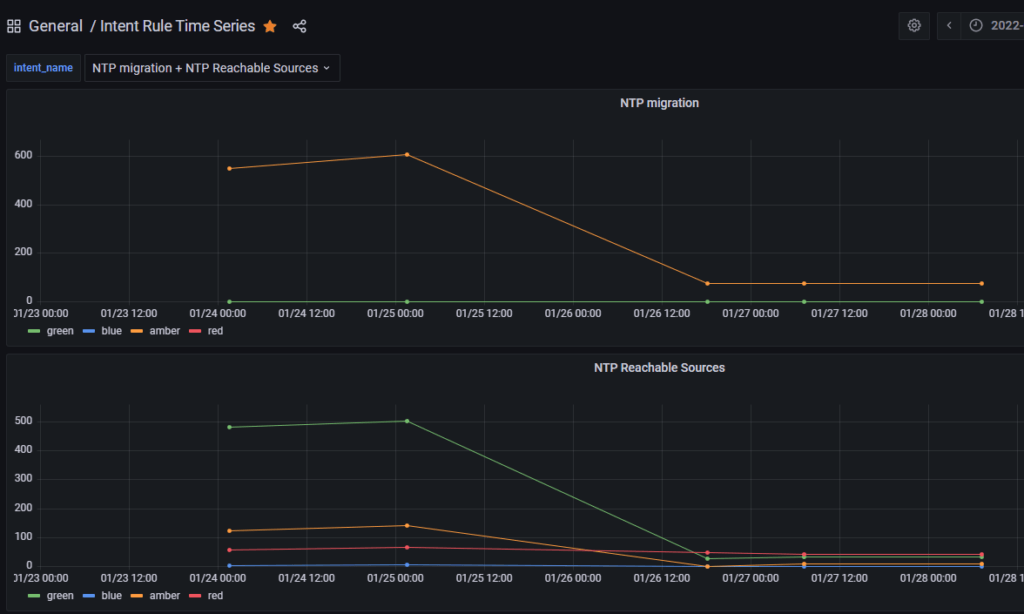
It is also possible to graph the individual intent rules for further analysis.
Here are some basic requirements for working on this project. Please note that this is a base example for developmental purposes and extra caution should be taken into account prior to running this project in a production environment (enabling HTTPS, healthchecks, etc).
python3 -m pip install -U pip poetryThis project is using Poetry to manage python dependencies and allow you to merge multiple examples together. Today we will be focusing on the postgres example which will take the snapshot data and insert inventory and intent data into a PostgeSQL database for long-term historical trending. This will require access to either a local or remote PostgreSQL database as well as other requirements listed above.
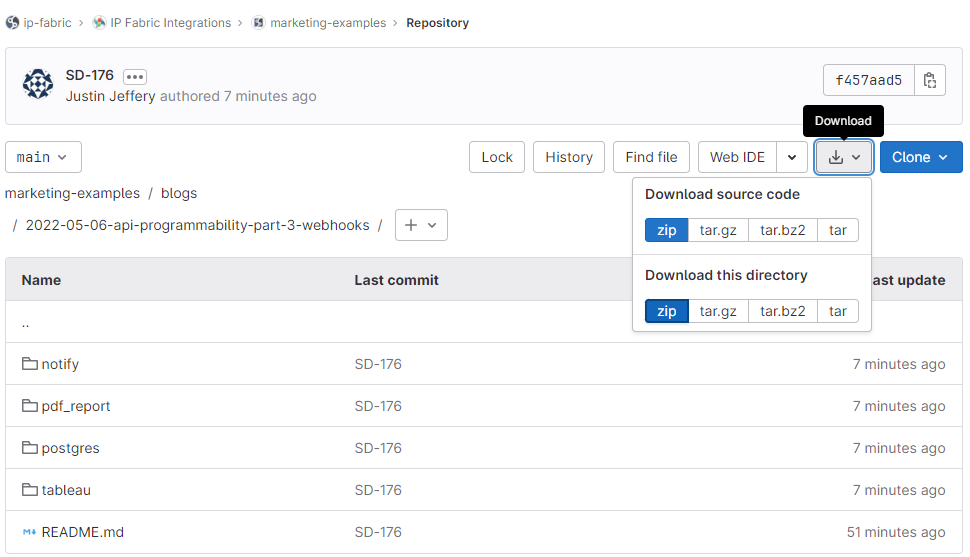
The easiest way to download the project is to use git for cloning.
SSH: git clone [email protected]:ip-fabric/integrations/marketing-examples.git
HTTPS: git clone https://gitlab.com/ip-fabric/integrations/marketing-examples.git
Another option would be going to GitLab and downloading the zip file.
Installing the Python-specific requirements for this project is a simple command poetry install in the directory with the pyproject.toml file. Please take a look at the example specific README files for other dependencies outside Python (i.e. a PostgreSQL database).
To create a new Webhook navigate to Settings > Webhooks in IP Fabric and select Add Webhook:
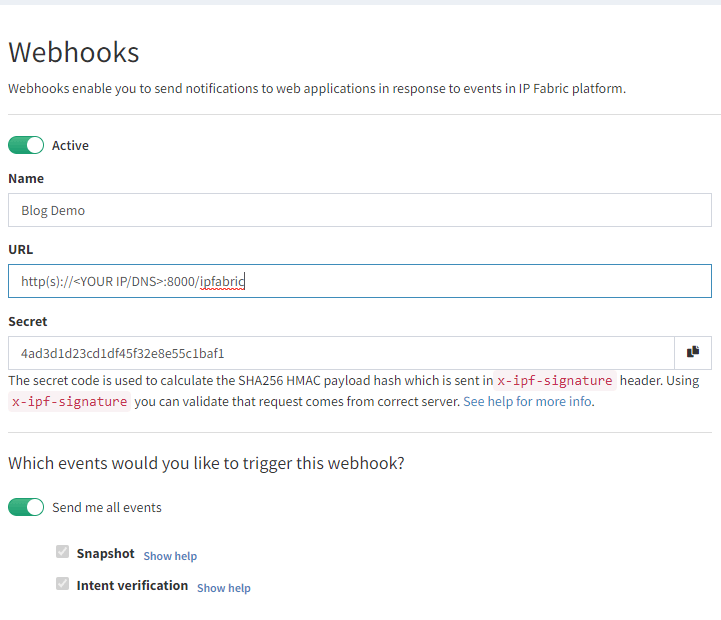
Here you will create a name, your URL, and select the events to listen for. The postgres example requires both Snapshot and Intent verification to load all the required data. Prior to saving please copy the Secret key as this will be used in the configuration. If you forget this step it can be viewed after saving, unlike API tokens.
In your project copy sample.env file to .env and enter your environment's specific data.
IPF_SECRET is the secret key copied above; this validates that the message came from your IP Fabric instance and not another server.IPF_URL must be in this format https://demo3.ipfabric.io/IPF_TOKEN is created in Settings > API TokenIPF_VERIFY to false if your IP Fabric certificate is not trusted.IPF_TEST to true for initial testing and then change to false.The webhook listener can be run through Poetry or Docker. This will require communicating to the PostgreSQL database prior to starting the webserver to ensure that the schema is installed and the tables are set up.
poetry run apidocker-compose upC:\Code\part-3-webhooks\postgres>poetry run api
INFO: Started server process [12740]
INFO: Waiting for application startup.
INFO: Application startup complete.
INFO: Uvicorn running on http://0.0.0.0:8000 (Press CTRL+C to quit)
This output provides us the information which we can put in the Webhook's Settings URL. The 0.0.0.0 signifies it is listening on all IP addresses of your system (run ipconfig or ip addr to get the correct IP to replace it). This is also configured to run on port 8000 so the URL which I will need to edit in IP Fabric will look like http://192.168.1.100:8000/ipfabric.
When the IPF_TEST variable is set to true the server will process a test message as a normal webhook and verify it is working. Select the lightning bolt icon in the Webhooks settings and then choose which rule to send.
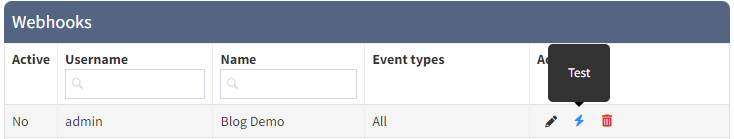
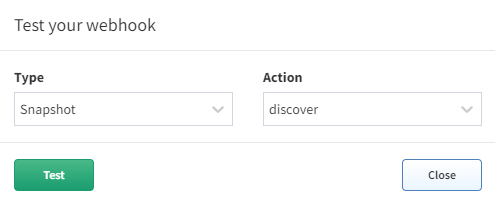
The postgres example will use the $last snapshot to perform the automation against when a test webhook event is sent (make sure to test both Snapshot - discover and Intent verification - calculate to load all the data for that snapshot). When a test webhook runs it creates a random snapshot ID that does not conflict with others in the system.
Once the test is successful it is advisable to set IPF_TEST back to false and restart the server. If you try to run the test again it will fail because the unique snapshot_id has already been inserted into the database to prevent duplicate entries.
This branch will also only process snapshot events that have been run through the scheduler (user:cron). If a user manually creates a new snapshot or updates an existing one, then the webhook messages will be processed and ignored.
Using IP Fabric Webhooks will further your team on their Network Automation journey and provide the ability to integrate into any external system you can imagine. Today we focused on importing the data into an external database, but this can be extended to import into a Configuration Management Database (CMDB), Network Management System (NMS), or Monitoring Tools to ensure that these critical infrastructure components have full visibility of your network.
If you have found this article helpful, please follow our company’s LinkedIn or check out our other blog posts. If you would like to test our solution to see for yourself how IP Fabric can help you manage your network more effectively, please contact us through www.ipfabric.io.
The Grafana JSON models are located in the Grafana directory on GitHub. You will need to configure your Grafana instance to connect to your PostgreSQL database and find the generated UID for that connection. Then in the JSON files replace all instances of <REPLACE WITH UID OF YOUR CONNECTED POSTGRES DB> with the correct value. Finally, you should be able to import the new dashboards.
If you are interested in extracting more data than the example provides (perhaps the BGP Summary table) this can be accomplished by adding on to the existing Python code. If you need assistance with this or have an idea for a new integration please open a GitLab issue.
In API Programmability - Part 1 we showed you the basics of how to use IP Fabric’s API. If you have not read the blog, please take a few minutes to look at it to understand how to create a token and familiarize yourself with it. In this post we are going to use the ipfabric Python package located on pypi.org. The code we will be discussing using in this blog is located on GitLab at 2022-01-03-api-programmability-python.
Before we begin here are some of the basics you will need to follow along:
class IPFClient(httpxClient):
    def __init__(
            self,
            base_url: Optional[str] = None,
            token: Optional[str] = None,
            snapshot_id: str = "$last",
            *vargs,
            **kwargs
    ):
        """
        Initializes the IP Fabric Client
        :param base_url: str: IP Fabric instance provided in 'base_url' parameter, or the 'IPF_URL' environment variable
        :param token: str: API token or 'IPF_TOKEN' environment variable
        :param snapshot_id: str: IP Fabric snapshot ID to use by default for database actions - defaults to '$last'
        :param vargs:
        :param kwargs:
        """
        try:
            base_url = urljoin(base_url or os.environ["IPF_URL"], "api/v1/")
        except KeyError:
            raise RuntimeError(f"IP Fabric base_url not provided or IPF_URL not set")

        try:
            token = token or os.environ["IPF_TOKEN"]
        except KeyError:
            raise RuntimeError(f"IP Fabric token not provided or IPF_TOKEN not set")

        super().__init__(base_url=base_url, *vargs, **kwargs)
        self.headers.update({'Content-Type': 'application/json', 'X-API-Token': token})

        # Request IP Fabric for the OS Version, by doing that we are also ensuring the token is valid
        self.os_version = self.fetch_os_version()
        self.snapshots = self.get_snapshots()
        self.snapshot_id = snapshot_id
        self.inventory = Inventory(self)
When initializing the client it requires the base_url and token or the environment variables IPF_URL and IPF_TOKEN to be set. It will then send a request to your IP Fabric instance to get the version and all snapshots in the instance.
"""
snapshot.py
"""
from ipfabric import IPFClient
from pprint import pprint


if __name__ == '__main__':
    ipf = IPFClient('https://demo3.wordpress-625423-2416527.cloudwaysapps.com/', snapshot_id="$lastLocked")

    print(f"IP Fabric version: {ipf.os_version}")
    """
    IP Fabric version: 4.0.2
    """

    print(f"Class snapshot id is set to \t{ipf.snapshot_id}")
    print(f"Latest snapshot id is set to\t{ipf.snapshots['$last']. snapshot_id}")
    """
    Class snapshot id is set to    d3bd033e-1ba6-4b27-86f5-18824a1a495e
    Latest snapshot id is set to   c8684ea9-dfd8-400d-a4b8-ba1c4bc7c185
    """

    print("Print a snapshot object: ")
    pprint(ipf.snapshots[ipf.snapshot_id].__dict__)
    """
    Print a snapshot object:
    {'count': 640,
     'end': datetime.datetime(2021, 10, 21, 12, 37, 3, 513000),
     'snapshot_id': 'd3bd033e-1ba6-4b27-86f5-18824a1a495e',
     'loaded': True,
     'locked': True,
     'name': 'Baseline 10-21',
     'start': datetime.datetime(2021, 10, 21, 11, 59, 54, 941000)}
    """
If no snapshot is set it will default to use $last, however you can also specify $prev, $lastLocked, or an ID of a snapshot. Please remember when dealing with snapshots is that it must be loaded to view the data in inventory and technology tables. Snapshot meta data is loaded in a python object with start and end times converted into datetime objects for easier manipulation and querying.
"""
get_inventory.py
"""
from ipfabric import IPFClient
from pprint import pprint


if __name__ == '__main__':
ipf = IPFClient('https://demo3.wordpress-625423-2416527.cloudwaysapps.com/')

print([x for x in dir(ipf.inventory) if not x.startswith('_')
])
"""
['devices', 'families', 'interfaces', 'models', 'part_numbers', 'platforms', 'sites', 'vendors']
"""
Inside the IPFClient class I created an Inventory object which can be used to fetch all data in those tables. This contains data like sites, devices, and interfaces. We can easily pull that data by calling the all method on them.
sites = ipf.inventory.sites.all()
print(f"Number of sites: {len(sites)}")
print("First site:")
pprint(sites[0])
"""
Number of sites: 25
First site:
{'devicesCount': 22,
 'id': '1111118694',
 'siteKey': '1111118694',
 'siteName': 'HWLAB',
 'siteUid': 'HWL',
 ...}
"""
This removes the need for going to the webpage, finding the API endpoint to use, and the data required to post. The all method also allows filtering. It is recommended to create your filter in the GUI to ensure you are retrieving the correct data. Simply create a filter, in the example I am filtering on site L71 however you can also use advanced filter, then click the "?" Table Description button at the top right of the table.
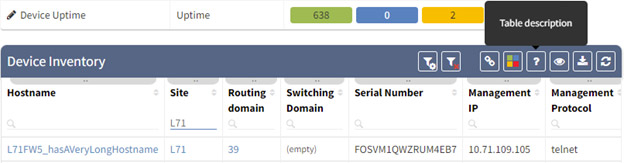
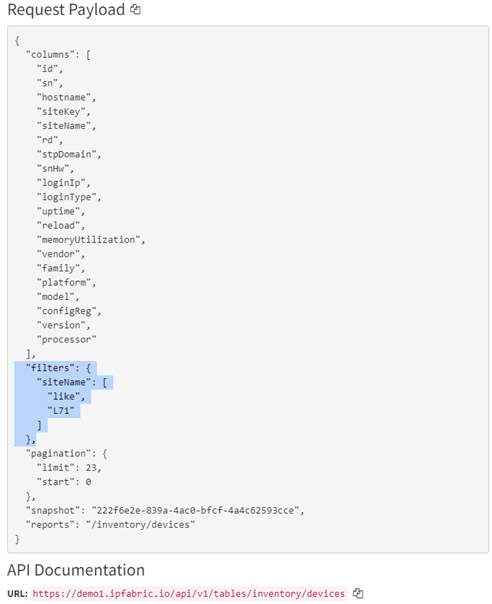
Here we find the filter information. You may copy and convert this JSON object to a Python dictionary or enclose it as a string and the client will handle the JSON conversion for you.
devices = ipf.inventory.devices.all(filters={
    "siteName": [
        "like",
        "L71"
    ]
})
"""
Also acceptable if filter is string
devices = ipf.inventory.devices.all(filters='{"siteName": ["like","L71"]}')
"""
print(f"Number of devices in site L71: {len(sites)}")
print("First Device:")
pprint(devices[0])
"""
Number of devices in site L71: 25
First Device:
{'devType': 'fw',
 'family': 'fortigate',
 'hostname': 'L71FW13-HA2/root',
 'id': '1137600732',
 ...}
 """
Finally, if you know the specific columns you would like to return instead of all columns that is also possible. If you do not specify any columns the default behavior in the client will submit a malformed request to IP Fabric which will return an error message like:
'"columns[0]" must be one of [id, devicesCount, networksCount, rDCount, rDomains, routersCount, siteKey, siteName, siteUid, stpDCount, stpDomains, switchesCount, usersCount, vlanCount]'
Using Python and the re package I have stripped out the column names from the error message and then the client is able to submit a correctly formed request with all the column names. Submitting a list of columns will increase performance as only one call to the API is performed instead of two. It will also increase the speed and decrease memory usage as it will limit the amount of data being returned.
vendors = ipf.inventory.vendors.all(columns=["vendor"])

print(f"Number of vendors: {len(vendors)}")
[print(vendor["vendor"]) for vendor in vendors]
"""
Number of vendors: 14
arista
aws
checkpoint
cisco
...
"""
In the above examples we looked at Inventory data but most other data lives in the technology tables. It would also be possible to create a class like inventory which defines each table and their endpoints. However, in the below examples I wanted to show different methods with interacting with the base client.
"""
get_technology.py
"""
from ipfabric import IPFClient
from pprint import pprint


if __name__ == '__main__':
    ipf = IPFClient('https://demo3.wordpress-625423-2416527.cloudwaysapps.com/')

    wc = ipf.fetch_all('tables/wireless/controllers')
    """
    Also acceptable:
    wc = ipf.fetch_all('https://demo3.wordpress-625423-2416527.cloudwaysapps.com/api/v1/tables/wireless/controllers')
    wc = ipf.fetch_all('/api/v1/tables/wireless/controllers')
    """
    print(f"Wireless Controllers Count: {len(wc)}")
    pprint(wc[0])
    """
    Wireless Controllers Count: 3
    {'apCount': 0,
     'clientCount': 0,
     'controller': 'HWLAB-WLC-C4400',
    ...}
    """
The fetch_all method is similar to the all method and takes the same arguments but it requires the API endpoint to submit to. The above example fetches all the Wireless Controllers. This will handle all the paging requests for you, if you prefer to implement paging within your own script then the fetch method is also available:
arp = ipf.fetch('tables/addressing/arp', limit=1, start=0, snapshot_id='$prev')

pprint(arp)
"""
[{'hostname': 'HWLAB-CKP-E-1',
  'id': '11490504891149050698',
  'intName': 'LAN1',
  'ip': '10.64.128.1',
  ...}]
"""
Finally, a query method is also available for use. This takes either a string of JSON data or Python dictionary, this is especially useful for copying and pasting the API documentation directly from the browser. It will default to use the pager method to retrieve all results and ignore the pagination fields in the payload, this can be changed by setting all=False. Here are a few examples:
data = {
    "columns": [
        "id",
        "sn",
        "hostname",
        "siteKey",
        "siteName",
        "totalVlanCount",
        "activeVlanCount"
    ],
    "filters": {},
    "pagination": {
        "limit": 32,
        "start": 0
    },
    "snapshot": "d3bd033e-1ba6-4b27-86f5-18824a1a495e",
    "reports": "/technology/vlans/device-summary"
}
vlans = ipf.query('tables/vlan/device-summary', data)
print(f"Count of VLANS {len(vlans)}")
pprint(vlans[0])
"""
Count of VLANS 276
{'activeVlanCount': 11,
 'hostname': 'L34AC11',
 'id': '1119052963',
 'siteKey': '885963458',
 'siteName': 'L34',
 'sn': 'a22ff89',
 'totalVlanCount': 15}
"""
print()

with open('ospf.json', 'r') as f:
    ospf = ipf.query('tables/networks/routes', f.read(), all=False)
print(f"Count of routes {len(ospf)}")
pprint(ospf[0])
"""
Count of routes 33
{'hostname': 'L1R16',
 'id': '1118750250',
 'network': '10.71.0.0/16',
 'nexthop': [{'ad': 150,
              'age': 773086,
              'intName': 'ge-0/0/2.0',
              ...}],
 'nhCount': 1,
 ...}
"""
Retrieving all data including technology tables is now simplified without requiring the need to know the column names of the tables. In a production environment it is encouraged to use column names to increase performance and decrease the amount of data being returned.
I hope you enjoyed this blog post and be on the lookout for Part 3: Webhooks.
One of the most difficult parts in a Network Automation journey is collecting the data you need. Many developers spend hours creating parsers to make data that is returned from devices usable. After creating a parser to extract data from one vendor’s device it must be adjusted for syntax on other vendors, platforms, or even differences in software versions. IP Fabric extracts your important network data directly from the devices and places it in our vendor neutral data models which removes this parsing burden from your development teams. All this information is searchable in our platform without the need for memorizing numerous different commands.
Did you know that all this parsed data in IP Fabric is also easily accessible via the API? Today I will be sharing some basic Python code examples that will help you get started with your automation journey. We will be using the Python requests module so you can easily translate these into other languages. In future blog posts we will focus on the Python ipfabric package.
Before we begin here are some of the basics you will need to follow along:
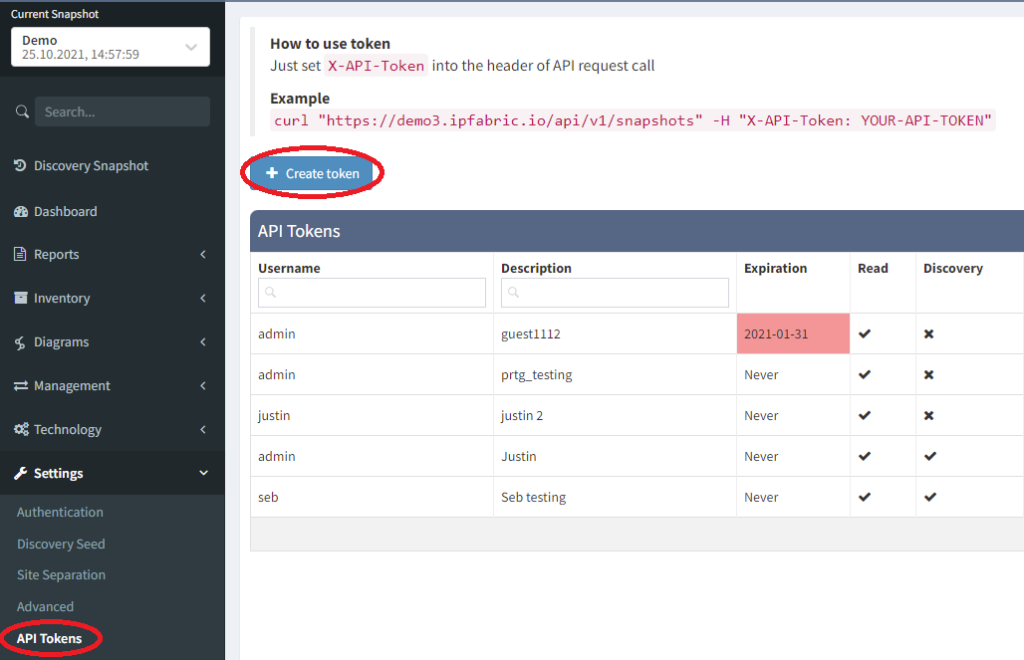
First head into your IP Fabric’s GUI and select Settings > API Tokens. This will display all current tokens and allow us to create a new one.
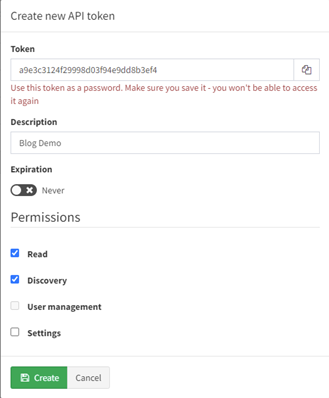
After clicking “Create Token” you will be prompted for some information. It is important to copy the generated token prior to selecting create, once created it cannot be displayed again. Descriptions are helpful and recommend, although not required, for managing your tokens. You can specify a date that it will expire and the permissions it has. For most of these blog posts we will only require Read and Discovery.
After installing python, we will be using only the requests package for our examples as it is the most widely used and a great starting point for our project. There are many different open-source packages that provide the same functionality as requests like httpx and urllib3, so feel free to do some research and select the best one for your project. To install requests run:
`pip3 install requests`
import requests

session = requests.Session()
session.headers.update({'Content-Type': 'application/json', 'X-API-Token': 'TOKEN'})

payload = {
    "columns": [
        "id",
        "siteName",
        "siteKey",
        "devicesCount",
        "usersCount",
        "stpDCount",
        "switchesCount",
        "vlanCount",
        "rDCount",
        "routersCount",
        "networksCount"
    ],
    "snapshot": "$last"
}
r = session.post('https://demo3.wordpress-625423-2416527.cloudwaysapps.com/api/v1/tables/inventory/sites', json=payload)
print(r.json()['data'][0])


"""
{'id': '1111118694', 'siteName': 'HWLAB', 'siteKey': '1111118694', 'devicesCount': 22, 'usersCount': 13, 'stpDCount': 2, 'switchesCount': 8, 'vlanCount': 131, 'rDCount': 3, 'routersCount': 6, 'networksCount': 61}
"""
In the above example we are querying the “sites” table which will return a JSON response which we can parse, post-process, or even send to other systems. First, we create a request session object and add the required Content-Type and X-API-Token headers. The technology tables all use the method POST and require JSON data to be submitted to return a response. How do we find this information? It is actually very simple so let’s take a look!
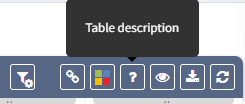
In every table you will find a “?” for the Table Description. Clicking this button will bring up the API documentation for you.
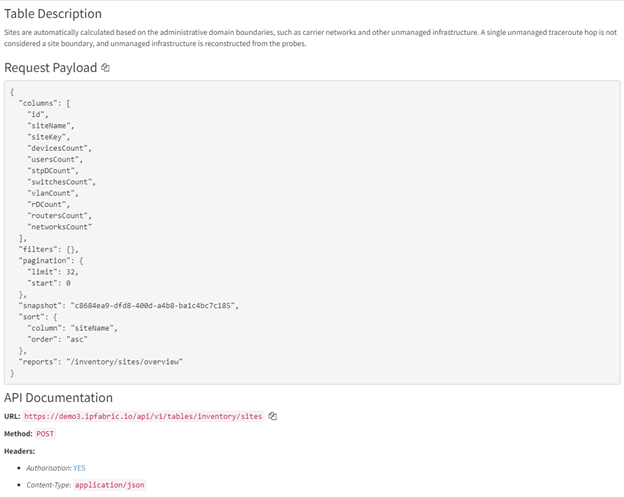
This is where we can find the payload to post, the URL, and documentation on all the attributes. Currently in most technology tables only columns and snapshot fields are required, all other fields are optional. Snapshot can be one of the following:
Filters can also be applied to reduce the amount of data. In the below example I created a table filter to only show Cisco devices that are matching the Red Device Uptime verification rule.
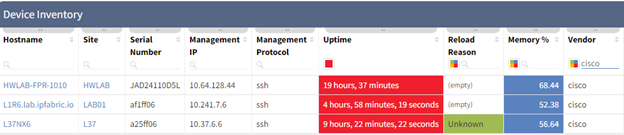
Creating the JSON filter for this is quite easy. Once our filter is applied simply click the Table Description (“?”) icon again. This will update the request payload with the correct syntax (see below). This is a great way for you to learn the API and after some practice you will be able to filter without going to the webpage. This method also works on advance filters you can create on tables as well.
1.	"filters": {
2.	    "vendor": [
3.	        "like",
4.	        "cisco"
5.	    ],
6.	    "uptime": [
7.	        "color",
8.	        "eq",
9.	        "30"
10.	    ]
11. }One final note is on pagination. Our IP Fabric demo environment with only about 600 devices contains almost 6,000 interfaces. In a large production environment with hundreds of thousands of rows this can create slow responses or even return server errors if requesting everything at once. Therefore, it is important to chunk your requests into smaller manageable pieces. For this example, I have written an IPFabric class you can import into your code which will handle all the pagination for you (code has been condensed, please see the GitHub link at the end for fully documented code).
from typing import Optional, Union

from requests import Session
from urllib.parse import urljoin


class IPFabric(Session):
    def __init__(self, base_url: str, token: str, verify: bool = True, api_version: str = "v1", limit: int = 10000):
        super(IPFabric, self).__init__()
        self.base_url = urljoin(urljoin(base_url, "api/"), api_version + '/')
        self.headers.update({'Content-Type': 'application/json', 'X-API-Token': token})
        self.verify = verify
        self.limit = limit

    def query(self, endpoint: str, payload: dict):
        return self._ipf_pager(urljoin(self.base_url, endpoint), payload)

    def _ipf_pager(
            self,
            url: str,
            payload: dict,
            data: Optional[Union[list, None]] = None,
            start: int = 0
    ):
        data = list() if not data else data

        payload["pagination"] = dict(
            limit=self.limit,
            start=start
        )
        r = self.post(url, json=payload)
        r.raise_for_status()
        r = r.json()
        data.extend(r['data'])
        if self.limit + start < r["_meta"]["count"]:
            self._ipf_pager(url, payload, data, start+self.limit)
        return data
Our demonstration below will import the above class, the pager function will query the API until all rows are received, and then return a list of dictionaries which we can further process.
from ipfabric import IPFabric
from os import getenv
from pprint import pprint


if __name__ == '__main__':
    ipf = IPFabric('https://demo3.wordpress-625423-2416527.cloudwaysapps.com/', getenv('IPF_TOKEN'))

    payload = {
        "columns": [
            "sn",
            "hostname",
            "intName",
            "siteName",
            "l1",
            "l2",
            "dscr",
            "mac",
            "duplex",
            "speed",
            "errDisabled",
            "mtu",
            "primaryIp",
        ],
        "snapshot": "$last"
    }
    interfaces = ipf.query('tables/inventory/interfaces', payload)

    pprint(interfaces[0])

"""
{'dscr': None,
 'duplex': None,
 'errDisabled': None,
 'hostname': 'L62SD24',
 'intName': 'Vl1',
 'l1': 'down',
 'l2': 'down',
 'mac': 'aabb.cc82.ff00',
 'mtu': 1500,
 'primaryIp': None,
 'siteName': 'L62',
 'sn': 'a3effa6',
 'speed': None}
"""Deploying IP Fabric in your environment and using the API can greatly speed up your network automation goals. With support for many different vendors and platforms we remove the need for your development teams creating complex parsers and code to communicate to network devices. On day 1 of your deployment, you can jump right to the data post processing and begin using this information in reporting, auditing, or sending to other systems.
Read part 2 of this series here: API Programmability Part 2 - Python.
Today we have some great news for Nornir users - a plugin for IP Fabric has just been released, allowing use of IP Fabric network inventory for Nornir automation! And as we understand that seeing is believing, we have prepared a free 1 month trial for up to 20 devices. Test it directly in your network! All you need it to click the button below.
As any networking engineer who has started his/her automation journey will have realised, one of the first elements required for a successful automation project is a complete and updated inventory. It is necessary to ensure that network changes are applied to the correct network devices, and to do the checks to ensure that those changes have had the desired effect.
Other more advanced automation concepts are irrelevant without being certain that the information they operate on is complete. These ideas, such as idempotency and "network as code", will make good topics for posts in the future!
Thanks to its full REST API, IP Fabric can supply deep, rich data to other software tools in your network management ecosystem. In particular, customers and partners are using the platform to provide inventory data for their automation tooling.
Nornir is a well known, high-performance network automation framework written for the Python programming language. As with any other automation tool, one of the key components of Nornir is inventory: indeed, according to the documentation it is “the most important piece of Nornir”.
How can we leverage our favourite network discovery and assurance tool (IP Fabric of course!) to improve an automation project in Nornir?
The obvious answer is to use IP Fabric as its inventory: it has the discovered list of network devices and a great deal of information about every device in the network, that can be used to filter the inventory and thus apply configuration changes only where necessary.
Today, we are happy to announce the launch of the IP Fabric inventory plugin for Nornir. Developed by a member of the partner community, the plugin reads the IP Fabric inventory and exposes the device information to Nornir, to be consumed in the automation workflow created by the customer.
Nornir is currently due a major code release, so as yet the IP Fabric plugin is not yet published in pip. Once the new version of Nornir is available and steady, the intention is to build a more integrated install process.
In the meantime, assuming you have Python and Nornir installed on your workstation, to install the plugin:
Then simply launch Python and import the information from IP Fabric! You'll find some demo scripts in the repo with the plugin itself - check the readme for more information.
from nornir import InitNornir
nr = InitNornir(
    core={"num_workers": 10},
    inventory={
        "plugin":"nornir.plugins.inventory.ipfabric.IPFInventory",
        "options": {
            "ssl_verify": False,
            "ipf_url":"https://url",
            "ipf_user":"username",
            "ipf_password":"password",
        }
    },
    logging={"enabled": False}
)
To verify that all devices are imported:
len(nr.inventory.hosts)That’s it! We can now use all the familiar Nornir functions for inventory filtering and to launch the automation tasks.
In the next post, we’ll work on some examples of using the IP Fabric Nornir plugin to verify device configurations and fix any drift from the desired values, getting all the necessary information from IP Fabric via API. And stay tuned for some video walkthroughs.
We're excited about introducing this new capability as an example of how the partner and customer community can extend the capability of our product. There are other integrations and developments in the pipeline - if you are registered with the networktocode Slack, join the #ipfabric channel to join in the discussion, or subscribe to our subreddit r/ipfabric to ask more detailed questions.
Feeling inspired? Test IP Fabric in your lab environment today with our trial lab license. All you need to click the button below and fill in the form.
If you're interested in a full PoC of the platform, get in touch!
The Cisco Meraki is a unique network equipment vendor that decided to move all management related functions to the cloud. It may sound not completely secure or unusual to some, but in 2020 the market seems ready for that.
With Cisco Meraki, you can build pretty much any type of standard network infrastructure including wireless Access Points, switches, routers, or firewalls. Some might say that moving the management of any network behind the perimeter is insecure. But on the other hand, we live in times where whole data centers are moving to the cloud and no one is protesting against that.
The Meraki is a complete shift from the command-line interface (CLI) to the Dashboard in the cloud. The network administrator managing the Cisco Meraki infrastructure is supposed to interact only with the Meraki Dashboard, nothing else. So how can we pull the network inventory?
Well, one way or another would be to go to the Dashboard and export the data manually. But that doesn't scale. The Cisco Meraki offers its application programming interface (API). The current version is Version0 and it offers enough information already to collect at least the basic data.
The discovery of Cisco Meraki equipment is available in IP Fabric starting with version 3.5.0. That is to say, IP Fabric uses API to connect to the Meraki Dashboard and collect data.
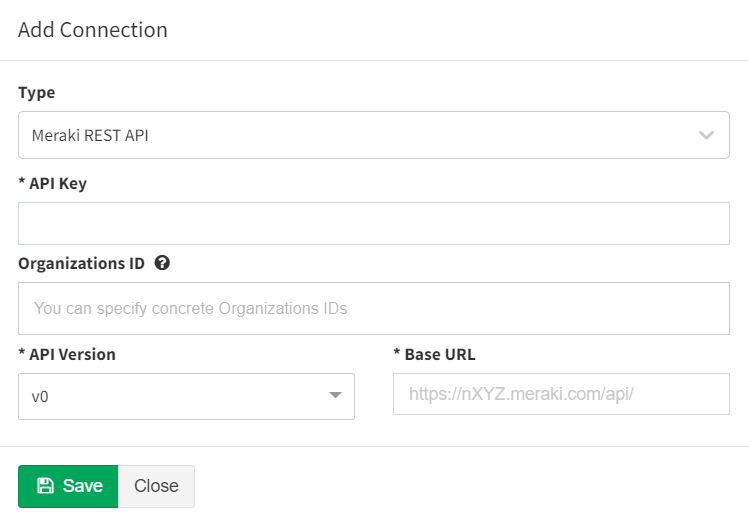
If you already have your API URL and key, you can add it to IPF under “Settings – Advanced – Vendors API”. Further, you can limit the scope of discovery by setting your organization IDs. This makes the discovery process faster.
But you can even use the generic API URL https://api.meraki.com/api/ without any organization filter to discover as much as possible.
The equipment discovery starts as any other discovery for legacy equipment, apart from using API instead of SSH or Telnet.
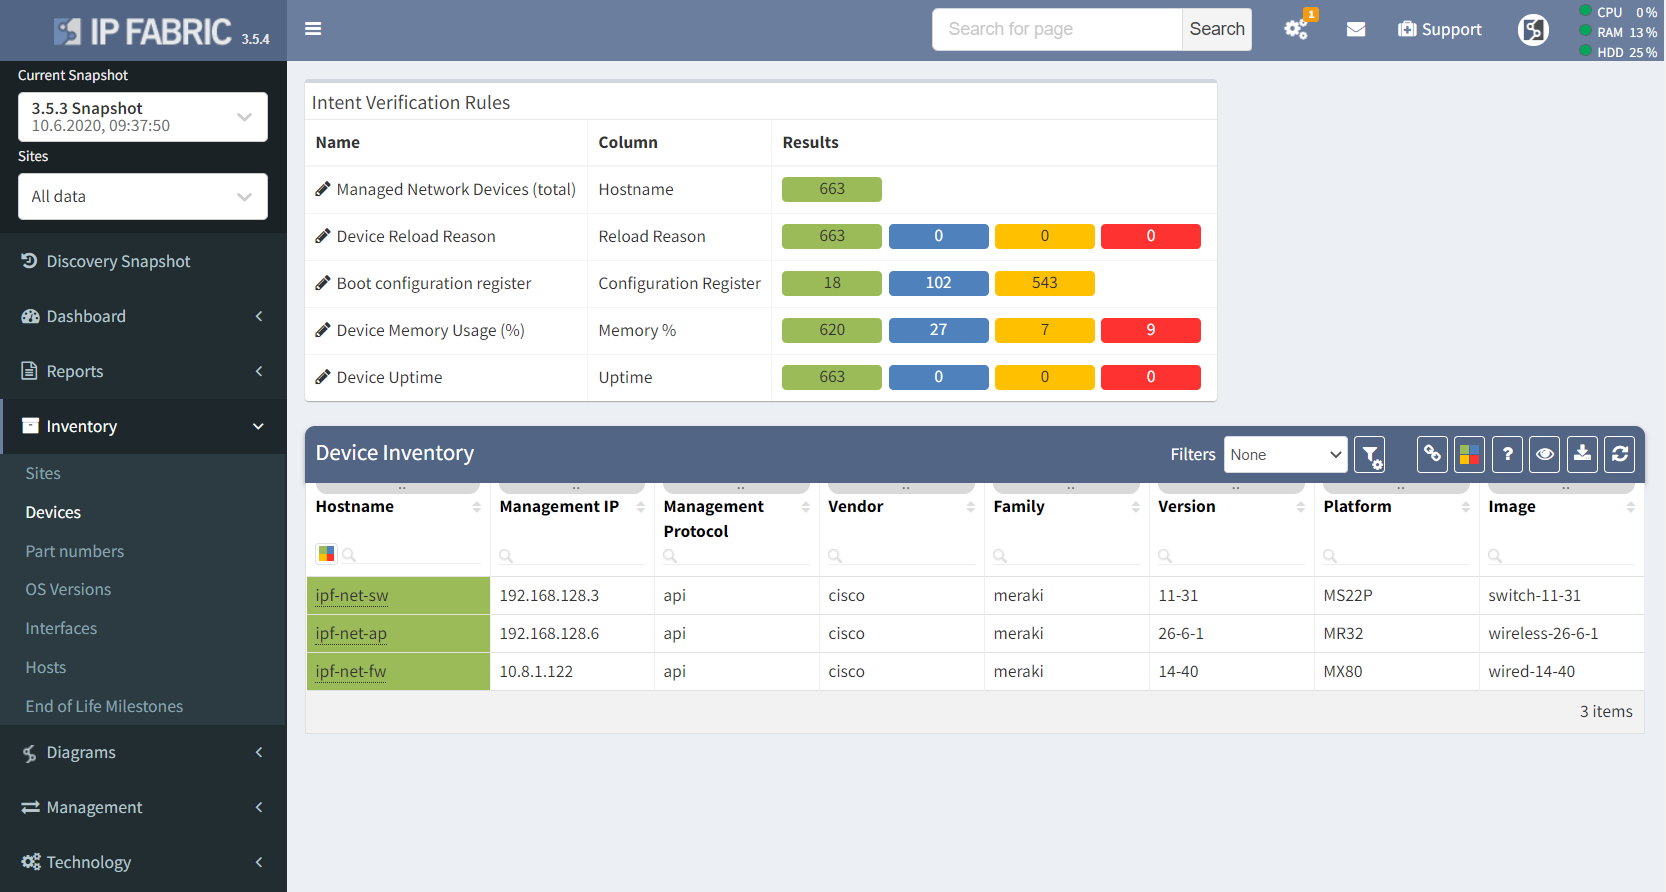
IP Fabric is more than just a basic inventory. Apart from the obvious, it provides very detailed information for many of supported technologies. The Meraki technology discovery is limited by the Dashboard's API capabilities.
If you have found this article helpful, please follow our company’s LinkedIn or Blog, where more content will be emerging. If you would like to test our solution to see for yourself how IP Fabric can help you manage your network more effectively, please contact us through www.ipfabric.io.
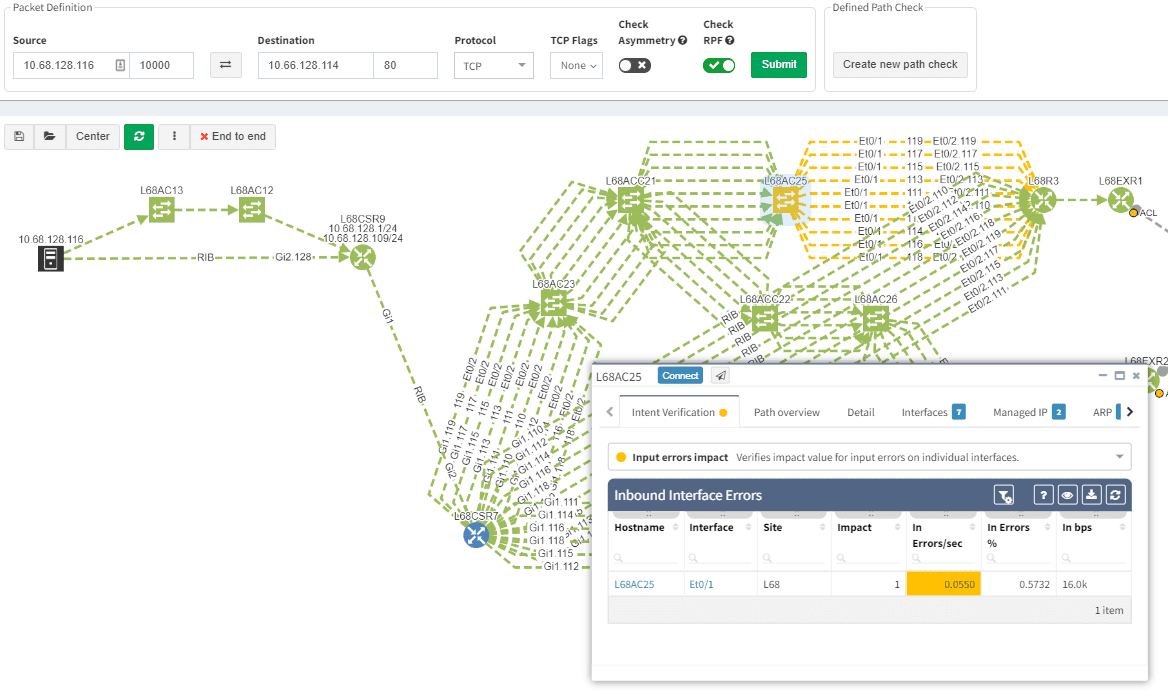
The ability to perform end to end path simulation quickly across complex network environments means fast response to any issues or current design process requirements. The main reason that computer networks are built is to enable communication between two or more endpoints and the whole ecosystem is created for sharing information as efficiently as possible.
The IP Fabric platform is a unique tool that is capable of extremely fast end to end path simulation only by presenting the source IP (and VRF) and destination IP with port and protocol. Any application path can be technically verified from an operational perspective within seconds and without any extensive command-line knowledge just with read-only access to the platform.
In companies and organizations using IP Fabric, an End-to-End path simulation is often a go-to tool for technical teams that tend to use the network in any way. It can be a server, application, or helpdesk team.
Our previous articles are covering authentication and changing the settings via API. I strongly recommend reading them prior to testing the End to End over API. It will help with a basic understanding of workflows related to IP Fabric's API.
Now it's a good time to discover the endpoint with all its parameters.
# API Endpoint:
apiEndpoint = 'https://ipfServerUrl/api/v1/graph/end-to-end-path'

# API Parameters:
e2eParams = {
     'e2eEndpoint' :  apiEndpoint,
     'sourceIP' : '?source=10.66.128.112',
     'destinationIP' : '&destination=10.66.255.104',
     'sourcePort' : '&sourcePort=10000',
     'destinationPort' : '&destinationPort=22',
     'asymetricOption' : '&asymmetric=false',
     'rpfOption' : '&rpf=true',
     'protocolType' : '&protocol=tcp',
     'snapshotID' : '&snapshot=696aee04-7370-47cf-bbcc-ef86d1bc5244',
 }
In the previous Python3 snippet, we prepared the e2eParams object consisting of many keys and associated values. The API endpoint is a combination of the base and additional parameters, such as source and destination IP address, destination port, protocol type, and the snapshot ID.
The snapshot ID has to be defined and can be collected with GET request from 'https://ipfServerUrl/api/v1/snapshots'
As a next step, we can build the query to which we point the GET request towards:
e2eQuery = ''
for val in e2eParams.values(): e2eQuery += val
When the endpoint string is complete, we will simply send a GET type request. As a response, we get a full and detailed E2E path with each and every hop. For that purpose we can reuse the function from previous articles related to API webinar:
def e2ePath(e2e, e2eHeaders):
    e2eGet = requests.get(e2e, headers=e2eHeaders, verify=False)
    if e2eGet.ok: print(' The E2E path simulation is ready.')
    else: print(' UNABLE to simulate E2E: ' + e2eGet.text)
    return e2eGet

path = e2ePath(e2eQuery, authHeaders)
In the response we 3 main dictionary keys provided:
>>> e = e2ePath(e2eQuerry, headers)
The E2E path simulation is ready.

>>> e.json().keys()
dict_keys(['graph', 'ad'])

>>> e.json()['ad']
['vSite/138494449']

>>> e.json()['graph'].keys()
dict_keys(['nodes', 'lookup', 'edges', 'type'])

>>> for node in e.json()['graph']['nodes']: print(node['hostname'])
L66R4
L66R3
L66JR5
L66AC2111
L66JFW9
L66JFW10
L66ACC23
10.66.128.112  <<< HOST
In the Python3 console outputs above we requested the path from IP Fabric. Then we quickly observed available keys, and as a last step printed list of network devices that the path is using.
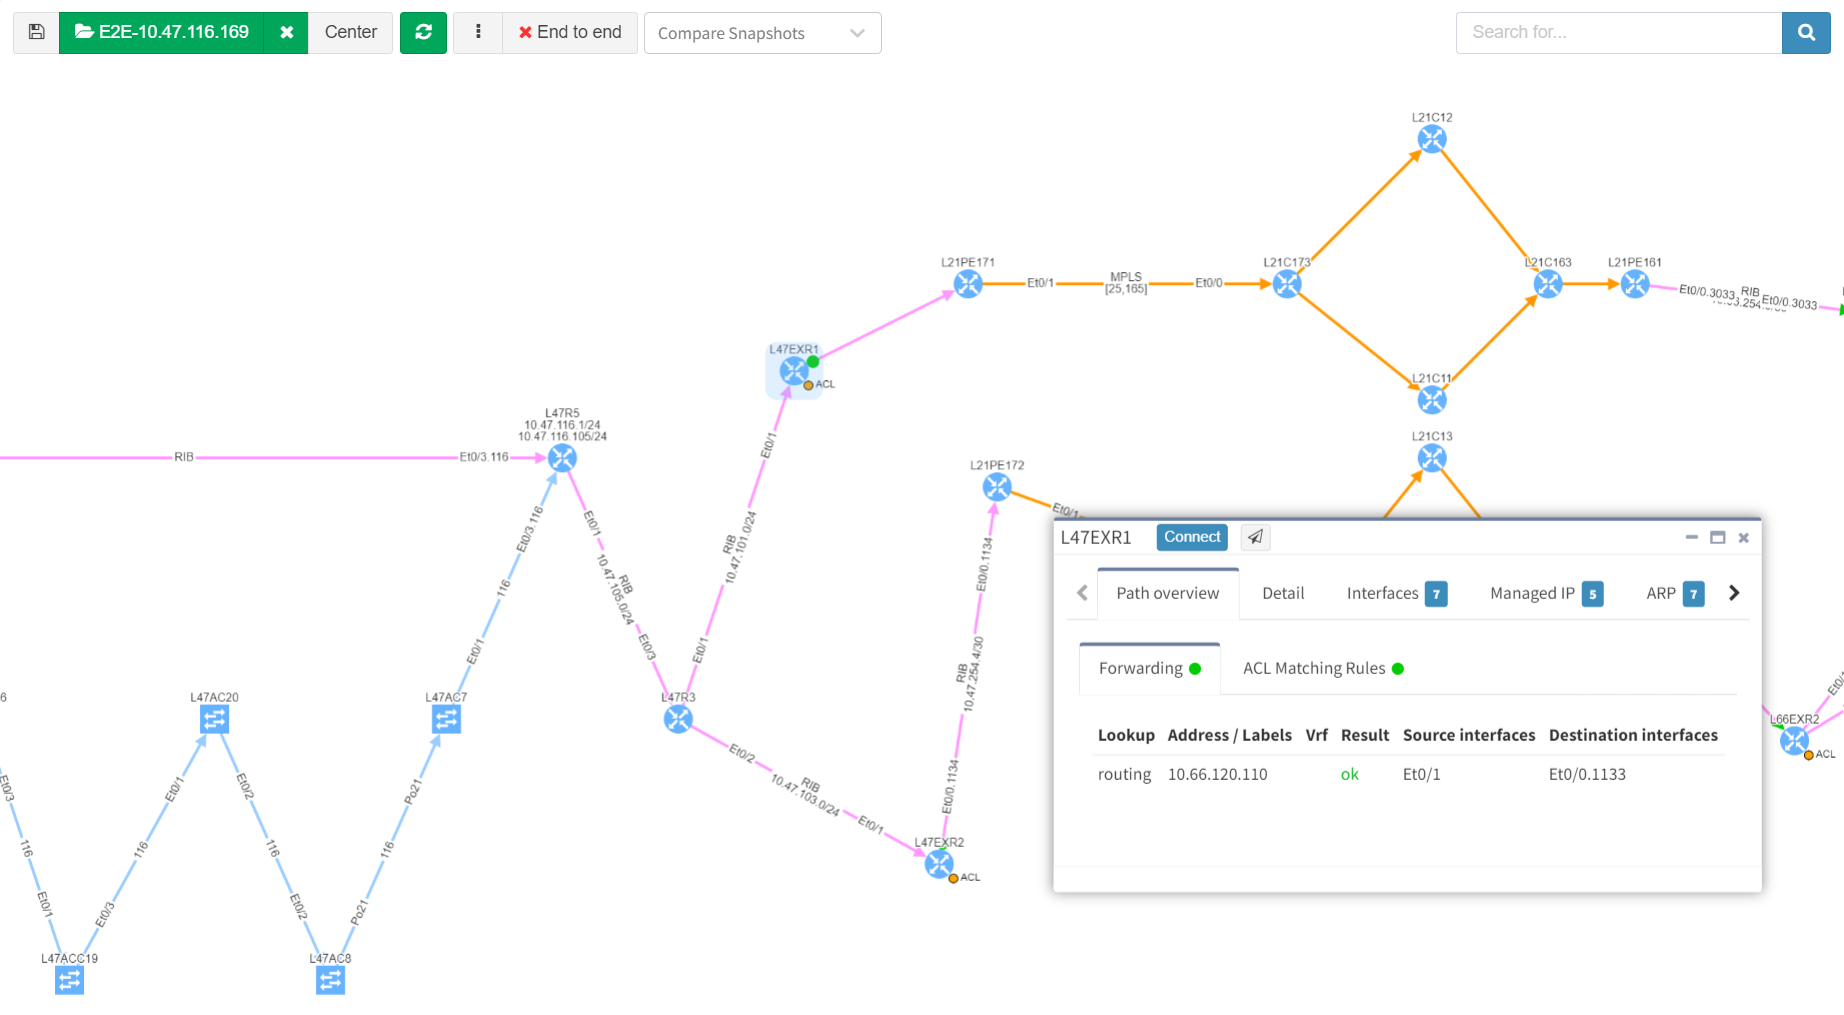
The End to End application path simulation in IP Fabric's GUI is a powerful and fast troubleshooting tool. It's interactive and each routing or switching hop can be investigated individually as well.
But still, there are advantages for API simulation over GUI one. At first, the output in JSON format is ready for non-standard applications. Verifications like what are the IP hops and interfaces used on the path can be easily obtained. Secondly, the API call for path testing can be faster for testing across more than one snapshot.
Another great advantage can be integration plans with other tools. The end to end testing engine is ready to provide answers at a speed of light fashion.
Thank you for reading!
If you have found this article helpful, please follow our company’s LinkedIn or Blog, where there will be more content emerging. Furthermore, if you would like to test our platform to evaluate how it can assist you in managing your network more effectively, please let us know through www.ipfabric.io.

If you ever wonder how to change settings with API in the IP Fabric, then this is the right reading for you. In the previous article, from our API series, we focused on the first steps with IP Fabric's API. It was all about how to authenticate and collect data from inventory.
Today we will take one step further with automation. There are cases where we need to change settings for new network discovery in IP Fabric or start fresh snapshots without interacting with the Graphical User Interface (GUI) by using scripts.
There are multiple endpoints with each specific function in IP Fabric that can help us to change settings with API. In this quick tutorial, we will just mention a few basic ones. The current list of all available endpoints can be found at this site. Let's start with the Seed IP or the starting point for discovery settings.
The seed IP address can be a very important part of the discovery process whenever we are about to discover new networks. By default, if there are no discovered devices, the process starts from the default gateway relative from the IP Fabric server. If not reachable the IPF tries to traceroute over the gateway to discover new hops and if there's nothing found from the traceroute, we will need to define at least 1 device as a starting point.
The main endpoint for Seed modification is:
https://IPFserver/api/v1/settings/seed
and the Seed setup has 3 available methods: GET, POST & PUT. The GET request will respond with the list of available IP addresses or subnets in the Seed. The POST request with a payload including a list of additional IPs will add those to the current list. And the PUT request will remove existing data with new IPs int the payload.
Following code snippet may be used to update the Seed information:
def updateSeed(postSeedServer, postSeedHeaders, postSeedLoad):
    seedPost = requests.post(postSeedServer + 'api/v1/settings/seed', headers=postSeedHeaders, json=postSeedLoad, verify=False)
    if seedPost.reason == 'Not Modified': print(' Seed is remaining the same.')
    elif seedPost.ok: print(' Seed updated successfully with: ' + str(postSeedLoad))
    else: print(' UNABLE to update the Seed: ' + seedPost.text)
return seedPostThe IP Fabric is an extremely flexible system with plenty of available tweaks related to the Discovery process, SSH connections, or system options, like backups. The API endpoint is:
https://IPFserver/api/v1/settings
The main methods are GET for reading all currently applied settings and PATCH will allow us to change settings with API. The following snippet will collect Settings information and provides a complete JSON format.
def getSettings(getSettServer, getSettHeaders):
    settingsGet = requests.get(getSettServer + 'api/v1/settings', headers=getSettHeaders, verify=False)
    if settingsGet.ok: print(' Following Settings are in use: ' + settingsGet.text)
    else: print(' UNABLE to get Settings info: ' + settingsGet.text)
    return settingsGet
Thank you for reading and now enjoy the second part of our recording!
If you have found this article helpful, please follow our company’s LinkedIn or Blog, where there will be more content emerging. Furthermore, if you would like to test our platform to evaluate how it can assist you in managing your network more effectively, please let us know through www.ipfabric.io.


