Let's demonstrate how to integrate IP Fabric directly with Grafana using an Infinity Datasource and creating a Dashboard to visualize the data. This is easily accomplished with the template file located on GitLab and provides your teams a single pane of glass to monitor your network without having to navigate to another website. Following these instructions or those located in the GitLab repo will have you up and running in approximately 5 minutes, so let's get started!


In the top left we see three variables that can be set to change the dashboard data:
IP Fabric Instance: Used for customers with two or more deployments (this can be disabled for customers with a single deployment which is documented below).Snapshot: Provides a way to switch between the loaded snapshots to update the dashboard's data.
The next section provides an overview of the number of licensed and unlicensed devices discovered in the snapshot and the Device Inventory table (limited to 5,000 devices).
hostname: Filtered hyperlink to the Inventory > Devices table.loginIp: Link to directly SSH to the device (see Telment/SSH URL Handler On MS Windows 7 And Later).version: Hyperlink to Inventory > OS Version Consistency filtered on the platform and version.
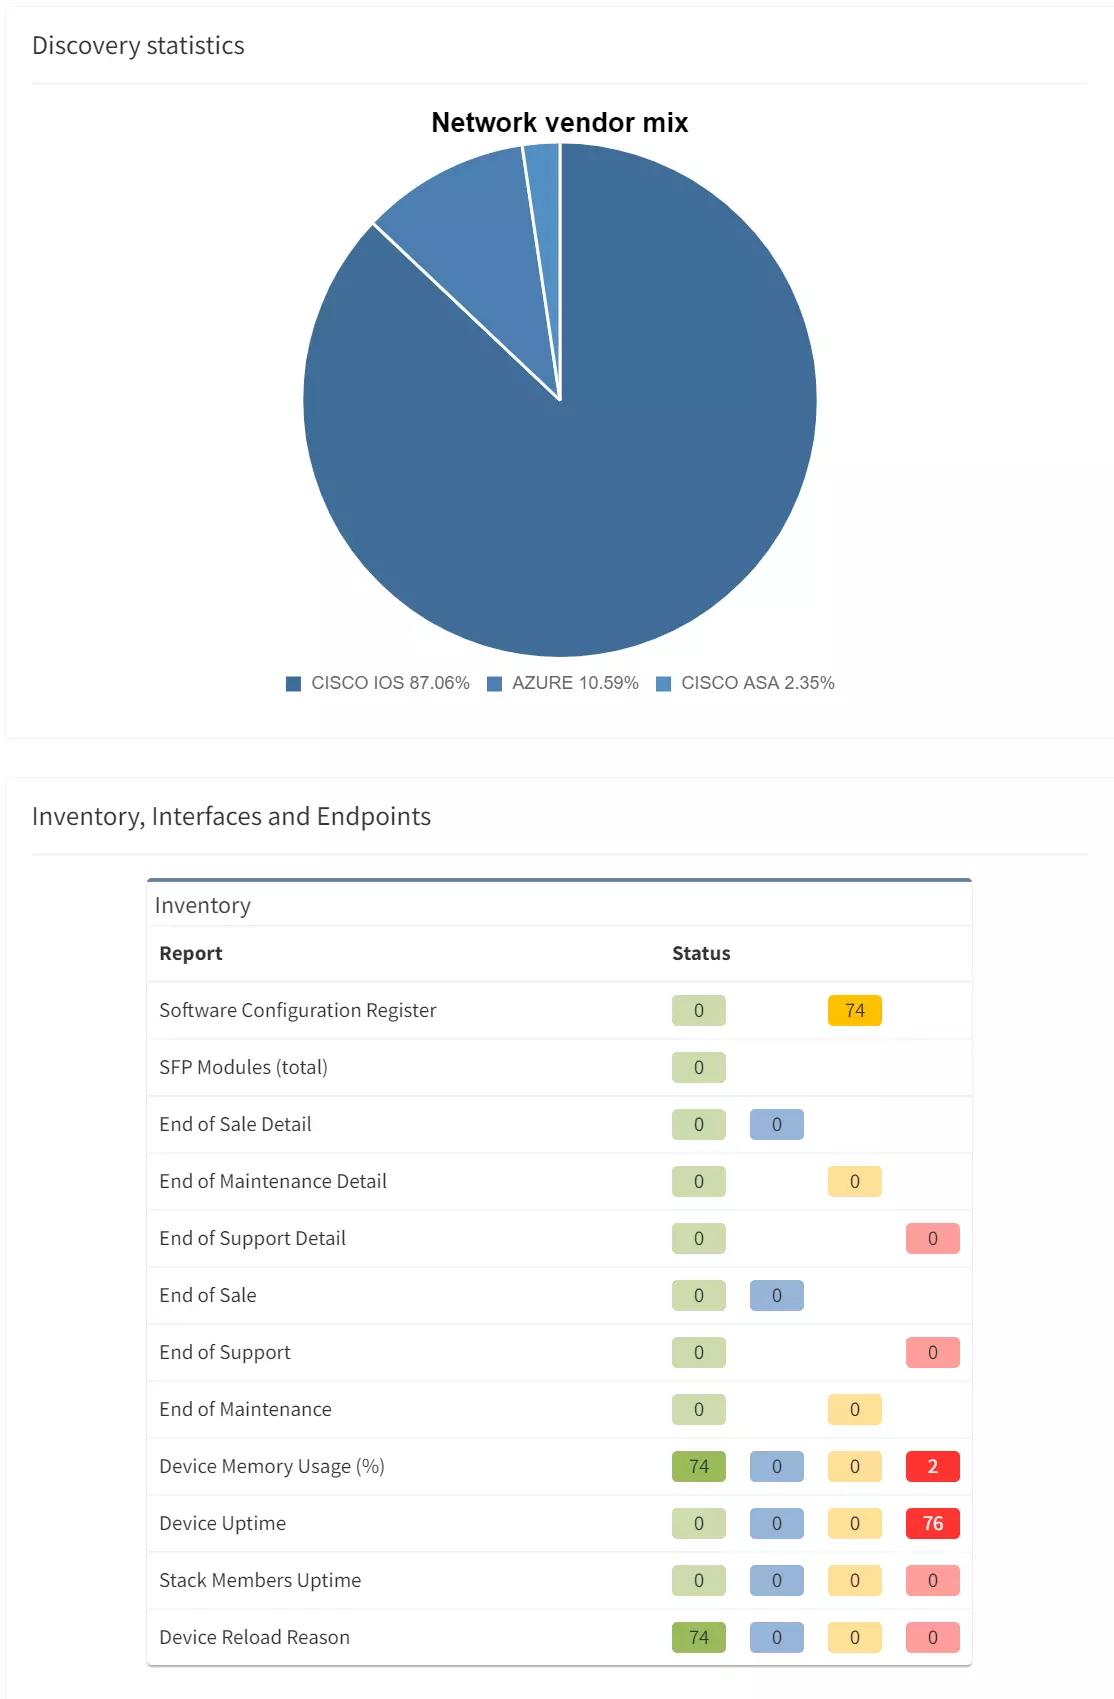
The IP Fabric Dashboard is a mirrored copy of what is seen in the GUI. This also contains links back to IP Fabric tables. Clicking the URL in the Name column will take you to the unfiltered table, however the links in the Green, Blue, Amber, and Red columns will filter that table based on the color you selected.
Also included are tooltips on all the hyperlinks with the description configured in IP Fabric.
Pro Tip: When creating new intent verification rules or editing the defaults, be sure to add or update the descriptions on each color to ensure your users understand what the rule is signifying. This is seen in the below picture where the highlighted green box has a descriptive message to convey the green color's purpose whereas the red box is used to describe the entire intent check.


Finally included in this template are some examples of creating custom visualizations for data your team may want to more closely monitor. These are created using table filters in the GUI and utilizing the API Description to copy those rules into Grafana. To speed up loading of the dashboard, the query is limited to return a single row of data and the value displayed is derived from the returning _meta.count field in the JSON response.
It is not recommended to display tables of data in Grafana due to the current paging limitation. Requesting large amounts of data from IP Fabric using the API without paging can degrade performance for all users.
In this section, we will set up the Infinity data source(s) for connection to the IP Fabric instance which the dashboard will use to pull the data.
In Grafana, navigate using the right hand menu to Connections > Add new connection, search for "Infinity", and select it to create the new connection.

Authentication and select API Key.
Key is required to be set to X-API-Token.Value is the API token you created in the IP Fabric GUI.Allowed hosts with https:// prepending it and pressing Add (i.e. https://demo1.eu.ipfabric.io).Save & test button at the bottom of the page.Cache tab to speed up queries and Dashboard loading.TLS/SSL & Network Settings there is an option to skip TLS verification if your IP Fabric instance does not have a trusted certificate installed.This Dashboard template has been developed to support multiple IP Fabric instances and if this applies to your environment simply create a new data source following these instructions for each of your IP Fabric FQDN(s).
Now that the connection to IP Fabric has been established we can import the Dashboard. This is done by going to the Grafana Dashboards page selecting New and Import. You will need to access the grafana_model.json file from GitLab and either upload the file or copy/paste the contents in the Import via panel json.
After selecting the Load option you have the ability to change the default Dashboard Name from and the folder it will be located under prior to importing.
Once loaded it should take you to the new IP Fabric Dashboard however there is one configuration change to ensure that the dashboard selects the correct data source. Because this template was built to support multiple IP Fabric instances it is required to filter the list of Infinity data sources that are configured across the entire Grafana environment.
Dashboard settings.Variables menu select the instance variable to edit it.Show on dashboard value to Nothing which will disable the drop down to select different servers which is not needed.Instance name filter regex.
/^FQDN$/ (i.e. /^demo1.us.ipfabric.io$/)./^demo1....ipfabric.io$/ or /^demo1.us.ipfabric.io$|^demo1.eu.ipfabric.io$/).Apply.Save dashboard and Close at the top right of the page to return to the Dashboard to verify data is loaded.Also included is a query to fetch the IP Fabric apiVersion for use in all the queries the Dashboard may request. This should ensure stability after upgrading your deployment(s) to a newer version however it is always recommended to check the Release Notes for any breaking changes that may occur between versions.
A fix has been added to resolve an issue after upgrading to IP Fabric 6.3.x on August 10th, 2023. If you imported the Dashboard prior to the fix and have issues with hyperlinks after upgrading please follow the migration documentation on GitLab.
In summary using this IP Fabric Integration template can maximize your teams network monitoring visibility into your already preferred dashboard application Grafana. This template is meant to be a jumping point to provide examples of how to interact with IP Fabric using Grafana and can be further customized to your team's needs.
If you have any questions, ideas for new functionality, or need assistance with installation or configuration please reach out to your Solution Architect for assistance. I hope you found this an exciting new way to extend the capabilities of your IP Fabric deployment!
If this post has piqued your interest, and you'd like to see the integration in action, please check out #TechFabric 7 - Integrating IP Fabric with Grafana Webinar on LinkedIn!
Want to see IP Fabric in action for yourself? Try our free, self-guided demo here.
Prefer the personal touch? Reach out to us to schedule a free demo, zero obligations required!
Let's demonstrate how to integrate IP Fabric directly with Grafana using an Infinity Datasource and creating a Dashboard to visualize the data. This is easily accomplished with the template file located on GitLab and provides your teams a single pane of glass to monitor your network without having to navigate to another website. Following these instructions or those located in the GitLab repo will have you up and running in approximately 5 minutes, so let's get started!
In the top left we see three variables that can be set to change the dashboard data:
IP Fabric Instance: Used for customers with two or more deployments (this can be disabled for customers with a single deployment which is documented below).Snapshot: Provides a way to switch between the loaded snapshots to update the dashboard's data.The next section provides an overview of the number of licensed and unlicensed devices discovered in the snapshot and the Device Inventory table (limited to 5,000 devices).
hostname: Filtered hyperlink to the Inventory > Devices table.loginIp: Link to directly SSH to the device (see Telment/SSH URL Handler On MS Windows 7 And Later).version: Hyperlink to Inventory > OS Version Consistency filtered on the platform and version.The IP Fabric Dashboard is a mirrored copy of what is seen in the GUI. This also contains links back to IP Fabric tables. Clicking the URL in the Name column will take you to the unfiltered table, however the links in the Green, Blue, Amber, and Red columns will filter that table based on the color you selected.
Also included are tooltips on all the hyperlinks with the description configured in IP Fabric.
Pro Tip: When creating new intent verification rules or editing the defaults, be sure to add or update the descriptions on each color to ensure your users understand what the rule is signifying. This is seen in the below picture where the highlighted green box has a descriptive message to convey the green color's purpose whereas the red box is used to describe the entire intent check.
Finally included in this template are some examples of creating custom visualizations for data your team may want to more closely monitor. These are created using table filters in the GUI and utilizing the API Description to copy those rules into Grafana. To speed up loading of the dashboard, the query is limited to return a single row of data and the value displayed is derived from the returning _meta.count field in the JSON response.
It is not recommended to display tables of data in Grafana due to the current paging limitation. Requesting large amounts of data from IP Fabric using the API without paging can degrade performance for all users.
In this section, we will set up the Infinity data source(s) for connection to the IP Fabric instance which the dashboard will use to pull the data.
In Grafana, navigate using the right hand menu to Connections > Add new connection, search for "Infinity", and select it to create the new connection.
Authentication and select API Key.
Key is required to be set to X-API-Token.Value is the API token you created in the IP Fabric GUI.Allowed hosts with https:// prepending it and pressing Add (i.e. https://demo1.eu.ipfabric.io).Save & test button at the bottom of the page.Cache tab to speed up queries and Dashboard loading.TLS/SSL & Network Settings there is an option to skip TLS verification if your IP Fabric instance does not have a trusted certificate installed.This Dashboard template has been developed to support multiple IP Fabric instances and if this applies to your environment simply create a new data source following these instructions for each of your IP Fabric FQDN(s).
Now that the connection to IP Fabric has been established we can import the Dashboard. This is done by going to the Grafana Dashboards page selecting New and Import. You will need to access the grafana_model.json file from GitLab and either upload the file or copy/paste the contents in the Import via panel json.
After selecting the Load option you have the ability to change the default Dashboard Name from and the folder it will be located under prior to importing.
Once loaded it should take you to the new IP Fabric Dashboard however there is one configuration change to ensure that the dashboard selects the correct data source. Because this template was built to support multiple IP Fabric instances it is required to filter the list of Infinity data sources that are configured across the entire Grafana environment.
Dashboard settings.Variables menu select the instance variable to edit it.Show on dashboard value to Nothing which will disable the drop down to select different servers which is not needed.Instance name filter regex.
/^FQDN$/ (i.e. /^demo1.us.ipfabric.io$/)./^demo1....ipfabric.io$/ or /^demo1.us.ipfabric.io$|^demo1.eu.ipfabric.io$/).Apply.Save dashboard and Close at the top right of the page to return to the Dashboard to verify data is loaded.Also included is a query to fetch the IP Fabric apiVersion for use in all the queries the Dashboard may request. This should ensure stability after upgrading your deployment(s) to a newer version however it is always recommended to check the Release Notes for any breaking changes that may occur between versions.
A fix has been added to resolve an issue after upgrading to IP Fabric 6.3.x on August 10th, 2023. If you imported the Dashboard prior to the fix and have issues with hyperlinks after upgrading please follow the migration documentation on GitLab.
In summary using this IP Fabric Integration template can maximize your teams network monitoring visibility into your already preferred dashboard application Grafana. This template is meant to be a jumping point to provide examples of how to interact with IP Fabric using Grafana and can be further customized to your team's needs.
If you have any questions, ideas for new functionality, or need assistance with installation or configuration please reach out to your Solution Architect for assistance. I hope you found this an exciting new way to extend the capabilities of your IP Fabric deployment!
If this post has piqued your interest, and you'd like to see the integration in action, please check out #TechFabric 7 - Integrating IP Fabric with Grafana Webinar on LinkedIn!
Want to see IP Fabric in action for yourself? Try our free, self-guided demo here.
Prefer the personal touch? Reach out to us to schedule a free demo, zero obligations required!