NetMRI has reached end-of-support and you need a new way to discover and model your enterprise network. Take note - a new way, not a replacement discovery tool that gives you the same fractured view of your network that you've been clinging to as some illusion of network visibility.
While traditional network discovery tooling might have offered insight into specific domains or tech, the complex enterprise network of today demands more. Much more. We propose a vendor-neutral, end-to-end network discovery and modeling approach – automated network assurance - as a new approach to enterprise network management.
It is only with this end-to-end view and network-wide visibility that network teams can enjoy benefits like:
Your modern enterprise network spans on-prem and cloud, is vendor-diverse, and embraces software-defined networking technologies (and if you plan to maintain security, compliance, and connectivity requirements amidst increasing demands, you’ll continue seeking out new tech that helps your network support business growth). Your legacy tech sits beside these new innovations, creating an ever-changing, complex brownfield ecosystem to contend with.
So why are you afraid of losing end-to-end network visibility when you never really had it? Use this opportunity to break free of the devil you know - a fragmented view of disparate parts of your network - and embrace a network-level approach. Has your traditional discovery approach resolved the burning issue of siloed (and inaccurate) documentation? Solved cross-team friction? Given you the means to surface and codify tribal knowledge?
Your problem isn’t vendor-specific. Your problem isn’t domain-specific, or technology-specific, or device-specific. Your problem is a need to understand and validate network behavior, with a network-wide scope. So why would you limit your network discovery with a one-to-one replacement of NetMRI? Device-level solutions may solve an immediate compliance issue or connectivity issue, but they don’t solve a long-term reality issue. The reality is your network teams need more - they need an end-to-end network model to be effective.
They need an end-to-end view of your network that includes inventory, state, configuration, and topology information and allows you to run network-wide intent checks to ensure the whole network is operating as intended. It must be built with your tech ecosystem in mind, and support API calls to access and use this essential network data where needed. It must support your SDN projects and your multi-cloud instances. It must be efficient, scalable, and flexible enough to support and future-proof your network as it evolves.
It’s called an automated network assurance platform. IP Fabric.
Enterprise networking professionals understand that their networks are not going to get less complex. The complexity isn’t going away, the business is only getting more demanding… good thing network engineers love wicked problem-solving, right? We’ve already covered all the demands placed on modern enterprise networks, but understanding the problem is half the job. We have to look at realistic ways to meet the challenge. A tempting solution is an oft-promised single pane of glass (SPoG) solution. Clean, simple dashboards that show you everything you need to know about your network, integrate cleanly with your existing tools, in a user-friendly and understandable interface. A dream, right?
That’s the frustrating truth. There’s a huge incongruency between the expectation and reality of SPoG tools, and their utility in network management. Simply put, in an attempt to marry disparate network data and gain a deeper understanding of your network behavior, using them can have the opposite effect, keeping your understanding of the network limited - like a match in a forest, lighting some of the way, the utility burns out quickly and leaves your understanding of your environment shallow (or potentially burns down everything around you with a wrong move).
Since we've really been on this metaphor of the enterprise network as a living ecosystem, let's continue. A limited SPoG tool reminds me of Bolton Strid - if you've never heard of it, it's a seemingly idyllic six-foot stretch of river in Yorkshire. Appearing shallow to passersby, it is, in reality, incredibly deep and deadly should you fall in, and its calm surface hides swirling, beating water hammering the sides of dangerous cave formations. Like with a stroll in the woods, when it comes to your network, knowledge is power, and preparation is key.
Let’s look at why.

Having an overview of your network is certainly useful, but simply papering over complexity to make network management seem simple will have consequences.
That's not to say some abstraction is not useful. Automated network assurance places emphasis on interpreting and normalizing network data to make it consumable. But there's a difference between making use of consumable, accessible network data to introduce, for example, self-service processes, or eliminate bottlenecks in cross-team workflows, and letting a limited scope of visibility become your only view of the network because the limitations haven't had consequences - yet.
Common limitations that will hinder how useful your SPoG solution is include:
This can create the exact opposite of what you trying to achieve; more information siloes, more team friction, and more network vulnerability.
The IP Fabric platform offers the most comprehensive network data about your entire network estate, regardless of vendor or domain. It's also easy to plug this end-to-end understanding into whatever tools you need via REST API. The result is that you can easily surface information needed by different SMEs throughout your entire network ecosystem. And it's normalized, structured, and vendor-neutral. And therefore, useful.
Frankly, no product can “do it all” for your network (and if they claim that, prepare for disappointment). There will be necessary limitations.
When a network issue falls beyond the scope of the tool you’re relying on, you won’t have the context necessary to solve the issue efficiently. More problematically, when you isolate the issue, wading out of the comfy confines of your nice little network abstraction may reveal gaps in your network knowledge, if you’ve been hands-off with other domains of your network for too long.
You might have to ask yourself an uncomfortable question if you’ve been coasting with a tool that abstracts parts of your network but masks its vast and messy nature. Do you really know your network? Do you know it end to end?
Relying on single-pane-of-glass tools with a limited view of your network will translate to you having a limited understanding of the network. The daily bread and butter of network engineers – configuration changes, incident resolution, expanding the network – all have effects throughout your interconnected network environment.
We’ve characterized the modern enterprise network as a living being before. Just like a living being, our environmental changes can have knock-on effects we won’t see with tunnel vision. Our perspective of the network must be holistic for it to thrive.

Automated network assurance goes beyond checking and validating the operational state of one device. Understanding the outcome of change on the whole network is essential. Understanding the full blast radius of network incidents, and observing the ripple effects of network change... this is what you’re missing when you rely on a fish tank to tell you something about the ocean tides.
Single pane of glass tools are used in enterprise IT systems to get a unified view of network operations. However, despite their convenience, they have limitations that can impede their effectiveness in modern, complex network environments. Their limitations may give network operators a false sense of security that can have consequences on your entire network ecosystem.
Rather than trying to find the one - that magic tool that's going to solve all your problems - the modern network team should focus on building a trackable and comprehensive foundation of network knowledge that be leveraged for different use cases in a stable and trustworthy way. This can help IT teams make data-driven decisions without the fear of network unknowns. Automated network assurance is a clear answer to this need.
With Cisco's recent announcement of End-of-life and End-of-support dates for the Cisco Prime Infrastructure network management tool, users are now faced with the task of finding suitable alternatives to ensure seamless business continuity during the transition away from Prime.
While a shift towards Cisco DNA Center may seem the automatic answer, it's crucial for users to take this opportunity to evaluate what truly aligns with their team's specific requirements. Is DNAC capable of meeting your needs while providing better value? The price tag associated with Cisco DNAC and limitations in scope may cause teams to pause when making the leap. For instance, if you're managing a complex multi-cloud or multi-vendor network, DNAC won’t address all your requirements effectively.
There’s also something to consider in a completely new approach to how you manage and operate your network. Traditional tooling views validation of your network as a device-level challenge. While it is certainly useful and necessary to validate the state of each network device, having the big picture – an end-to-end, complete network model – is where traditional tools fall short. Automated network assurance platforms like IP Fabric bring insight to the network as a whole and validate network health rather than just device state. The vast and complex nature of modern IT networks makes this big-picture view all the more necessary; you need to know the outcome of change across your entire network, not just per-device.
So, depending on how you use Prime, there could be other avenues to explore. Automated network assurance, for example, while not pushing config to devices, provides much of the necessary end-to-end network insight that teams rely on Prime for. In fact, a vendor-neutral, cloud-inclusive platform will prove a welcome one-stop shop for business-critical data collection and validation tasks.
Cisco Prime Infrastructure allows users to define custom compliance policies, such as those needed to maintain ISO 27001 compliance and perform audits, evaluate the results, and run a fix job if necessary. Even if this is only done a few times a year, having a method to surface this information automatically avoids a time-intensive process of manually collecting configuration information from individual devices. Simply not a feasible way to work with a large network!
During the network discovery process, IP Fabric uses SSH to collect configuration and state data from supported network devices (there are hundreds of supported models across an always-expanding list of vendors). This is interpreted, normalized, and visualized in flexible snapshots of your network that provide both a holistic overview and allow users to dig into granular detail where needed.
Additionally, for this use case in particular, you can make use of 150+ built-in or custom intent checks (in this case, compliance checks) to highlight drift from network intent, which is informed by your compliance rules. Every time you take a network snapshot, you can easily see misconfigurations that violate your own organizational standards or that of specific industry regulations like PCI or ISO 27001.
Once the correct config has been pushed, IP Fabric can take another snapshot to validate that the whole network, regardless of vendor or domain, is operating as intended. IP Fabric runs end-to-end path simulations and can validate that your security policies are being applied as you intend.
This means fast, accurate, and continuous compliance, giving you confidence when those security or regulatory compliance audits come around year after year.
Regularly scheduled backups of your switch, router, and firewall configurations are standard best practice to ensure easy rollbacks after that “oh no” moment when a change has unexpected consequences, for routine device upgrades, for disaster recovery, and of course, to ensure compliance. Cisco Prime Infrastructure allows users to backup and restore switch, router, and firewall configurations on a customizable schedule, and seamlessly migrating this process over to a new platform is essential.
Since all the network state and configuration info is collected in an IP Fabric network snapshot, and these snapshots can be scheduled as often as your team prefers (or be made on-demand), you’ll have access to a historical database of your switch and router backups at different times whenever you need them.
Note that this is for your whole network, end-to-end, all vendors, and through to the Cloud. Additionally, unlike platforms that offer similar functionality, IP Fabric has the benefit of keeping all these snapshots available on the platform for you to query at any time, making it a perfect resource for historical troubleshooting.
You can’t escape that your enterprise network is subject to change, and as daily demands ebb and flow, you need to have a pulse on system health and performance. Cisco Prime Infrastructure collects real-time and historical data from network devices. It then presents key device health indicators like CPU and memory use in dashboards. Users can set thresholds for alerts and quickly identify potential issues.
Network engineers can leverage IP Fabric in a similar way to ensure their network infrastructure is performing optimally and swiftly address any anomalies that might affect performance or uptime. The in-depth, normalized data that IP Fabric collects via snapshots can be integrated via open API with real-time monitoring tools to contextualize and prioritize incoming alerts, ensure that you’re monitoring everything in your network, and give engineers what they need to proactively solve high-priority incidents. And, of course, this utility extends beyond just Cisco devices.
As Cisco sunsets an essential resource for key network data and operations, there’s no need to feel backed into a corner and buy an expensive, vendor-restrictive solution to cover these gaps. Automated network assurance gives you a normalized and consumable bank of network intelligence that allows you to cover many Cisco Prime Infrastructure use cases more comprehensively at a fraction of the cost. In addition, A move toward a network model-based approach can also open new doors to innovation that previously, traditional tooling focused on device-level validation simply didn’t consider.
Consider this moment – which could be a frustrating headache - an opportunity to optimize your network tolling ecosystem with a solution that grows in value over time with straightforward, per-device licensing and an open API.
There is inherent and unavoidable complexity in modern enterprise networks. With the demands of more distributed workplaces, remote services, and the necessary diversity of network vendors and technologies, this complexity isn’t going away. Complexity is not only defined by the number of network elements in your environment but the interconnections and relationships between these often differently managed domains. A siloed understanding of your responsibilities or domain without at least visibility of the whole network is simply not sufficient for 2023 networking.
Network professionals must find a way to effectively manage complexity while delivering more than they ever have before – and be careful about their methods. Tools or strategies that paper over this complexity without aiding the operator's understanding of it simply push the problem down the road. When an issue arises that requires wading into the thick of a domain you don’t understand, you’ll be lost in your own network – not ideal.

The answer to this may feel simple – let’s just automate more of our network processes, then we don’t have to deal with this complexity day in and day out - job done, eh? Of course, network automation frees up time by streamlining repetitive and routine operations (software upgrades, device configuration), making your teams more agile, efficient, and in control.
So, what’s the risk? When can it all fold in, and how can you avoid this? Automating:
(1) without a full and accurate understanding of what’s in your network and how it's connected and (2) without a method of validating your network state pre- and post-automated change make it a matter of time before knowledge gaps become a problem for your team.
Automating network processes is heralded as a solution to this complexity but runs the aforementioned risk of becoming a paper tiger; a promised attack plan that crumbles in practice. After all, the difficult part is not pushing config to hundreds of devices. The difficult, but vitally important part, is understanding the full effect of this change on your network as a whole. A holistic view of the effect of change on the network end-to-end is essential.
However, if you choose to bring this understanding to the surface – through homegrown tools, or purchasing a solution – it should be seen as a prerequisite for automation, not a nice-to-have afterthought. This is not a lesson you want to learn the hard way.
If you’re an individual pushing the automation agenda within an enterprise network team, not having the buy-in of leadership can leave your automation projects neglected, and you without the bandwidth to maintain them, properly document their usefulness, and integrate them fully into team-wide workflows.
If the automation push is coming from the organizational level, it may face challenges in terms of coordination and alignment with the overall network operations and business objectives. Lack of clear leadership support and strategic direction can result in fragmented or disjointed automation efforts, where different teams or departments implement automation in isolation, leading to inconsistent results and increased complexity.
Without a unified approach, automation projects may lack the necessary resources, prioritization, and governance to succeed in the long run, leaving them as isolated point solutions rather than part of a cohesive automation strategy. Avoiding these risks requires a collaborative effort between automation advocates and leadership to ensure that automation initiatives are well-planned, aligned with business goals, and supported by the necessary resources and governance to drive meaningful outcomes for the entire organization.
A successful strategy for automating network complexity requires a holistic approach. It starts with gaining a deep understanding of your network environment, including all the network elements, their interconnections, and relationships. Network data is absolutely key to successful automation. A reliable, comprehensive, and up-to-date inventory of your network assets is not just nice to have, but the foundation for effective automation.
Only once this is in place can you start to implement your vision, but here, again, one must be strategic. Starting small is wise, and try to identify low-risk, big-win projects that help prove the value of automation. Finally, ensure that you have robust methods of validating network state before and after automated changes. This includes comprehensive testing, monitoring, and verification mechanisms to catch any discrepancies and ensure network stability.
In general, combining the wins from automation with guarantees of continuous network connectivity and security can help gain the confidence of even the most risk-averse leaders.
Automated network assurance is a trusted way to ensure this necessary confidence as you automate, providing a clear starting point that may take months or years to get to manually. It puts network data in the hands of your team so they can:
(1) proactively detect and resolve issues,
(2) assess the impact of changes and
(3) ensure adherence to stated network intent, which reflects business goals.
It ensures that your network remains stable, secure, and reliable, even as automation efforts accelerate.
So, while automation is often hailed as a solution to network complexity, it requires a thoughtful and strategic approach to be truly effective. Simply automating without a comprehensive understanding of the network and proper validation mechanisms can lead to incomplete or failed automation projects, which means wasted time, potential vulnerabilities, and even more unknowns.

However, by adopting a holistic approach that includes flexible and detailed network mapping, well-defined automation plans, and robust network assurance practices, you can leverage automation as a powerful tool to streamline network operations, enhance agility, and optimize network performance in the face of increasing complexity.
Let's demonstrate how to integrate IP Fabric directly with Grafana using an Infinity Datasource and creating a Dashboard to visualize the data. This is easily accomplished with the template file located on GitLab and provides your teams a single pane of glass to monitor your network without having to navigate to another website. Following these instructions or those located in the GitLab repo will have you up and running in approximately 5 minutes, so let's get started!


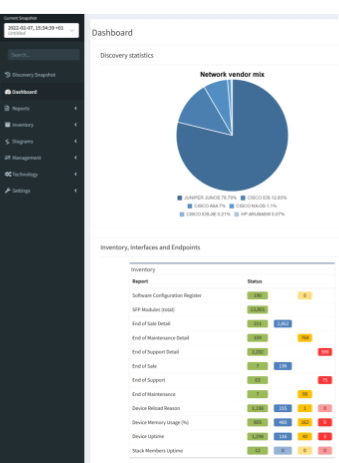
In the top left we see three variables that can be set to change the dashboard data:
IP Fabric Instance: Used for customers with two or more deployments (this can be disabled for customers with a single deployment which is documented below).Snapshot: Provides a way to switch between the loaded snapshots to update the dashboard's data.
The next section provides an overview of the number of licensed and unlicensed devices discovered in the snapshot and the Device Inventory table (limited to 5,000 devices).
hostname: Filtered hyperlink to the Inventory > Devices table.loginIp: Link to directly SSH to the device (see Telment/SSH URL Handler On MS Windows 7 And Later).version: Hyperlink to Inventory > OS Version Consistency filtered on the platform and version.
The IP Fabric Dashboard is a mirrored copy of what is seen in the GUI. This also contains links back to IP Fabric tables. Clicking the URL in the Name column will take you to the unfiltered table, however the links in the Green, Blue, Amber, and Red columns will filter that table based on the color you selected.
Also included are tooltips on all the hyperlinks with the description configured in IP Fabric.
Pro Tip: When creating new intent verification rules or editing the defaults, be sure to add or update the descriptions on each color to ensure your users understand what the rule is signifying. This is seen in the below picture where the highlighted green box has a descriptive message to convey the green color's purpose whereas the red box is used to describe the entire intent check.


Finally included in this template are some examples of creating custom visualizations for data your team may want to more closely monitor. These are created using table filters in the GUI and utilizing the API Description to copy those rules into Grafana. To speed up loading of the dashboard, the query is limited to return a single row of data and the value displayed is derived from the returning _meta.count field in the JSON response.
It is not recommended to display tables of data in Grafana due to the current paging limitation. Requesting large amounts of data from IP Fabric using the API without paging can degrade performance for all users.
In this section, we will set up the Infinity data source(s) for connection to the IP Fabric instance which the dashboard will use to pull the data.
In Grafana, navigate using the right hand menu to Connections > Add new connection, search for "Infinity", and select it to create the new connection.

Authentication and select API Key.
Key is required to be set to X-API-Token.Value is the API token you created in the IP Fabric GUI.Allowed hosts with https:// prepending it and pressing Add (i.e. https://demo1.eu.ipfabric.io).Save & test button at the bottom of the page.Cache tab to speed up queries and Dashboard loading.TLS/SSL & Network Settings there is an option to skip TLS verification if your IP Fabric instance does not have a trusted certificate installed.This Dashboard template has been developed to support multiple IP Fabric instances and if this applies to your environment simply create a new data source following these instructions for each of your IP Fabric FQDN(s).
Now that the connection to IP Fabric has been established we can import the Dashboard. This is done by going to the Grafana Dashboards page selecting New and Import. You will need to access the grafana_model.json file from GitLab and either upload the file or copy/paste the contents in the Import via panel json.
After selecting the Load option you have the ability to change the default Dashboard Name from and the folder it will be located under prior to importing.
Once loaded it should take you to the new IP Fabric Dashboard however there is one configuration change to ensure that the dashboard selects the correct data source. Because this template was built to support multiple IP Fabric instances it is required to filter the list of Infinity data sources that are configured across the entire Grafana environment.
Dashboard settings.Variables menu select the instance variable to edit it.Show on dashboard value to Nothing which will disable the drop down to select different servers which is not needed.Instance name filter regex.
/^FQDN$/ (i.e. /^demo1.us.ipfabric.io$/)./^demo1....ipfabric.io$/ or /^demo1.us.ipfabric.io$|^demo1.eu.ipfabric.io$/).Apply.Save dashboard and Close at the top right of the page to return to the Dashboard to verify data is loaded.Also included is a query to fetch the IP Fabric apiVersion for use in all the queries the Dashboard may request. This should ensure stability after upgrading your deployment(s) to a newer version however it is always recommended to check the Release Notes for any breaking changes that may occur between versions.
A fix has been added to resolve an issue after upgrading to IP Fabric 6.3.x on August 10th, 2023. If you imported the Dashboard prior to the fix and have issues with hyperlinks after upgrading please follow the migration documentation on GitLab.
In summary using this IP Fabric Integration template can maximize your teams network monitoring visibility into your already preferred dashboard application Grafana. This template is meant to be a jumping point to provide examples of how to interact with IP Fabric using Grafana and can be further customized to your team's needs.
If you have any questions, ideas for new functionality, or need assistance with installation or configuration please reach out to your Solution Architect for assistance. I hope you found this an exciting new way to extend the capabilities of your IP Fabric deployment!
If this post has piqued your interest, and you'd like to see the integration in action, please check out #TechFabric 7 - Integrating IP Fabric with Grafana Webinar on LinkedIn!
Want to see IP Fabric in action for yourself? Try our free, self-guided demo here.
Prefer the personal touch? Reach out to us to schedule a free demo, zero obligations required!
IP Fabric's GUI provides you with Excel-like tables for filtering and querying data, but sometimes engineers require data to be extracted for more advanced reporting or Power BI dashboards. In this blog, I will demonstrate how to directly connect IP Fabric to Microsoft Excel or Power BI without using CSV exports. This has been simplified into functions stored in template files allowing you to pull any IP Fabric table in seconds!
Documentation and template files are located in the IP Fabric Integrations GitLab.
You must have web API access to the IP Fabric server (default is port 443). If running these queries from Excel in Office 365 or Power BI in the cloud, your IP Fabric instance must be reachable from the public Internet.
Microsoft Excel and Power BI will only allow you to communicate with websites that have valid and trusted SSL certificates. The easiest solution is to install a trusted certificate on the IP Fabric server that has been signed by a CA in your Trusted Root Certification Authorities. If you are unable to create a signed certificate you are also able to use a self-signed cert and install it on your location machine. This must be done for every user/computer that will be running the Power Query and you will not be allowed to run these queries in the Cloud.
Finally, you will also need to have, or create, an API Token. This token will be saved within the file (or the data source on powerbi.com) so sharing is not recommended. We recommend either removing your personal token before sharing the file (or posting the file to a shared cloud space, i.e. SharePoint) or creating a limited read-only account and API token. If you need more information or assistance with read-only accounts and RBAC please reach out to your Solution Architect.
After opening either the Excel or Power BI template file there are two required configurations that must be done prior to accessing data. You may be required to accept some warning messages about communicating with external content prior to being able to continue.
In Excel open the Data Ribbon and click "Queries & Connections" and right-click the IPF_URL query and select edit. This will bring up the Power Query Editor where you are able to input your information. Example configuration:
12dd8c61-129c-431a-b98b-4c9211571f89If you are using Power BI when you open the template file you will be prompted with a pop-up to enter these variables. To access the Power Query Editor simply click "Transform data" in the Queries section of the Home ribbon.
Finally, you should be asked about data source settings prior to connecting, if not then select the Snapshots connection and in the Home ribbon in the Power Query Editor select select Refresh Preview. For the Credentials select Anonymous and for Privacy level either check the Ignore Privacy Levels box or select any level and press save. Once completed you should now see a table of the loaded Snapshots.
The queryIPF function simplifies the pulling of data with only one required parameter, the API endpoint of the table. This can be located by selecting the Table Description or the ? icon on any of the tables and copying the URL under the API Description. For example, I would like to pull my Inventory > Devices table into Excel.
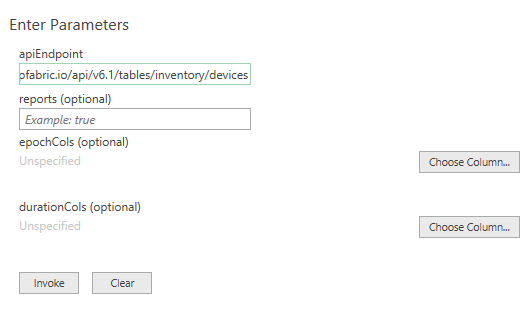
The reports variable defaults to false, setting to true will include the Intent Checks for the table if any are configured. This will be a new column named colname.severity where severity equals one of the following:
Once configured select Invoke (the epochCols and durationCols can be specified after invoking the function which will be discussed later).
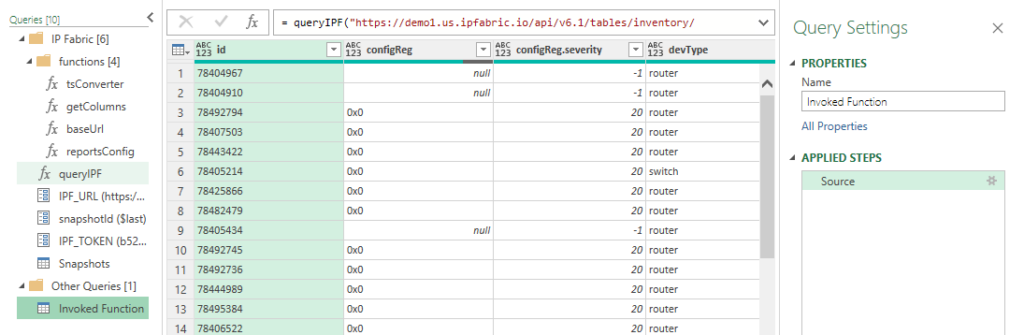
Now we have the Inventory > Devices table loaded. Changing the Properties > Name will change the Excel Worksheet name so it is recommended to update this value. In this example I specified reports=true and we can see the new configReg.severity column.
Finally, click the Home ribbon Close & Load which will update work workbook or to add more tables simply repeat this process for each table you desire! It is really that simple.
Times in IP Fabric are stored in two different formats. When you use the API you will see that an integer is returned unlike when you view it in the GUI. Let's take a look at these formats:
colnameAsDatecolnameAsTimeIn the Device Inventory, the uptime can be converted into a human-readable format in Excel. Simply change the query by adding a list and the column name.
Original:
= queryIPF("https://demo1.us.ipfabric.io/api/v6.1/tables/inventory/devices", true, null, null)
Modified:
= queryIPF("https://demo1.us.ipfabric.io/api/v6.1/tables/inventory/devices", true, null, {"uptime"})
This then converts 3435180 into 39.18:13:00 (39 days, 18 hours, 13 minutes and 0 seconds.)
Epoch example with the End of Life detail table:
= queryIPF("https://demo1.us.ipfabric.io/api/v6.1/tables/reports/eof/detail", true, {"endSale", "endMaintenance", "endSupport"}, null)
As valuable as contextualized network data is for your engineering teams, we know how insightful it can be also for adjacent teams, leadership, or third parties. Using our IP Fabric-developed Excel and Power BI template files, you can communicate directly with IP Fabric without exporting CSVs, seamlessly leveraging this data for high-level and detailed reports and presentations.
If you found this interesting and want to implement this in your environment, please look at the following quick videos for a visual demonstration and more advanced information. This includes how to work with nested objects and/or lists as well as joining tables. Reach out to your IP Fabric Solution Architect for more information or assistance!
Want to try out IP Fabric yourself? Sign up for our self-guided demo and see what automated assurance could do for your network teams.
Guest post by Shamus McGillicuddy, Vice President of Research at EMA
Data is essential to network automation. Network administrators review network data whenever they must implement a change through a network automation tool. Thus, any network automation strategy must take a rigorous approach to how solutions collect and manage network data. Enterprise Management Associates (EMA) recently explored the importance of data management in new research on data center network automation.
Our survey of 359 technology pros found that 48% of companies have data center network automation solutions that rely at least partially on manual data gathering. In other words, administrators must consult separate systems to find data they need in order to make a change in a network automation tool.
“We are somewhat manual,” a NetDevOps engineer with a large European government agency told EMA. “We have [a commercial network data repository], but it’s not fit for a purpose, and it’s always out of data. So, engineers revert to using spreadsheets.”
Nearly 51% of the organizations that rely on manual data gathering told EMA that these manual processes have degraded the effectiveness of their data center network automation solutions. EMA research found that there are three primary negative impacts from network automation that relies on manual data management.
EMA recommends that network data management should be a critical focus of any network automation strategy. The automation toolset should have comprehensive and reliable access to all network data that administrators need to implement automated changes.
“When an engineer has everything they need to execute a change right in front of them, it leads to high-quality work with a quick turnaround time.”
Network automation engineer with a $3 billion retailer.
As much as possible, tool architects should select and implement network automation tools that automate the gathering of all network data that users need for their workflows. This data strategy should provide insight into both network intent and network state. It should start with configuration and inventory data (intent), as well as device metrics and topology, then forwarding and policy behavior (state). This approach allows the network team to establish a true source of truth about the network.
From there, tool architects should think about how they can leverage this source of truth to establish a digital twin of the network, which will allow them to simulate, visualize, and understand how the state of a network matches their intent for the network. EMA research found that 88% of technology pros believe it is useful to have a digital network twin capability in their data center network automation tools. They told EMA that these digital twins are helpful in a variety of ways, including capacity planning, network design, troubleshooting, and threat modeling.
With continuous insight into network intent and network state, a network automation tool can evolve into a network assurance platform. EMA research found that 89% of technology pros believe it is important for data center network automation tools to have integrated network assurance capabilities that allow them to monitor and troubleshoot networks from within the automation tool. Best-in-class companies were more likely to prioritize these capabilities.
Finally, this visibility must be end-to-end, from the data center out to the network edge. EMA research found that 86% of technology pros believe it is important for data center network automation solutions to be integrated into end-to-end network automation, including the LAN and the WAN. Best-in-class companies were the most likely to say end-to-end extensibility is very important to their data center automation tool strategy. Not only should automation be extensible across the entire network, but the network source of truth should also be global and end-to-end. This will allow network administrators to understand how automated changes to the network can affect application performance, end-user experience, and network security.
If you want to read the full research report, download it here: The Future of Data Center Automation.
To find out more about how IP Fabric can accelerate your network automation journey, request a tailored demo with our team: Request a Demo.
One of the most challenging issues with a merger and acquisition, or preparing to sell your public IPv4 space, is ensuring the addresses and networks are cleaned from your environment. Using IP Fabric can remove many technical hurdles, because all your important networking information is in a single platform and accessible via a GUI and API.
I’ll be demonstrating reclaiming a 192.168.0.0/16 private space, but this methodology can be applied to any network you wish.
According to IPv4.Global, a trusted leader in the IPv4 resale marketplace, the January 2022 IPv4 Auction Sales Report had average prices ranging from $48-$54/address, an increase of over $20 per address compared to January 2021. If you were to sell IPv4 addresses at $50/address this could produce $200k for a /20, $800k for a /18, or $3M for a /16, which can easily cover the cost of your IP Fabric solution depending on the size of your network.
IP Fabric is a snapshot-based platform - it represents your network at a single point in time. The discovery process involves the application finding and logging into your network devices to collect information about how your network is configured. This is a fully automated system and uses information like CDP/LLDP neighbors, ARP, and routing tables to find other connected devices in your network. IP Fabric then crawls your network in this fashion until all neighbors have been tested.
One unique characteristic of IP Fabric is that it does not use SNMP to collect information, but rather retrieves data by either Telnet, SSH, or API calls. This provides a more robust collection of data compared to the limited information retrieved by SNMP alone.
For more information about the discovery process, please see How Discovery Works, Discovery Snapshot, and our Supported Vendors documentation.
Once discovery is completed and the snapshot is finished with calculations you can view detailed information about your network. Below is an example from a completed discovery:
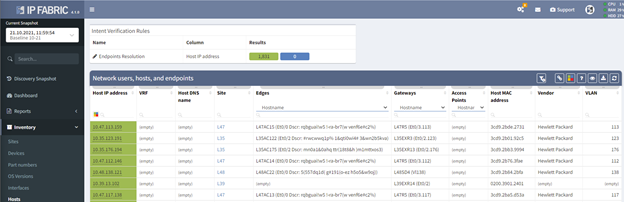
One of the data points we collect is a device's ARP table, which allows the application to display all the hosts connected to your networking devices. In most cases your hosts will not have public IPv4 addresses tied to them, but this is a great place to start your check. However, if you are reclaiming private IP space - like in this example - this will greatly reduce the time needed to audit your network.
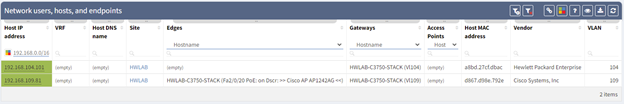
The Host IP Address column is filterable based on CIDR notation, and I have found two addresses that fall within our range. This table shows you valuable information such as the site, device and interface it is connected to, the gateway, MAC address, vendor, and VLAN information.
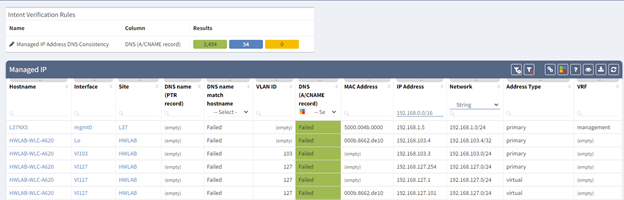
IP Fabric classifies IP addresses assigned to a network device as a "Managed IP" and not a host. This table can be found under Technology > Addressing > Managed IP. In the above example I have already applied our filter and we now have a list of devices and interfaces that would require a re-IP for a successful reclamation.
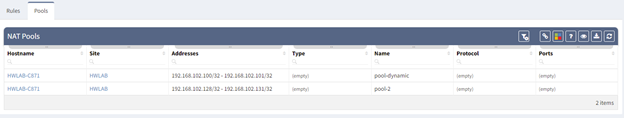
Also located under the Addressing Technology is information about your NAT Rules and Pools. In our environment, I have located two pools which both fall into our IP scope.
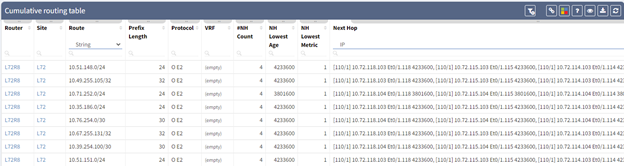
One of the most useful features of IP Fabric is that it collects all the routing table entries from all your devices and allows you to search your entire network without requiring a user to log into individual devices to query for this information.
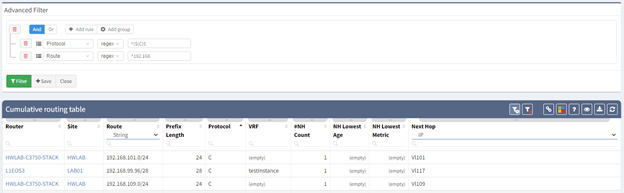
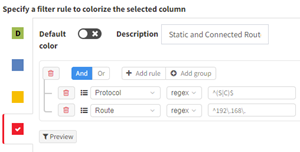
To narrow down our results, I have chosen to create an Advanced Filter. My first filter is a regex of ^(S|C)$ on the Protocol column which will display all the Connected and Static routes.
My second filter is another regex of ^192.168. to show all routes of interest. This works great for a /8, /16, or /24 networks but if you are trying to reclaim a network not on a classful boundary some post-processing might be easier for filtering your results. All the data in IP Fabric is available in both an API and CSV export.
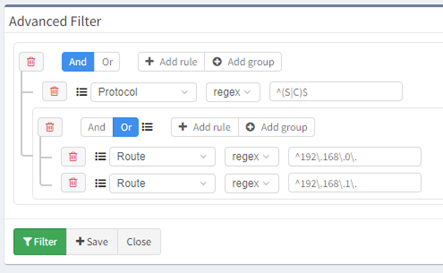
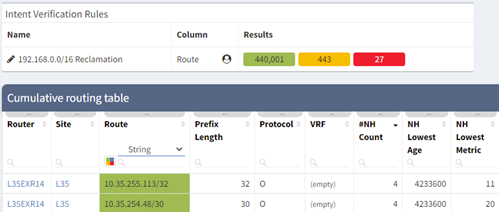
Filters can also be grouped so if you are reclaiming a /23 network this can easily be accomplished with a few more steps, as shown above. Filters can also be saved, but let's look at an Intent Verification rule which will make it easier to track your progress. Rules can be created on any technology table.
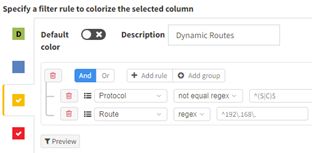
Once saved and applied you can easily track your reclamation efforts:
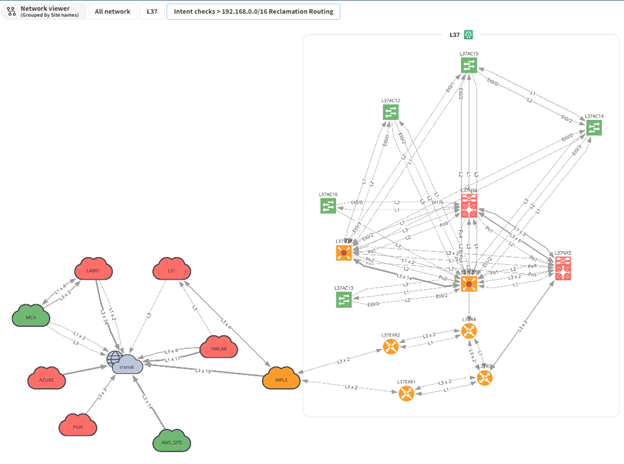
One of the best features of IP Fabric is its ability to take your network data and create topology diagrams. These are fully customizable where you can hide nodes and protocols, move items around, and save views for later use or export to a SVG or PNG. In the example above I have overlaid our intent rule which can give your team a great visual way to see where your networks are. I have opened one site (L37) which shows that 2 routers have a Static or Connected route for our 192.168.0.0/16 network. If you are interested in learning more about our diagraming, please take a look at our other blogs and YouTube channel.
Here are some other useful tables that can help narrow down where your IP addresses are located and how they are being used in your network. All of these can be located under the Technology menu.
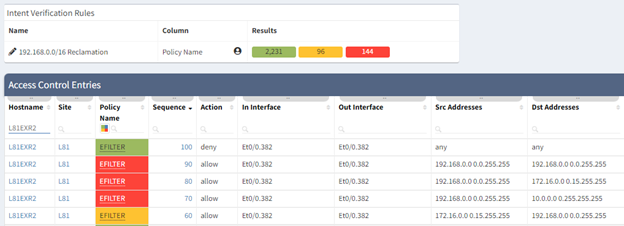
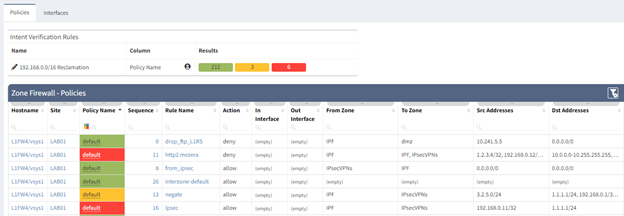
Once your IP space has been cleaned and removed from your network it can become a tedious task of checking your access lists and firewall policies. IP Fabric supports multiple vendors and platforms and extracts these policies into a security data model which you can then search without requiring the knowledge of vendor specific commands. Just like the Routing table you can also create intent rules using regular expressions to ensure your firewalls and ACL’s have been scrubbed once the space has been removed from the network. (Extra caution must be considered cleaning up Private IPv4 in security policies to keep your network protected; since our lab only contains private addressing, I have used this as an example instead of a public range.)
In the examples below I have created two Intent Rules in the Security > “Access lists” and “Zone Firewall”. These use the regex “^192\.168\.” to search for a match in any of the addresses in the Source (Red) or Destination (Yellow) Addresses. I used red for the source because if you sell the address to another company you want to ensure any open firewalls are closed to external IP’s.
Although IP Fabric is not a full IP Administration system it does collect information from your devices, as seen above, which can be used to discover the least utilized networks to sell. The Hosts, Managed IP, and Routing tables can be easily pulled via the API or the Python ipfabric SDK to programmatically do calculations against your public IP ranges. Our Systems Engineering team can help provide example scripts to accomplish this.
On the topic of utilization, perhaps your company needs to purchase new IPv4 space. Deploying IP Fabric and having several months of snapshot data could be used to satisfy justification requirements for transfers. According to ARIN’s Number Resource Policy Manual Section 8.5 “organizations may qualify for additional IPv4 address blocks by demonstrating 80% utilization of their currently allocated space” and “details the use of at least 50% of the requested IPv4 block size within 24 months.”
Thanks to its automated collection and its modelling of network behavior, IP Fabric gives you a single, regularly updated view of your entire network addressing. Whether you want to understand the relationships and overlaps between the networks of two merging organizations or are preparing to sell some public IPv4 address space, that visibility will save you time and money with minimal effort.
This is just one of the many use cases for our market-leading Network Assurance technology!
For more information about the product and its use cases, check out our website https://ipfabric.io/ and other blog posts available at https://ipfabric.io/blog/, or request a demo with our team who can show you how to implement IP Fabric in your network: Request a Demo.
Integrations between platforms and systems are essential to successful toolset management. It brings more value for both platforms that share data if done correctly. For my next integration journey for the IP Fabric, I chose one of the best tools on the market for log management - Splunk. I used Splunk extensively during my years in network operations. Its versatility for data visualization is fantastic. For example, I was detecting DDoS attacks and suspicious routing protocol flaps within areas, all while easily correlating with network changes. Let's break down how to successfully integrate IP Fabric with Splunk.
In general, there are two main types of integrations. The first is a one-way integration, where one system sends data to another. Here we use the power of the first platform (collect and manipulate data) to elevate the power of the second platform (ultimate data visualization). This is precisely what we will do to integrate IP Fabric with Splunk.
The second type is a two-way integration, where both systems use data from another and react. The second type requires either an intermediary system (or script) to create the integration logic, or both systems to be compatible.
A prerequisite for the data source (in our case, IP Fabric) is to have standard methods to read the data from the source. IP Fabric's API is brilliant for coders. It offers a full range of operations, and it's very well documented.
A prerequisite for the destination system (Splunk in our case) is understanding standard data formats - which Splunk is great for. With both conditions in place, let's start with the integration example.
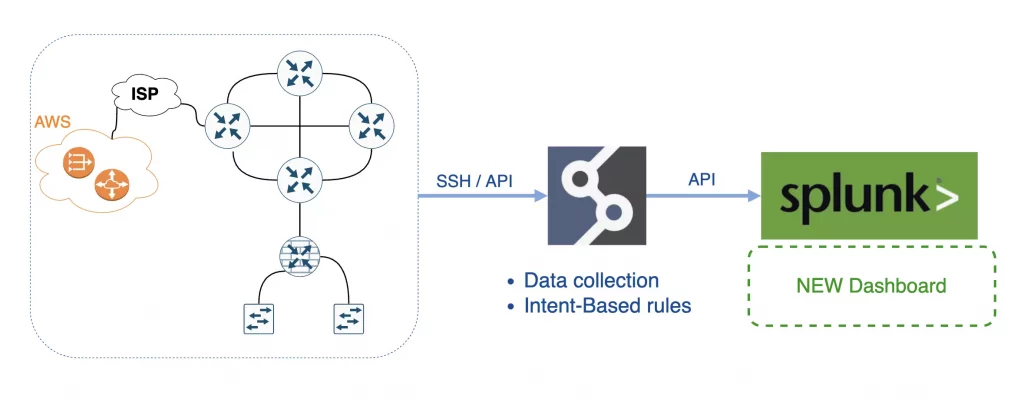
In short, IP Fabric is an Intent-Based Networking technology that serves as the foundation for network programmability, automation, and analytics by delivering critical information required to manage your network operations.
Splunk is the data platform that helps turn data into action for Observability, IT, Security, and more. And that's what we need.
I selected some of the essential metrics that IP Fabric regularly collects:
Then I included a couple of filtered data and intents:
Apart from the intent rules I picked from IP Fabric, 100 more default metrics provide valuable feedback from day 1.
First, I deployed IP Fabric, which took me about 30 mins to deploy on VMWare, and I could start the first discovery immediately! The goal was to regularly collect data from our virtual lab network (about 600 devices). The IP Fabric completed the first snapshot in about 18 minutes!
Second, I deployed Splunk with the developer license. I used a temporary license of the REST API Modular Input plugin to read the API data.
The next step was to configure Splunk to read IP Fabric's API. When I think about the whole integration, the only 'struggle' was to get proper API endpoints with the correct payload from the IP Fabric, which is no struggle at all! We have OpenAPI/Swagger available and dynamic API documentation on almost every page in the tool!
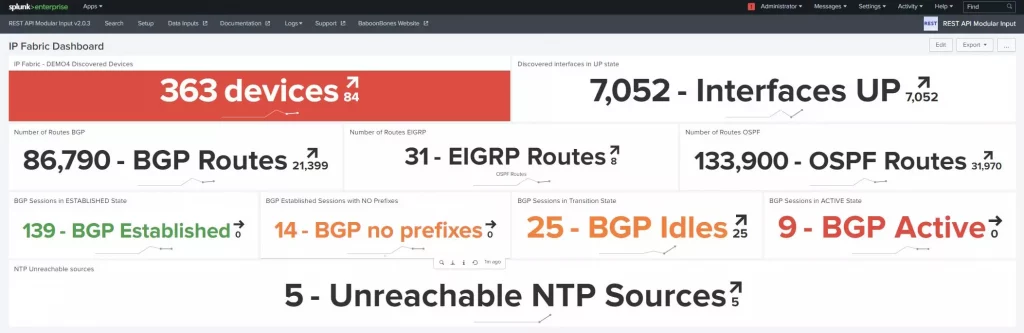
I created the Data Input in the REST API Modular Input plugin for each metric I needed to read in Splunk's GUI.
At the end of my journey, I created a new Dashboard in Splunk and combined all Data Inputs with more filters, for example:
Then I configured regular snapshots in IP Fabric and let Splunk create a trending line for each input in its dashboard.
Everything is about data. That's where the power is. With IP Fabric, everyone has a unique opportunity to access any operational data from the network they need quickly and accurately. The only actual limit is one's imagination.
The ultimate goal for any network or security engineer is to use available data efficiently to keep the network up and running and avoid the unexpected - and that's where the IP Fabric's involvements stand out.
Are looking for more technical details about how to integrate IP Fabric with Splunk? Please contact me directly on LinkedIn or Twitter, as I am more than happy to provide more guidance on my struggles.
If you have found this article helpful, please follow our company’s LinkedIn or Blog, where more content will be emerging on useful topics like the Splunk integration discussed here. If you would like to test our solution to see for yourself how IP Fabric can help you manage your network more effectively, please get in touch - schedule a demo with IP Fabric.
The IP Fabric platform is a very unique and innovative system. It ultimately combines traditional approaches and new ideas, which may generate further misconceptions or simply misunderstandings. After hours or possibly days spent with first-time users of the platform, I decided to explain the most frequent issues or questions raised during the proofs of concept and customer enablement sessions. And here they are.
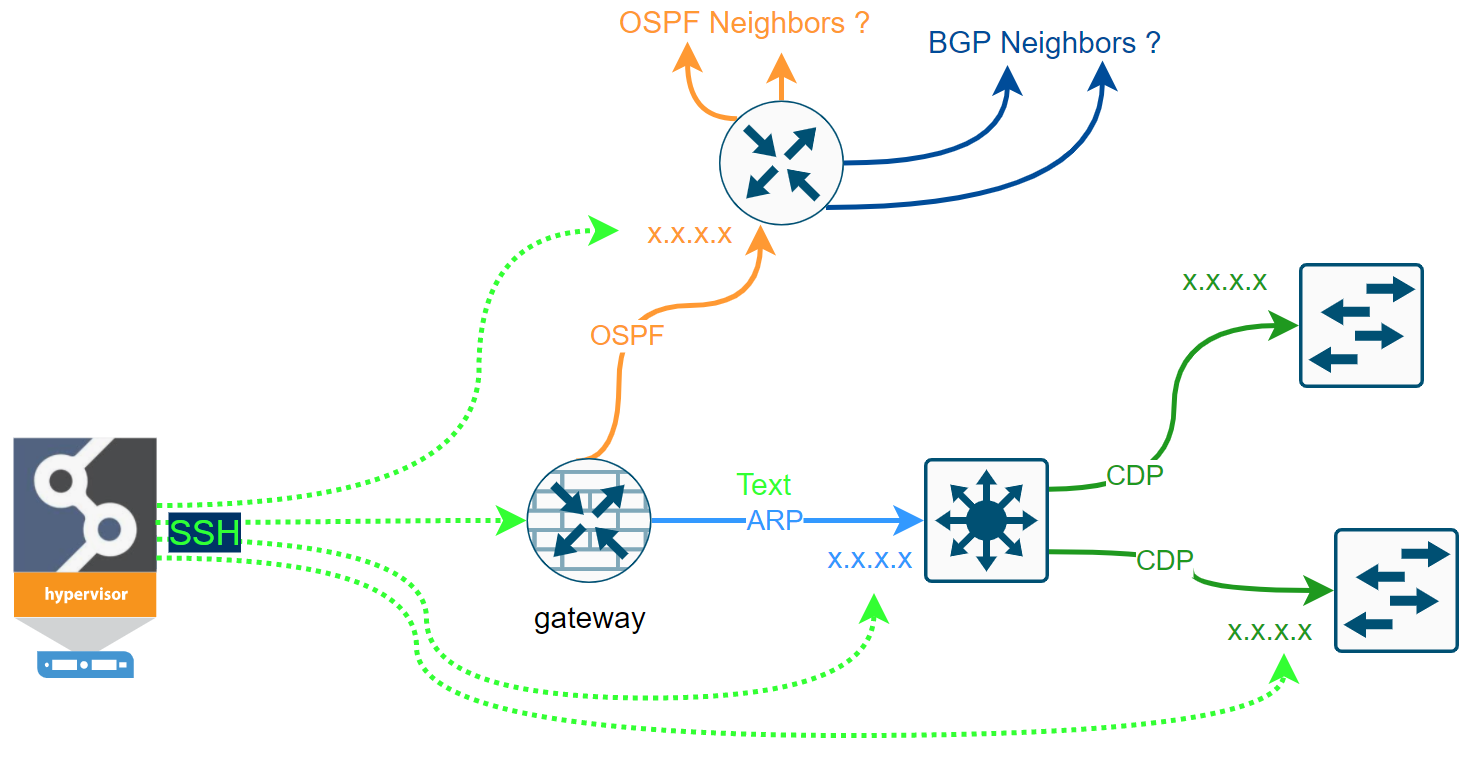
At first, let me discuss the IP Fabric's discovery process for a bit. We clearly cannot move forward until we touch on the core feature of the system, which the discovery process is. IP Fabric's discovery feature maps out the network infrastructure similarly as the network engineer would. What that means is that we only need credentials (or a set of credentials) and a seed device (router, l3 switch, or a firewall) to begin.
If we can log in successfully and read the data from the first device (ARP records, STP, CDP, LLDP, routing protocol sessions, or others), the system should have enough data to decide where to go next to repeat the process. For data gathering, the system only uses SSH (or Telnet) and API requests. The simplified discovery process can be seen in the flow chart below.
Some networks are more accessible than others. We may have issues with the first-time discovery of isolated network segments behind the router that we cannot authenticate to. But most of the first issues we can resolve by analyzing the logs and adjusting the discovery settings.
Once the discovery is complete, the admin can fully enjoy new data every day in the form of Snapshots automatically. Following video describes some of the use cases.
How is it possible that IP Fabric did not find anything? And that's an excellent question! Fortunately, this is very easy to troubleshoot. Here are viable reasons to think of:
There's Settings > Discovery Seed in the system, which is optional that appears during the Initial Configuration Wizard. However, if we don't provide any Seed IP, at first, the system will try to connect to its default gateway. If it fails to authenticate to its gateway, it will send a traceroute towards 'dummy' subnets hoping more IP hops will appear along the path as potentially the next starting points.
Now without any Seed IP configures (and without any previous snapshots available), and if IP Fabric fails to authenticate to its first gateway and when there are no other IP hops to test, there's nowhere to go next, and the discovery process stops.
To avoid this, I strongly recommend using at least one or two IP addresses of well-known devices that we safely authenticate to and can use as a starting point for discovering the rest of the network.
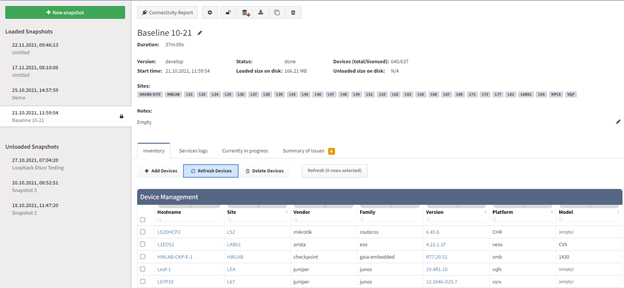
Now we provided the Seed IP correctly, we have the username and the password right, and we still don't have anything! How's that possible? Well, fortunately, that's easy to troubleshoot as well. Suppose we still do not have any devices discovered. We very likely couldn't authenticate or successfully initiate SSH connection to the Seed device, and we don't have any other IPs to test. Where to find the Connectivity Report for every snapshot is at following picture:
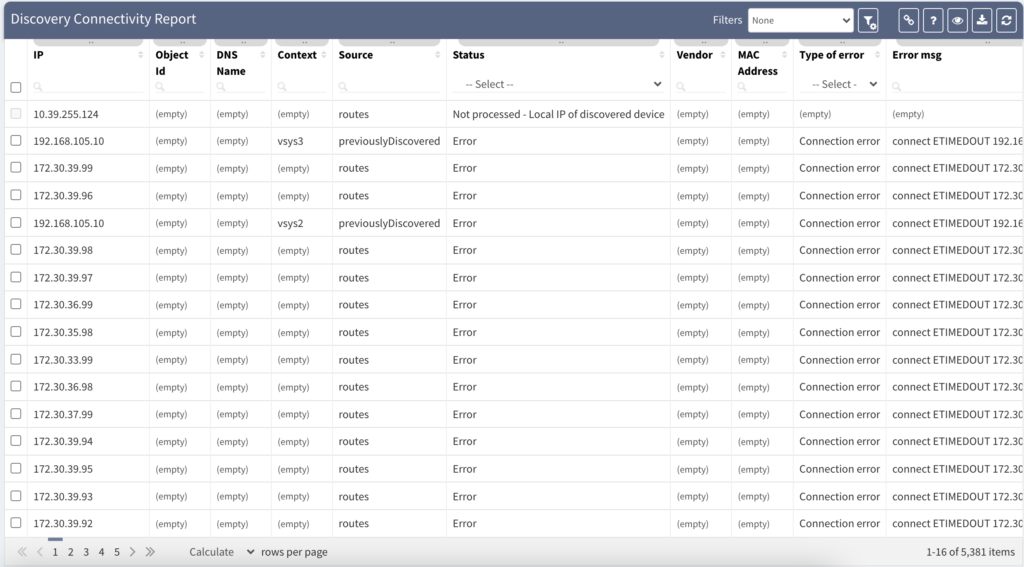
The platform is fully transparent. Every action, command, or testing is logged and available to the user. The best place to look at is the Connectivity Report. The Connectivity Report serves as a register for all outbound connections attempted with detailed data that either indicate success or failure.
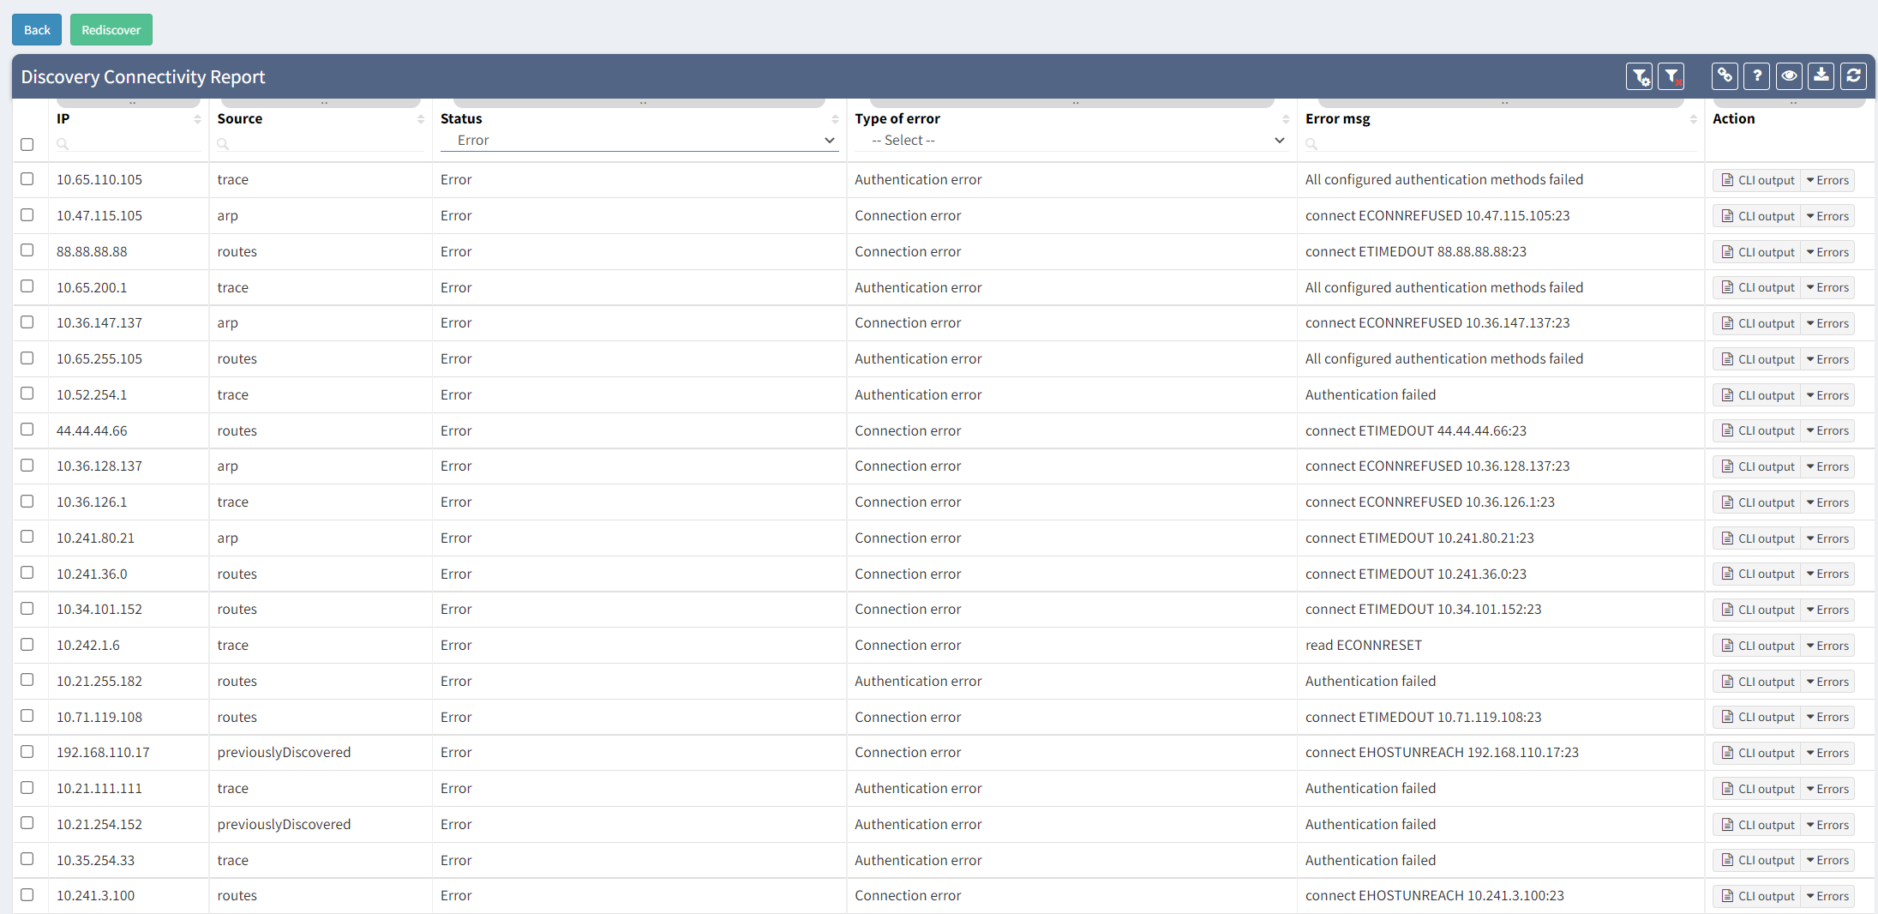
An example of the Connectivity Report output can be seen above. We can clearly observe which IP addresses were tested with an error and what was the main reason.
The most common issue during the first snapshots is the Connection Error or Authentication Error. The Connection Error indicates we were unable to initiate SSH/Telnet connection to the network device, and we didn't have any prompt for username and password. The main reasons are that we are either blocked by a firewall or by the device itself (Access-List or Firewall filter applied).
The Authentication Error indicates that we could initiate a connection and received the prompt for the username and the password. Still, our credentials are incorrect and need to be updated. We need to update our authentication database in Settings > Authentication and retest the discovery.
To successfully discover any network device and collect the data, we need to make sure that we understand the software. If it's IOS, Junos, or other operating-system among the most common – there are differences in operational commands used and, most notably, the responses provided. The IP Fabric platform has to be as accurate as possible and to ensure 100% accuracy. We need to support the vendor/platform or operating system that we ultimately ingest into our network model.
When IP Fabric successfully authenticates into an unsupported network device, it exits with failure after several attempts to detect any known operating system. The supported network vendor list is growing every release. If your current network equipment is not supported now, it doesn't necessarily mean it will not be in the future. Feel free to contact any IP Fabric representative for more information or request a trial.