NetMRI has reached end-of-support and you need a new way to discover and model your enterprise network. Take note - a new way, not a replacement discovery tool that gives you the same fractured view of your network that you've been clinging to as some illusion of network visibility.
While traditional network discovery tooling might have offered insight into specific domains or tech, the complex enterprise network of today demands more. Much more. We propose a vendor-neutral, end-to-end network discovery and modeling approach – automated network assurance - as a new approach to enterprise network management.
It is only with this end-to-end view and network-wide visibility that network teams can enjoy benefits like:
Your modern enterprise network spans on-prem and cloud, is vendor-diverse, and embraces software-defined networking technologies (and if you plan to maintain security, compliance, and connectivity requirements amidst increasing demands, you’ll continue seeking out new tech that helps your network support business growth). Your legacy tech sits beside these new innovations, creating an ever-changing, complex brownfield ecosystem to contend with.
So why are you afraid of losing end-to-end network visibility when you never really had it? Use this opportunity to break free of the devil you know - a fragmented view of disparate parts of your network - and embrace a network-level approach. Has your traditional discovery approach resolved the burning issue of siloed (and inaccurate) documentation? Solved cross-team friction? Given you the means to surface and codify tribal knowledge?
Your problem isn’t vendor-specific. Your problem isn’t domain-specific, or technology-specific, or device-specific. Your problem is a need to understand and validate network behavior, with a network-wide scope. So why would you limit your network discovery with a one-to-one replacement of NetMRI? Device-level solutions may solve an immediate compliance issue or connectivity issue, but they don’t solve a long-term reality issue. The reality is your network teams need more - they need an end-to-end network model to be effective.
They need an end-to-end view of your network that includes inventory, state, configuration, and topology information and allows you to run network-wide intent checks to ensure the whole network is operating as intended. It must be built with your tech ecosystem in mind, and support API calls to access and use this essential network data where needed. It must support your SDN projects and your multi-cloud instances. It must be efficient, scalable, and flexible enough to support and future-proof your network as it evolves.
It’s called an automated network assurance platform. IP Fabric.
Network documentation is a very complex and thorough topic - there are many guidelines, theories and even books that can help us with the process of creating and maintaining proper documents describing the network. The concept and execution may vary, but the purpose of the documentation should be unique - to represent the current state and settings of the network and all of the respective components. Let’s skip the document’s life cycle stages, like where to store the documents, how long the information should be stored for, how to track the changes etc., as there is much to cover on this topic. What is most important, is knowing what to document from a networking point of view, and how to represent the data.
Ideally, the network documentation should enable reconstructing the network from scratch. In case a change is being planned, state information is necessary to plan the change correctly. In the event that the active network device goes down due to an unforeseen event, it is crucial that the network can be reverted to its previous state. And if elements of a new network should incorporate elements from the network, being able to accurately document the corresponding detail levels is particularly important.
It goes without saying that the network engineer should be able to understand the documentation corresponding to their network without unnecessary complications. Being able to fetch the device list, understanding how they are interconnected and configured, and being able to verify all of this information is essential. Although the structure of the individual documents may vary, the common approach should be adhered to – describing the network based on the Open Systems Interconnection (OSI) model.
This chapter should cover the device list, including the hardware modules, the software versions, applied patches and other hardware/software details. Documenting the device location, rack plan and physical access details is optional. The core of this section is to document the physical cabling – interface names, transceiver and cable types. IP Fabric provides all information under the Inventory section – Device list, OS versions, List of interfaces with many details.

1 - Device Inventory
The second OSI layer describes the logical rather than physical connections. It means that segmentation can follow the physical cabling but it can extend the connection by using Virtual-LANs (VLANs), the port aggregation (EtherChannel, Port-Channel, Aggregated interfaces), different types of Spanning-Tree (STP) or use proprietary concept like Fabric Path etc. All this information are important to be able to understand how the network is functional from the logical point of view. If desired, it may document the logical settings of the devices like stacks - Virtual Switching System or Stack-Wise Virtual, VDC or vPC. The format of the documented data has to be carefully considered - there are plenty of methods such as network diagrams, tables, lists or configuration snippets.
IP Fabric collects lot of details and all the data are presented in a standardized and comprehensible way. Network diagram (per site) is showing protocol-level connections and technology section provides table overview of L2 specific topics.
2 - Network L1/L2/L3 diagram
Describing the network layer should be the most critical and most extensive aspect of the network documentation, as it should cover the elements such as:
IP addressing is a subject of a separate document and specific IP Address Management (IPAM) tool may be used (free or paid) - it should cover all the network subnets configured within the network. It depends on the capabilities of the IPAM to store all the details, but from the best practice approach it should list the network subnet, the configured IP address, device and interface name. Ideally, IPAM should track the history of the changes to see when and what changes have occurred. However, most of the tools available on the market require manual database maintenance.
Routing can be simplified using few static routes within one flat routing domain, but also can be very complex and structured by using several dynamic routing protocols like EIGRP, OSPF or BGP with complex redistribution on several places within the routing domain. Therefore, it should be documented to an appropriate detail level to in order to provide network behavior insight, and enable the possibility of building the website from network documentation alone.
IP Fabric excels in this area by collecting all the data mentioned above automatically, and more; IP addresses are listed in Managed IP overview and any IP can be verified against the device/interface name, including DNS name or other few additional settings. It can be also used as an initial input to the IPAM tool - just to export all the data to the CSV format and import the values to the IPAM. Collecting the list of IP addresses and IP networks is not the core of the IP addressing management - that’s only a list of values that are being used across the whole network. That said, proper comprehension and routine updates will serve the IPAM as needed.
The fourth layer of OSI model helps securing the traffic. The control plane security means securing the data needed to establish the network functionality - routing protocols, FHRP, device management etc. It should be covered in the appropriate part based on the control protocol, e.g. securing the dynamic routing protocol or FHRP should be covered in the previous chapter, securing the device management in the chapter covering the accessing the device (Telnet, SSH, SNMP) and so on.
Data plane filtering is the core of this section - it refers to the core concept of how the production data (user data) is being filtered, and should be documented first; it can then extend to the details and provide a very detailed view of the individual access-lists statements. Another concern is, how far need you dig into the details? It depends on the complexity of the implementation as well as the corresponding security policies that can limit the amount of information that may be presented.
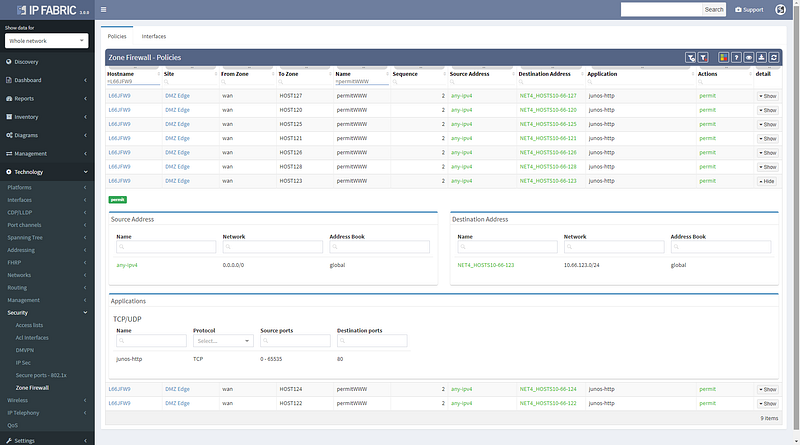
IP Fabric provides a coherent Access-List (ACL) overview, which also serves the ability to check the A-B path verification for specific traffic. Just enter the source and destination IP address in the network, then the traffic type - Internet Control Message Protocol (ICMP) or TCP/UDP and source/destination port in the second case.

3 - Vieving Access-Lists in the tolopolgy
The application layer is often excluded from the network documentation, but the process is changing and applications are more and more often a focal point of the new network principles and approaches. For this article and this chapter especially, the application layer description should include all the application we need to control, manage and monitor the network. Standard tools for device management are still Telnet/SSH with some corporate identity management (TACACS or Radius), and specific tools based on GUI front-end are more popular nowadays.
The network documentation process should incorporate the previous examples, but not be limited to them. There are many technologies, concepts, and network functions and it is very difficult to maintain an up-to-date overview of all such documents, especially when it comes to vast enterprise networks. Therefore, automating the process of collecting network data and subsequently creating the corresponding documents has proven to be a substantial advantage. IP Fabric eliminates the need for manual low-level design documentation; IP Fabric provides a detailed network overview for each business location, including topology visualization. Automatically generated, always available & up-to-date.
If you’re interested in learning more about how IP Fabric’s platform can help you with analytics or intended network behavior reporting, contact us through our website, request a demo, follow this blog or sign up for our webinars.
Transcript
Today we will go through a quick demonstration of the IP Fabric platform and its main features. The IP Fabric platform is the network management system that helps companies to empower network engineers and teams to discover, verify, and document large scale networks within minutes.
IP Fabric's lightning-quick processes intelligently discover over 3,000 network infrastructure nodes an hour and collect more than 2,000 configurational and operational state data per active network device.
The system then generates a digital model of the entire network with the switching/routing and security logic built-in. Since IP Fabric can identify both known and unknown devices, it eliminates the need for manual inventory processes in the company.
To initiate the IP Fabric platform successfully, it first needs to be installed on VMWare 5.0 or later and have an access to all infrastructure devices via SSH or Telnet with correct credentials.
Of course we can apply additional settings, such as IP subnets to include or exclude from discovery, limit the bandwidth or the number of concurrent sessions during and many other.
Once the discovery is finished we have a complete digital image of the entire network, which we call the snapshot. In every snapshot, we can run end to end path simulations, view all operational data about the network, analyze network topology maps or verify the network’s overal state with the Assurance Engine.
That is all for the introduction, now let’s get started with the demo.
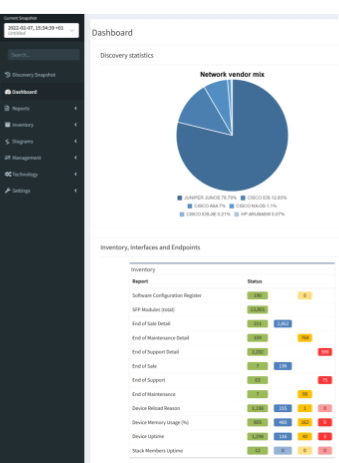
We are currently in the Snapshot management area. We have 4 snapshots loaded in the RAM memory and they are available to be explored immediately. Historical ones are stored on the Hard drive and can be loaded to RAM anytime. We can decide to add more devices to currently active snapshot or reinitiate discovery on selected devices and get the newest data.
We have the Connectivity Report which contains all IPs that the platform interacted with during discovery process, which is great for troubleshooting purposes and it underlines complete transparency that the user has when using the platform.
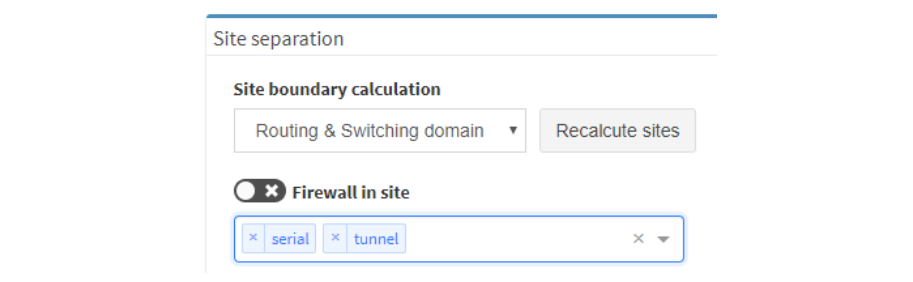
With our current snapshot, we discovered almost 600 devices and it took us about 10 minutes. We have the list of sites that serve as a logical groups for network devices. The user has full control over the Site Separation mechanism, sites can be based on devices’ location or function, it’s up to administrator to decide.
Now we will examine the inventories. We have full and very detailed visibility into all types of inventories: Devices, Interfaces, End-points or End-Of-Life milestones, which are very important for lifecycle management.
In any inventory or technplogy tables Sorting and Filtering tools are available. For example, in case I want to find all Juniper SRX devices within the inventory, I will fill in the vendor and the platform field and I have results available in seconds.
I can choose which parameters will be visible or change the columns’ order. Any filtered output is easily exportable to a CSV document and can be shared with the team. By the way, all search or filter functions available in graphical user interface are obtainable via API as well, with full documentation available online or in the platform.
MTU
Because the platform is the tool not only for viewing static data but also for analyzing behaviour of variety of protocols. Addressing any inconsistent states is very easy. As an example we can explore data for the Maximum Transmission Unit (or MTU) on all links just by few clicks.
I will search for an MTU, where we have all the information available. To discover any issues, we’ll just click on available verficiation and we have results in seconds.
Detecting inconsistent MTUs on all transit links in large scale networks can be a really time consuming to get, there can be tens of thousands links to verify.
After discovery, we only export the data and send it to operations team immediately. This type of proactive network management will help us to decrease the number of network issues in the future.
If we desire to have a visual representation of MTU results in diagrams, we will click on the site button and check for MTU in there.
OSPF
Similar applies if for any other supported technology. In the platform we can research routing and switching protocols, stacks, clusters, 802.1X, PoE, Quality of service and many many more. The IP Fabric platform is a search engine for any network.
As an example may be OSPF protocol.
We are very quickly seeing all OSPF sessions with all details on the network. By a single click we can tell if there are any sessions down or in transition state and use it for documentation purposes or for troubleshooting.
In addition we can go back in time, switch the snapshot and see historical results, which makes it an amazing tool for root cause analysis.
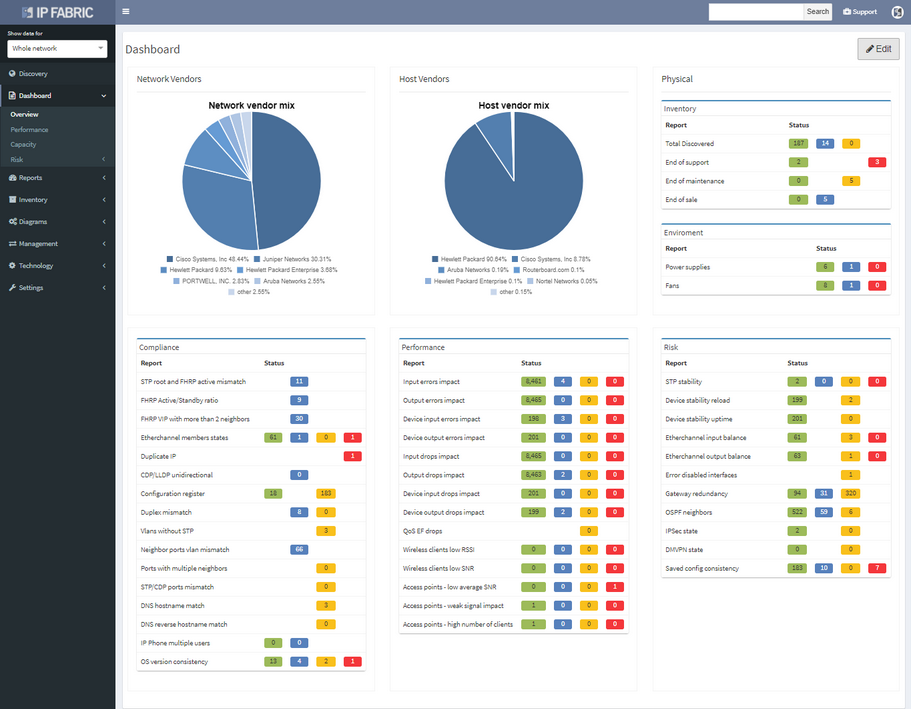
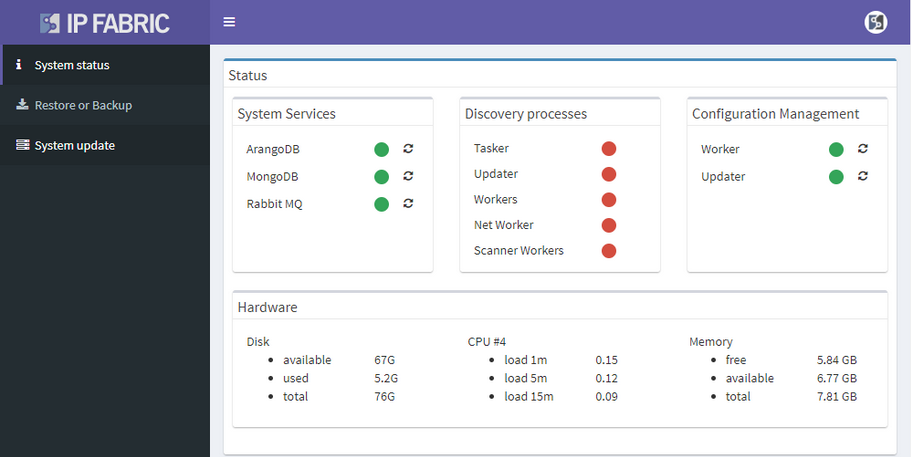
Assurance Dashboard
Last feature we would like to delve into, before we move on to diagrams, is the IP Fabric’s Assurance Dashboard, where all these verifications are displayed in one place.
IP Fabric is supplied with dozens of predefined network verification checks. These checks can be altered based on your needs, or you can create your custom ones very easily.
There are many focusing on Management protocols, Performance, Stability, Routing and Switching protocols, and we can go on..
All verifications are provided with explainers and all these results can be exported to the Network Analysis Report, which can be generated by the platfrom on demand.
Diagrams
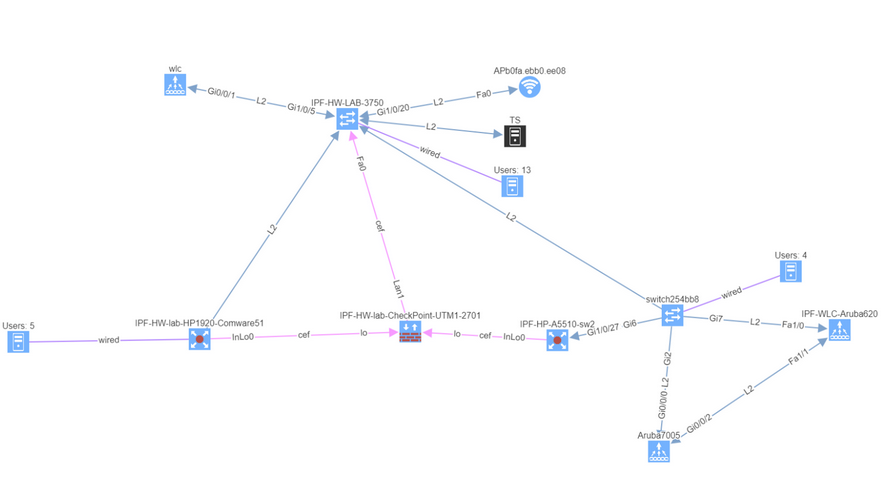
And now the Diagrams. With the IP Fabric, you have full and detailed visibility on a protocol level. There are not only physical links between devices in the topology maps but all relations between devices. If it's OSPF or BGP session, Spanning-Tree or discovery protocols.
All views and layouts can be easily modified or built from the scratch with the amazing View Builder feature. All available in a multivendor environment.
The network devices can be repositioned freely and the layout can be saved for future analysis. And the same diagram appears in the Low-Level design document, which can be also generated by the platform.
What we can quickly explore in terms of layers is Discovery protocols, which can be considered as physical layer mapping, Spanning-Tree or Mac layer and Routing protocols, all separately or together at once in a diagram.
In case we desire, for example, to track a single VLAN in the topology, we will click on any trunk link, select the VLAN number and immediately analyze which ports are in forwarding or blocking state for any particular VLAN or examine where the root bridge is.
The same we can do for any previous snapshot, we may go back in time and analyze any topology from the past!
Now a quick look at routing protocols. In the current topology, we have OSPF and BGP present, apart from that we support all mayor routing protocols including EIGRP, RIP, IS-IS or Label Distribution protocol from the MPLS environment.
By interacting with any link or node we get more detailed data, we can add the cost on OSPF links if we want to and export the topologies.
In addition we are able to visualize connected servers, IP phones or PC or wireless access-points if they are present. Then visualize QoS, Access-Lists or First Hop Redundancy protocols, detect single points of failure or non-redundant links.
End-to-End
Now we will move on to the E2E path testing. The End to End path testing can be essential for root cause analysis, verifying the post-migration state of selected application paths across the network or any ad-hoc testing related to client’s portion of the network. The IP Fabric platform enables seamless and extremenly fast path testing on the created mathematical model.
It takes literally seconds to complete standard end to end simulations for switching, routing and security portion. It is also possible to test end-to-end in MPLS networks based on labels.
So let’s test on our own:
With the path check feature, selected paths can be saved and continuously verified by the platform with every new discovery automatically.
Documentation
Maintaining network documentation may be a tedious and difficult process, that requires a vast amount of time. Which is the main reason why many companies are necessarily hiring external resources to complete the task.
To simplify the process, IP Fabric platform automates network documentation. There are currently two types of automated documents. The first one is the LLD document, which provides a detailed network overview for each business location, including topology visualization.
The second one is the Network Analysis Report, which will give you an overall report of your network, including network state checks.
If you’re interested in learning more about how IP Fabric’s platform can help you with analytics or intended network behavior reporting, contact us through our website, request a demo, follow this blog or sign up for our webinars.
As networks become increasingly complex, the job of network administrators becomes more and more demanding. To understand the sheer amount of effort that the role takes, you only have to look at the task of analyzing the enormous amounts to status information within a network.
With the methods that most organizations are using, analyzing network status, preventing link capacity and node overloads, and having enough information to take immediate action within your network is virtually impossible.
If network admins were able to harness the power of network visualization and dynamic network mapping regularly, instead of it being a long, laborious process that takes months to create, they’d suddenly be able to visualize the relationships between network elements and have an accurate representation of the network’s graph structure.
Network visualization helps clarify and define the relationships between network nodes and the links between them and displays them either as an online (live) diagram or an offline diagram.
When dealing with network visualization, several rules need to be considered.
For this example, we’re going to use seven rules from Eugen Goldstein, the German physicist that is often credited with the discovery of the proton, and apply them to network visualization software.
Also, as another example, other basic rules which can be good to consider, are:
These rules were given by Ben Shneiderman (an American computer scientist).
Network visualization helps users connect the dots more quickly than just staring at a spreadsheet of data. With visualization, reports can be more straightforward and can be far more effective. These easy to follow reports provide network engineers the intelligence for monitoring, troubleshooting and gathering reports of the network, which helps them to analyze and understand the status of their networks nodes, links, and more.
Network visualization tools can also help network security engineers handle security issues and more easily observe the status of their systems.
The monitoring software helps network engineers visualize the patterns within their complexed network, which enables them to troubleshoot issues and make informed decisions much more quickly, minimizing downtime during outages. Visualizations can be used in offline mode, giving you the flexibility to view a static picture, or online mode, which lets you see changes as they’re discovered in real-time.
If they were armed with network visualizations, admins would soon find that troubleshooting, assessing, and planning out their networks would be a piece of cake! Unfortunately, features like these go far beyond what any legacy network tools are able to provide.
That’s where IP Fabric comes in.
IP Fabric’s platform uses visualization to provide users with detailed tech visibility and drill-downs on dynamic network maps. The system visualizes individual technology and protocols, which enables network engineers to plan changes, troubleshoot connectivity issues, and document the network.
Mapping out and verifying end-to-end paths, from switching through balancing to firewall and cluster policies, enables network engineers to troubleshoot issues much quicker, and to communicate with other engineers about the network.
Using visualization, IP Fabric maps out complete active network paths between any two endpoints. The map shows you the routing and switching forwarding decisions, including the results of all of the security decisions of all active path filters for the specific source-destination pair.
End to end path mapping
As a network engineer, it’s incredibly important to be able to see your site-to-site connectivity or your individual sites, including all of your managed and unmanaged devices (including wired/wireless users, or IP phones). IP Fabric visualizes the details of individual protocols or aggregate links and topologies into a representative view.
IP Fabric helps you delve into active QoS, applied Access Control Lists, or transmission issues on any of the diagrams. Use the platform to verify links and device redundancy, or visually analyze specific protocol topology.
Try IP Fabric for yourself and see just how useful network visualization and network dynamic diagrams can really be.
Today, we are pleased to release the new version 2.3.0 of IP Fabric platform. This release assists engineers in having a more complete overview of their network by adding support for additional technologies that are especially seen in Internet Service Provider and enterprise Internet Edge environments — Multiprotocol Label Switching (MPLS), Port Mirroring and Network Address Translation (NAT). We have again improved usability of graphs, that now support site renaming directly in graphs and also support visual separation of site interconnects from the general transit clouds.
Frequent feature request from Internet Service Providers and Enterprise customers as well was Multiprotocol Label Switching (MPLS) support. In this release we are adding full support for Label Distribution Protocol (LDP), where we provide the network operator with detail about configured interfaces and what are the LDP neighbor relations, and we also provide with global network MPLS Forwarding Table that is very similar in function to a global routing table we have already. The MPLS is of course supported in graphs as well.
Network Address Translation is pretty common in the enterprise Internet Edge service block and particularly in ISP networks to “sort out” their IPv4 address exhaustion issue. Today we are releasing support for Network Address Translation rules, to give you full End-to-End visibility and packet behaviour.

To support traffic recording efforts of our clients we are introducing support for port mirroring overview and configuration verification. Regardless if the technology used is Switched Port Analyzer (SPAN), RSPAN (Remote SPAN) or ERSPAN (Encapsulated Remote SPAN), we are supporting the overview tables including all the low level details like ACLs applied to the monitoring session or QoS used for the mirrored traffic.
The graphs are definitely one of the most used functionalities of our product. Many of our clients inquired for the functionality to be able to rename sites in easier way and we are now supporting renaming of site directly in the site diagram.
To get better overview about how the specific sites are interconnected, we are now introducing the separated transits for other sites in the diagrams. This way you will be able to find out what is connected to what much faster than before.
When the graph is opened through the hostname link in any table, it will zoom automatically to that specific device.
There are couple vendors out there that are using for their devices Organizationally Unique Identifier (first half of MAC address specific to vendor) that are belonging to other companies. This was causing issues during device discovery as our platform is connecting to well-known vendor OUIs, because we don’t want to log onto everything in the network, but just the network devices. However if you happen to have a device with special OUI portion in its MAC address, this is no longer an issue and you can override the default behaviour and select the MAC addresses, that are relevant to your environment.
We have worked hard on improvements in datacenter portfolio, where we improved support for Cisco Nexus Fabric Extenders (FEX) modules and their environmental parameters. For the memory hungry devices we have added a support for memory consumption overview — this can be used to verify if your network will support further IPv4 BGP routing table growth or it is running already at its' limits.
If you’re interested in learning more about how IP Fabric’s platform can help you with analytics or intended network behavior reporting, contact us through our website, request a demo, follow this blog or sign up for our webinars.
Today, we are delighted to release the new version 2.2.9 of IP Fabric platform. This release assists engineers in having a more complete overview of their network by adding support for additional vendors, such as Arista, HP Aruba, Huawei and F5 loadbalancers. It also provides support for new routing protocol IS-IS and improves End-to-end Path Lookup, which is now more intuitive — we now allow you to save and continuously verify specific path forwarding results, as well as display them on the dashboard.
E2E Path Lookup is one of the most useful features of our platform, allowing you to test and visualize the forwarding of the packet through the network. This will allow you to verify if the traffic is being forwarded as it is intended. Many of you have inquired regarding the possibility to be able to continuously verify specific traffic patterns, such as reachability of the CRM systems from branches. The verification now also extends to verifying if forward and return traffic are symmetric and if the traffic is being flooded somewhere within the network.
In order to receive the detailed information more efficiently regarding End to End path forwarding decision, we have implemented a new tab, which aggregates all the information found during the examining of the specific packet flow.
There are situations when you may wish to only see the edge devices, whether it be for troubleshooting or to see how the WAN works without distractions from the LAN devices and links. Therefore, we are introducing a function that allows for this.
As a committed vendor independent software company, we are always working towards implementing additional support for more widespread networking equipment, so that our software may analyze and verify any network. Therefore, we are providing discovery support for Arista, Hewlett-Packard Aruba, and Huawei networking equipment and loadbalancers from F5.
While we support general routing verifications regardless of the protocol or the route source, with version 2.2.8 we have expanded detailed routing protocol support and added EIGRP and RIP. Today, we are proud to announce that our platform supports all of the most important routing protocols, as we have implemented IS-IS.
Last but not least, based on the feedback that we have received, we have decided to add DNS resolve support for the Discovery Error reports, making it far easier to identify the devices that have not been properly discovered. We are also adding a graphical historical overview of the number of discovered devices.
If you’re interested in learning more about how IP Fabric’s platform can help you with analytics or intended network behavior reporting, contact us through our website, request a demo, follow this blog or sign up for our webinars.
Today, we are delighted to announce a new feature loaded release 2.2.8 of our IP Fabric Network Infrastructure Management Platform — Engineering Edition. This release is full of new exciting features and improvements, ranging from a new routing protocol support — EIGRP and RIP, through additional technology verification for Authentication, Authorization, and Accounting (AAA) to improvements for the existing tables and verification checks. We have listened to your feedback closely and implemented major improvements for the diagrams, so that you can display more information both visually and in the related popup windows.
Many of you have asked for ability to display additional information directly in the diagrams and we are delivering it today. Now you can display or hide additional network detail without going to the Technology Tables.
There is a number of options to display detailed information for various layers and technologies:
These new options, however, created an issue — the diagrams became overloaded with information. Therefore, we created a new straight link style that works better than the default Bezier curves, especially if you need to display more details on multiple parallel links.
Rethinking link style calculation proved very popular, because straight links can represent more information more clearly, especially when displaying multiple paths or protocols.
One of the awesome features of IP Fabric is its End to End path lookup. It allows you to test whether the traffic will be allowed through the whole infrastructure or not and why. However, in complex networks it was not very easy to find what is wrong with the path as there were only arrows to signify the resulting decision, and no clear indication of the problematic devices. To improve visual interpretation of the path lookup result we implemented highlighting of the devices which are causing a problem or are prohibiting traffic to pass, be it either because of ACL, Zone Based Firewall, Routing or Switching. Forwarding verification result has also been added to the device popup windows to provide detail from routing and switching perspective.
The path lookup is truly end to end, meaning we do not stop at the first device denying the traffic but finish the path simulation, so that we can highlight all the issues on that particular path.
This enables you to prepare all the necessary changes at once, instead of moving hop by hop.
IP Fabric now provides detailed information about configured Authentication, Authorization and Accounting (AAA) servers, policies and how they are applied through your network infrastructure. This can be used for validation that all devices are hardened properly, that the users logging in are being properly authenticated and authorized, and that all their activities on the device are logged and accounted for.
This is an example of how intent-based verification is much more robust than text-based golden config checks. With IP Fabric's platform you can ensure that general AAA rules are followed throughout your network, and that operational state complies with your intent of how the network is supposed to operate, regardless what OS device is running or if the device is HP, Juniper or Cisco.
While we support general routing verifications regardless of the protocol or the route source, with 2.2.8 we’re expanding detailed routing protocol support from BGP and OSPF to EIGRP and RIP. As always, the data is presented in the structured technology tables, the knowledge base, as well as in Diagrams.
BGP support was also improved, providing out-of-the box information about internal and external peering as well as details on BGP session uptime. This is very helpful for troubleshooting flapping or recently converged BGP sessions.
Last but not least, based on the feedback, we improved out-of-the-box verification reports to be more accurate and useful. In addition, we added DNS resolve support for the Connectivity report, which makes it easier identify the devices that have not been discovered properly.
If you’re interested in learning more about how IP Fabric’s platform can help you with analytics or intended network behavior reporting, contact us through our website, request a demo, follow this blog or sign up for our webinars.
If a user reports that a certain application is not working for them, especially after a migration or a change, how do you verify the connectivity?
Finding a path in a complex network can be hard enough by itself, having to map active switching and routing forwarding and balancing decisions, but additionally mapping security decisions of all the L2 and L3 filters take days if the network is complex enough, especially if multiple Zone Based firewall clusters are involved.
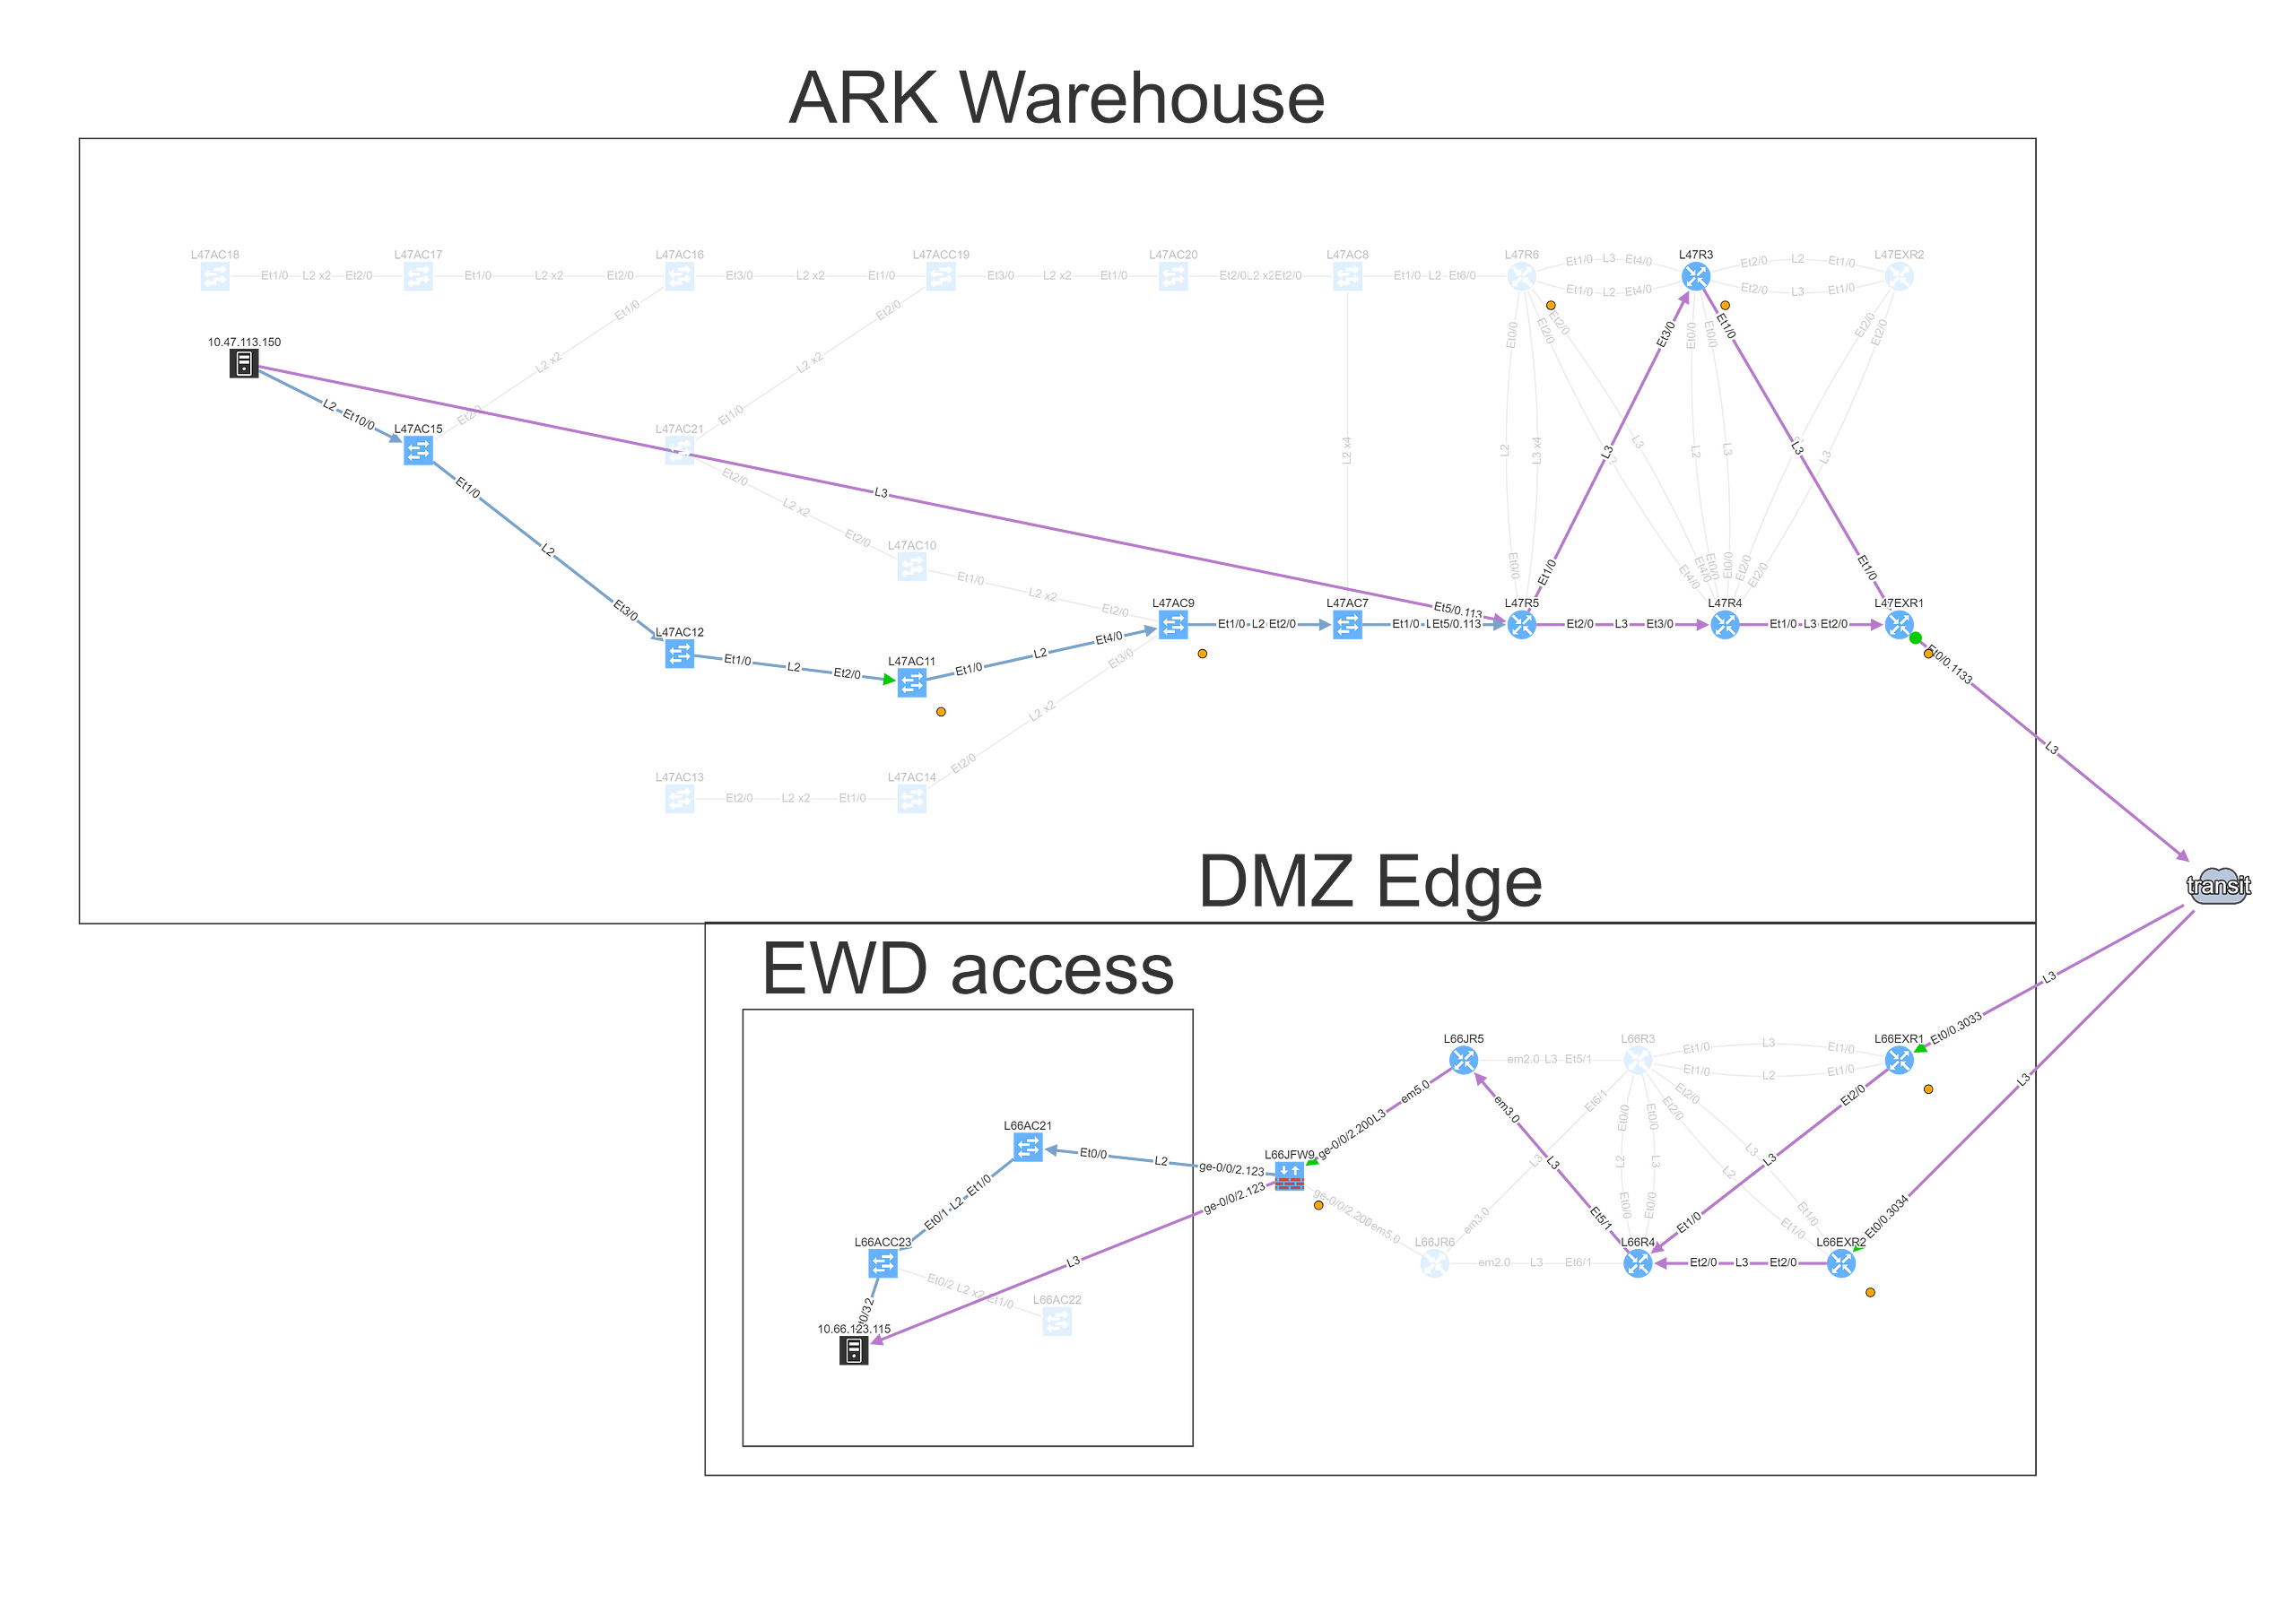
In this example we’ll see how IP Fabric can help you with a migration of a warehouse telemetry app that is publishing data from sensors to the secured servers from one port to another, verifying all forwarding parameters of end to end connectivity.
We can find the telemetry endpoints by looking at the network map of the warehouse.
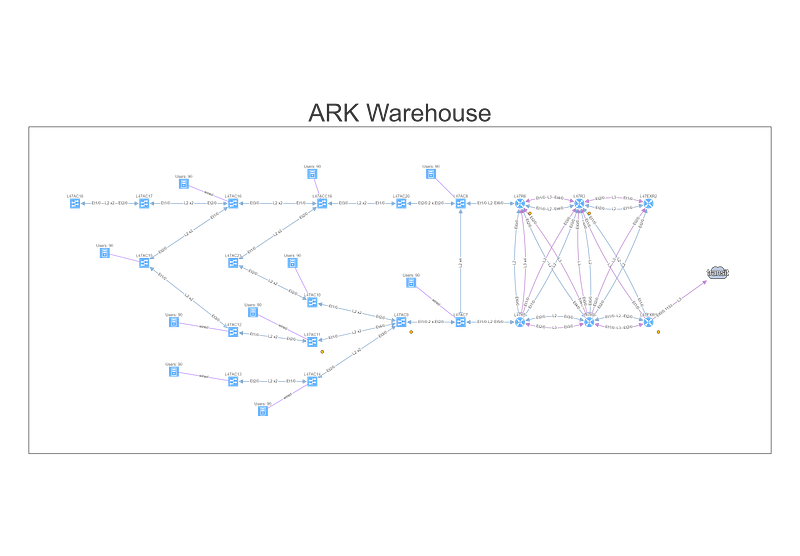
To understand topology better we can see where the site is connected to the transit, group forwarding topology into layer 3 and layer 2 islands, and then finding a specific endpoint connected to a switch that is far from the site’s edge, and using it in the End to End path lookup dialog window.
Alternatively, we can simply type part of the DNS name or an address, and find endpoint that way, which we’ll do for the server.
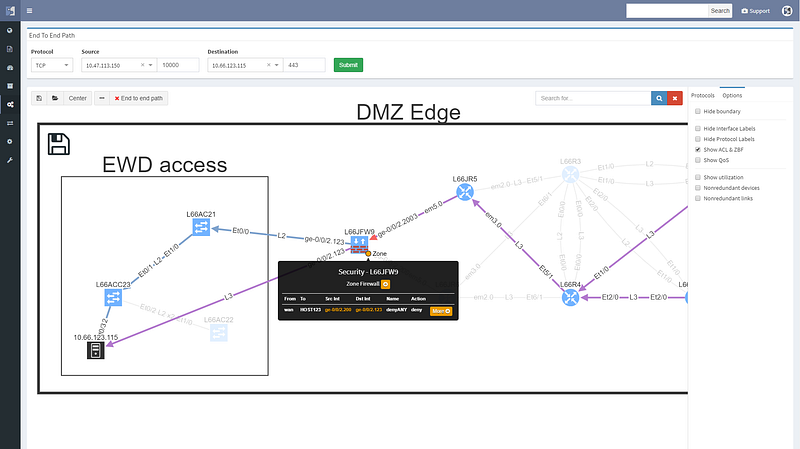
Looking at the path reveals a number of balancing and filtering decisions of interest, including layer 2 filters, wan edge filters, missing path redundancy within the site, and the filter on the Zone based firewall cluster.
We can see that this particular flow would be allowed signified by the green arrow, and the matching decision at every point can be drilled down to reveal the detail of the policy.
Changing the port to 443 reveals that this traffic would not be allowed, and connectivity would not be possible, so policy on the firewall will need to be updated for the migration.
We can save path lookup result to refer to later or share with the team, and export the image for reporting purposes.
If you’re interested in learning more about how IP Fabric’s platform can help you with analytics or intended network behavior reporting, contact us through our website, request a demo, follow this blog or sign up for our webinars.
Enterprise networks should never have Single Points of Failure (a.k.a SPOF) in their daily operation. SPOF in general is an element in a system which, if stopped, causes the whole system to stop.
Single failure (or maintenance or misconfiguration) of any network device or link should never put a network down and require manual intervention. Network architects know this rule and design the networks like that — placing redundant/backup devices and links which can take over all functions if the primary device/link fails.
But the reality is not always pleasant, and today’s operational networks can include SPOFs without anyone explicitly knowing. The reason is that even though the original design put all SPOFs away, the network may have evolved in the meantime, and new infrastructure may have been connected to it.
For example:
Part of the network operation activities should take into account that SPOFs may appear unexpectedly. This require advanced skills and lot of time to go trough routine settings and outputs if the networks is still resilient and high available. It also requires expensive disaster-recovery exercises to be performed regularly.
IP Fabric helps with finding of non-redundant links and devices in the network in its diagrams section.
It does not matter if the SPOF is Layer 2 switch or Layer 3 router — those are all in the critical chain of application uptime. Device and links which form SPOF will be highlighted.
Additionally, networks with many small sites have automatic grouping of small sites into redundant and non-redundant groups in IP Fabric. Groups allow to easily spot sites with non-redundant transit connectivity.
If you’re interested in learning more about how IP Fabric’s platform can help you with analytics or intended network behavior reporting, contact us through our website, request a demo, follow this blog or sign up for our webinars.
I’m pleased to announce the release of IP Fabric® Platform 2.2. Continuing our mission of delivering more capabilities into the hands of the network engineers, this major release exposes all predefined verification checks and enables to edit them or to define your own. Each technology verification can also be added to the dashboard, which is now fully customizable.
We’ve also revamped our diagrams to handle much larger scale, visualizing thousands of network devices and links on modest client hardware, and added many visualization options.
Version 2.2. also adds support for Junipers routers, switches, and firewalls, and base support for Fortinet FortiGate and Palo Alto.
We also haven’t forgotten about improving system administration, and this release has added options for encrypted backups and automatic updates.
There were many other smaller enhancements such as the ability to recalculate site boundaries without running discovery, and the ability to use multiple nested regular expressions to separate sites based on the naming convention. I especially like that site recalculation also recreates all of the documentation according to the new separation rules, so even historical documentation can be updated.
As always, if you’re interested to know more, you can always drop me a line or request a demo or trial.


