The IP Fabric platform is a very unique and innovative system. It ultimately combines traditional approaches and new ideas, which may generate further misconceptions or simply misunderstandings. After hours or possibly days spent with first-time users of the platform, I decided to explain the most frequent issues or questions raised during the proofs of concept and customer enablement sessions. And here they are.
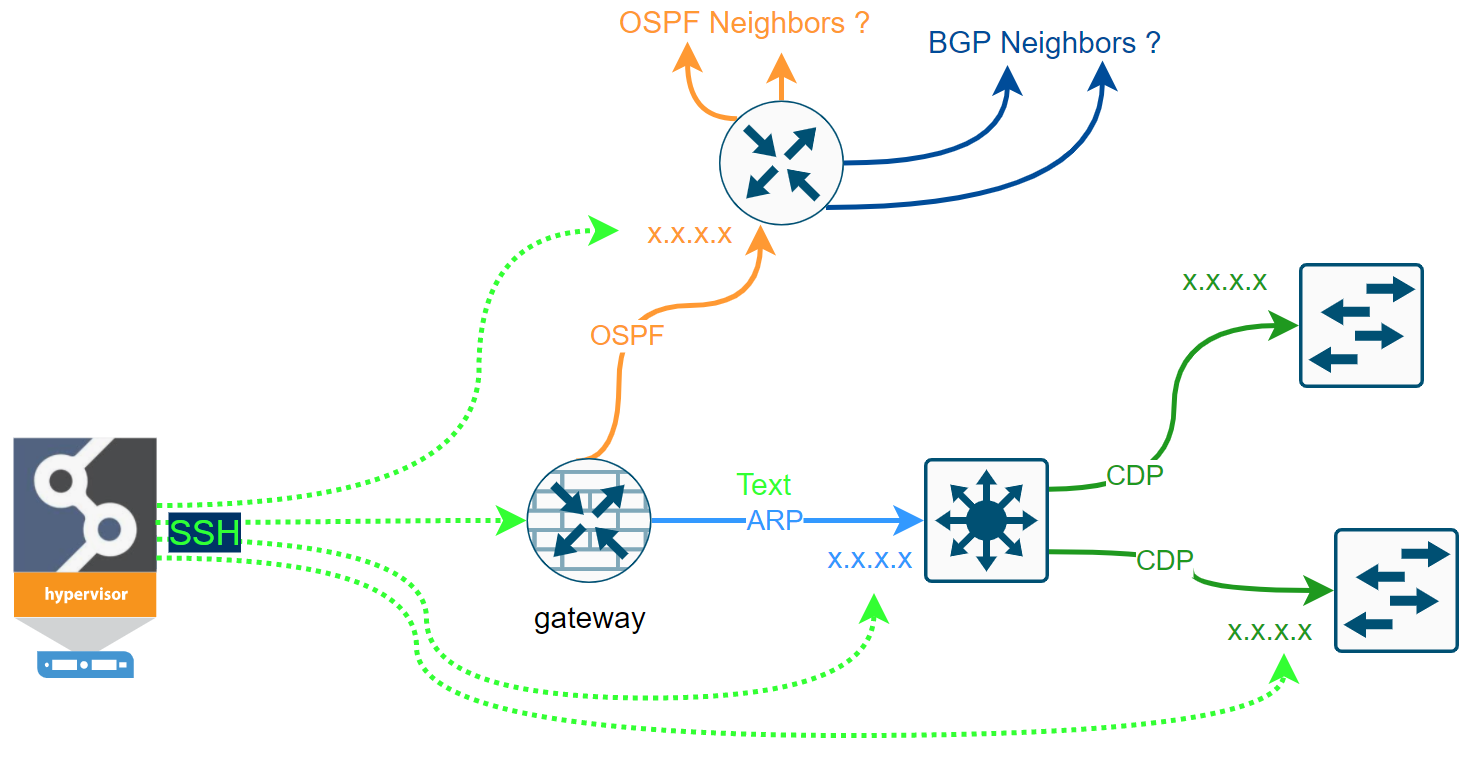
At first, let me discuss the IP Fabric's discovery process for a bit. We clearly cannot move forward until we touch on the core feature of the system, which the discovery process is. IP Fabric's discovery feature maps out the network infrastructure similarly as the network engineer would. What that means is that we only need credentials (or a set of credentials) and a seed device (router, l3 switch, or a firewall) to begin.
If we can log in successfully and read the data from the first device (ARP records, STP, CDP, LLDP, routing protocol sessions, or others), the system should have enough data to decide where to go next to repeat the process. For data gathering, the system only uses SSH (or Telnet) and API requests. The simplified discovery process can be seen in the flow chart below.
Some networks are more accessible than others. We may have issues with the first-time discovery of isolated network segments behind the router that we cannot authenticate to. But most of the first issues we can resolve by analyzing the logs and adjusting the discovery settings.
Once the discovery is complete, the admin can fully enjoy new data every day in the form of Snapshots automatically. Following video describes some of the use cases.
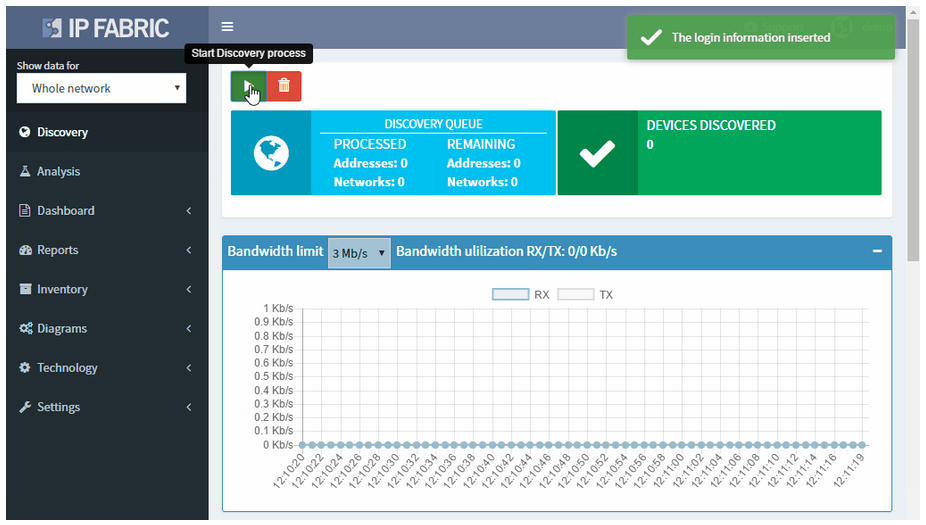
How is it possible that IP Fabric did not find anything? And that's an excellent question! Fortunately, this is very easy to troubleshoot. Here are viable reasons to think of:
There's Settings > Discovery Seed in the system, which is optional that appears during the Initial Configuration Wizard. However, if we don't provide any Seed IP, at first, the system will try to connect to its default gateway. If it fails to authenticate to its gateway, it will send a traceroute towards 'dummy' subnets hoping more IP hops will appear along the path as potentially the next starting points.
Now without any Seed IP configures (and without any previous snapshots available), and if IP Fabric fails to authenticate to its first gateway and when there are no other IP hops to test, there's nowhere to go next, and the discovery process stops.
To avoid this, I strongly recommend using at least one or two IP addresses of well-known devices that we safely authenticate to and can use as a starting point for discovering the rest of the network.
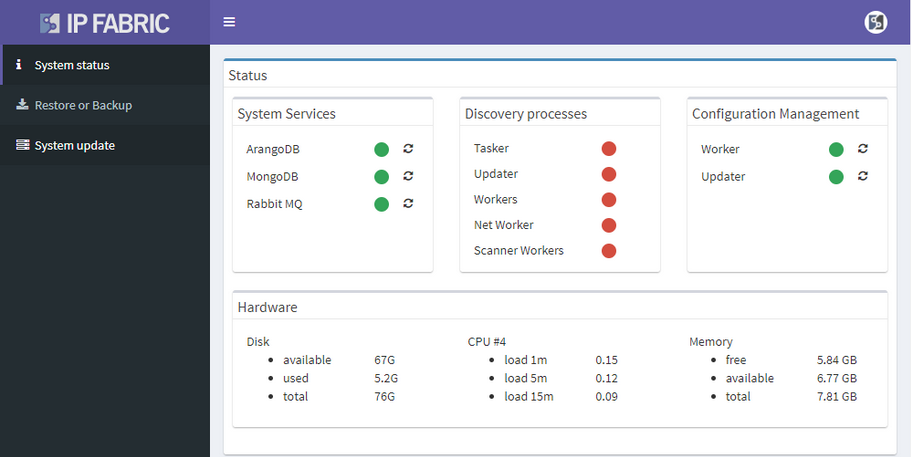
Now we provided the Seed IP correctly, we have the username and the password right, and we still don't have anything! How's that possible? Well, fortunately, that's easy to troubleshoot as well. Suppose we still do not have any devices discovered. We very likely couldn't authenticate or successfully initiate SSH connection to the Seed device, and we don't have any other IPs to test. Where to find the Connectivity Report for every snapshot is at following picture:
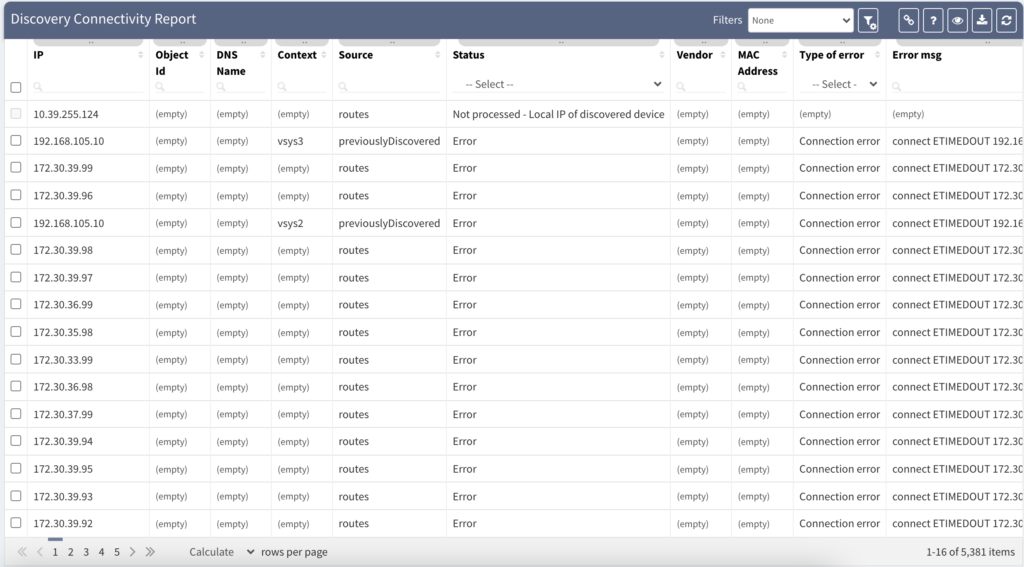
The platform is fully transparent. Every action, command, or testing is logged and available to the user. The best place to look at is the Connectivity Report. The Connectivity Report serves as a register for all outbound connections attempted with detailed data that either indicate success or failure.
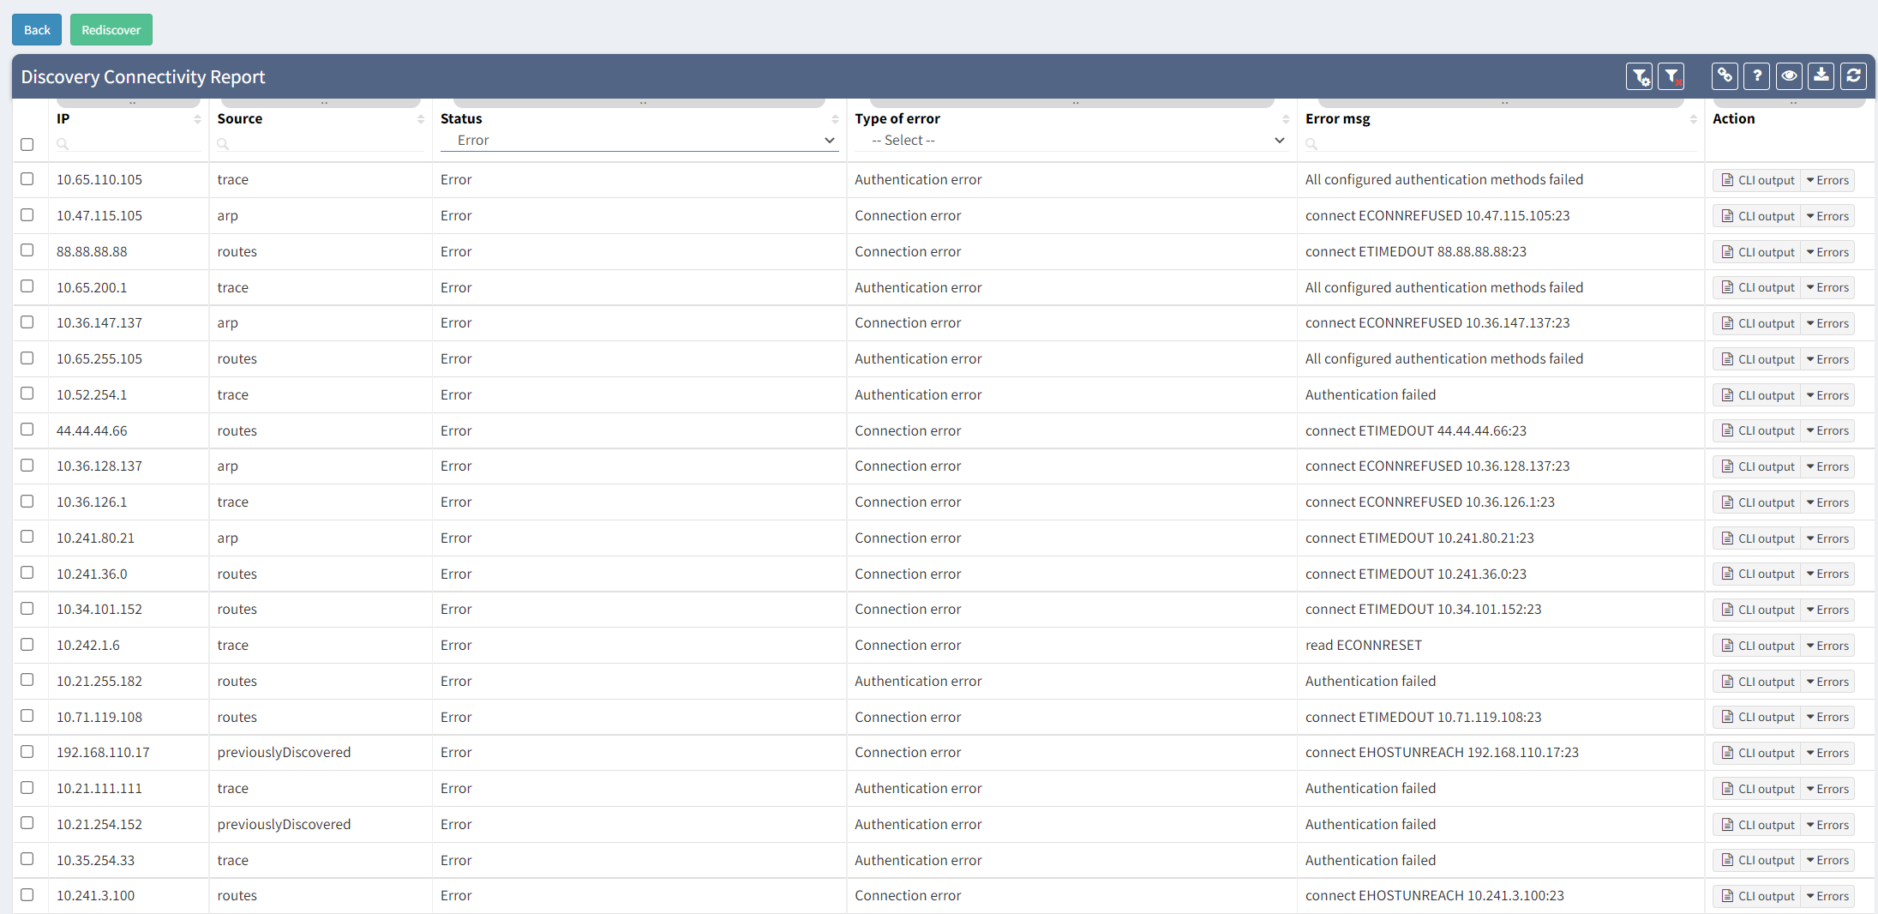
An example of the Connectivity Report output can be seen above. We can clearly observe which IP addresses were tested with an error and what was the main reason.
The most common issue during the first snapshots is the Connection Error or Authentication Error. The Connection Error indicates we were unable to initiate SSH/Telnet connection to the network device, and we didn't have any prompt for username and password. The main reasons are that we are either blocked by a firewall or by the device itself (Access-List or Firewall filter applied).
The Authentication Error indicates that we could initiate a connection and received the prompt for the username and the password. Still, our credentials are incorrect and need to be updated. We need to update our authentication database in Settings > Authentication and retest the discovery.
To successfully discover any network device and collect the data, we need to make sure that we understand the software. If it's IOS, Junos, or other operating-system among the most common – there are differences in operational commands used and, most notably, the responses provided. The IP Fabric platform has to be as accurate as possible and to ensure 100% accuracy. We need to support the vendor/platform or operating system that we ultimately ingest into our network model.
When IP Fabric successfully authenticates into an unsupported network device, it exits with failure after several attempts to detect any known operating system. The supported network vendor list is growing every release. If your current network equipment is not supported now, it doesn't necessarily mean it will not be in the future. Feel free to contact any IP Fabric representative for more information or request a trial.
Your business relies on IT to deliver services to your customer. But what happens when there is a failure, can you afford downtime?
Whether or not you can afford it, you should ask yourself this question: how to manage network risk to maximise service availability?
In this blog post, we are going to identify some risks you may be facing today, so you can understand better how to tackle them.
It is extremely important to have the full picture of your network. You cannot correctly manage devices or infrastructures you do not know about, or only have partial information.
The inventory is often used as the source to define the list of devices you will have under maintenance. What happens if a device fails and is not under maintenance?
You will need to order a replacement, which could take days, weeks, or more to arrive before you are able to restore the service. In the best-case scenario, the service is resilient, so only resiliency is affected, but while waiting for the replacement to arrive, you would be in a situation where you cannot afford for anything to fail.
In the worst-case scenario, if the service is not resilient, the service will be unavailable until the replacement of the faulty device.
So, we understand that maintaining an accurate inventory is crucial, but it can be very challenging:
We have a very similar problem with the documentation of the network and making sure it stays up to date. Otherwise, you are at risk of not being able to solve efficiently any issue arising on your network. A partially updated diagram could be very misleading for any change preparation or troubleshooting. This could cause unnecessary downtime which can be avoided.
Obviously, you may have processes in place to ensure diagrams and relevant documentation are accurate. But we all know that this is very time consuming, and let’s be honest, there are some more exciting projects you would rather be working on.
Monitoring tools are there to alert you of an issue, but what happens if there are some anomalies which are not considered as an issue, i.e., no SNMP traps are sent, nor syslog, and you have not experienced any symptoms because the problem is only on a backup link or device.
How do you detect these inaccuracies to fix them before they become service affecting?
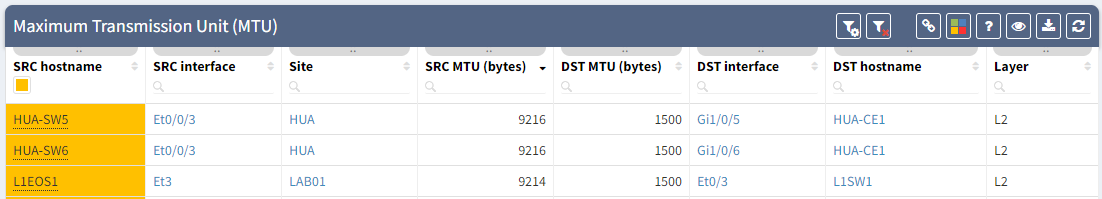
MTU can be the source of issues when the MTU is not configured consistently, for example, you have a primary path working as expected, but the backup is misconfigured. It means you will only notice the issue once the primary path fails.
It can be difficult to confirm MTU is correctly configured on all your devices: how long would it take you to collect the information for all the interfaces’ MTU, parse that data and analyze it so you know for each link how is the MTU configured on both end?
Having instant access to the links with inconsistent MTU, allows you to be proactive, so you can fix any links which could be causing issue on your network.
The second hidden issue I wanted to discuss here, has caused a major downtime in my previous experience: a BGP neighbor with no received-prefixes.
This is the situation we were in, two BGP neighbors to a service provider, but on the backup router, we were not receiving any prefixes. BGP session was still established, so no issue from our monitoring tools, everything “seemed fine”.
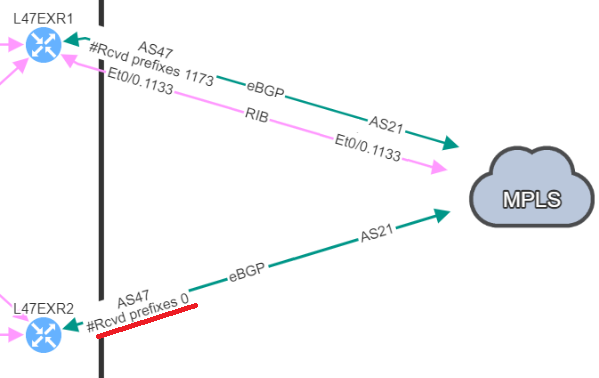
And one day, it happened: we lose our primary connection, and here starts our massive downtime. We no longer have access to this service.
We knew the resilient path had been working in the past, but what we didn’t know is that it wasn’t working anymore. How can we detect this so we can resolve similar issues before they cause downtime?
For further information on this point, you can check the following blog post: BGP resiliency and received prefixes | IP Fabric | Network Assurance
Those examples show how you could be facing an issue on your network and be totally unaware of the situation.
We want to be proactive as much as possible to avoid any downtime, but there are situations when issues happen. So, we need to be reactive and work efficiently in order to restore the service.
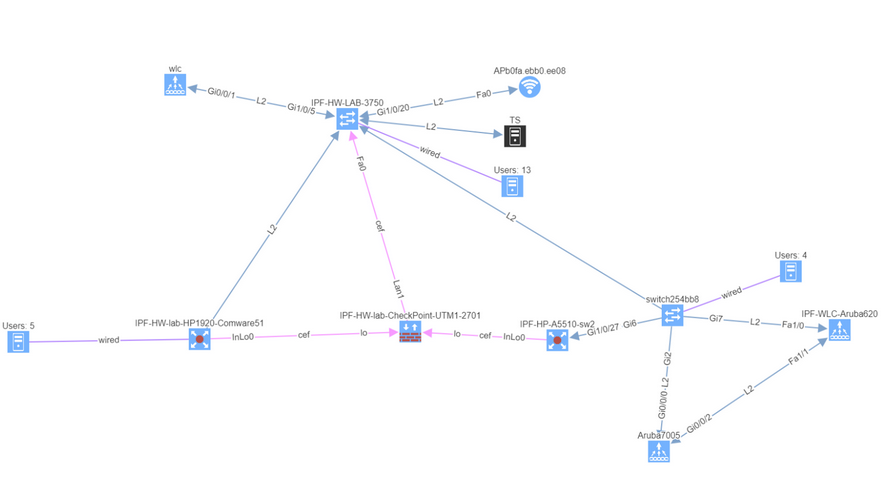
Using IP Fabric’s End-to-end path, will very quickly display all devices involved with passing traffic from a source to a destination. IP Fabric doesn’t just look at the network data, it includes firewalls in the path, so you can visualize any policies which may block the traffic.
With such a tool at disposition, it becomes easy to quickly pinpoint the source of the issue without having to connect to any devices, check the logs on different firewalls or spend time finding the latest diagram. Everything is available in one single and dynamic view:
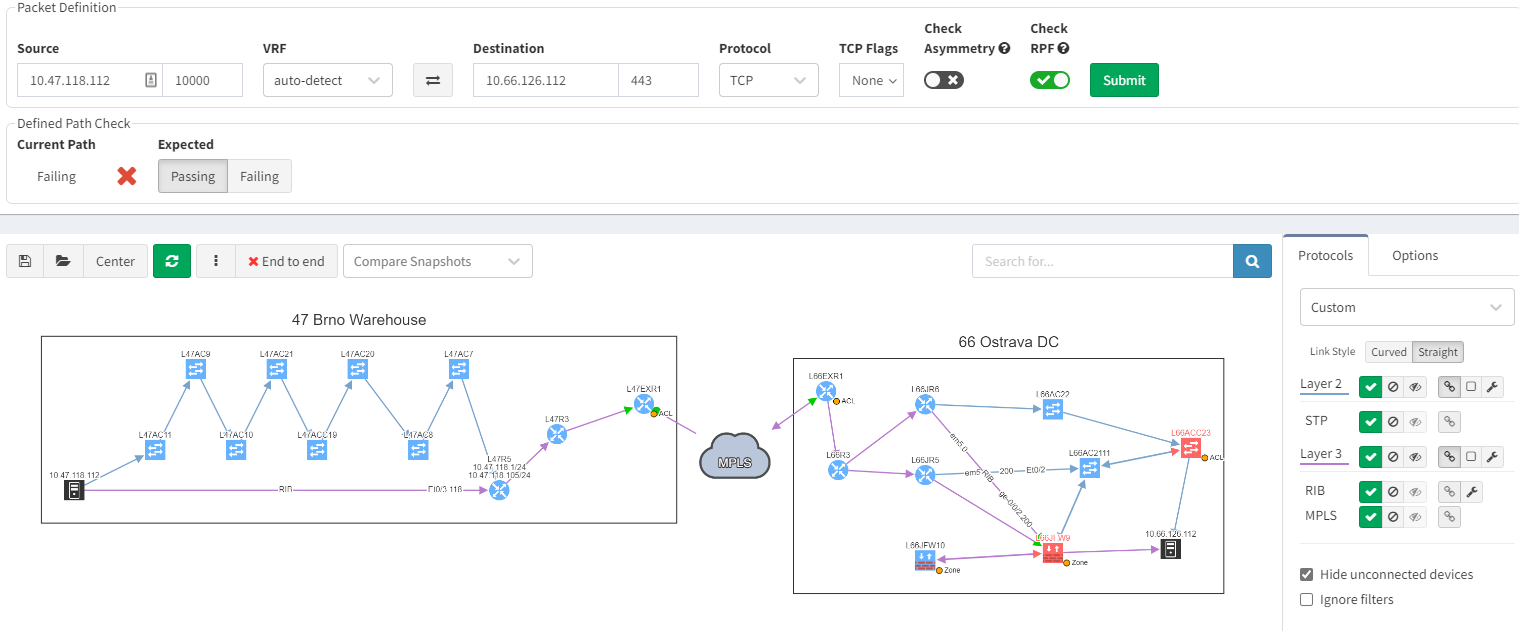
When you are troubleshooting, you often lack the understanding of how it was working before. It would be very useful to have a view of a previous topology, for example, from the day before. Then, by comparing both topologies, you can observe and quickly identify what has changed:
In the example above, you can see in the previous snapshot, there was only 1 link to the MPLS cloud, the 2nd one in red was not present, but is operational in the latest snapshot.
IP Fabric, as a network assurance platform, shines a torch on all those weaknesses and proactively inform you of potential issues existing in your network.
There is a lot more IP Fabric can help you with. To explore further, join our webinar on the 30th of June at 11am CEST: IP Fabric - FSI Webinar You can get in touch with us through www.ipfabric.io and follow our company’s LinkedIn or Blog, where more content will be emerging.
I’m pleased to announce the release of IP Fabric® Platform 2.2. Continuing our mission of delivering more capabilities into the hands of the network engineers, this major release exposes all predefined verification checks and enables to edit them or to define your own. Each technology verification can also be added to the dashboard, which is now fully customizable.
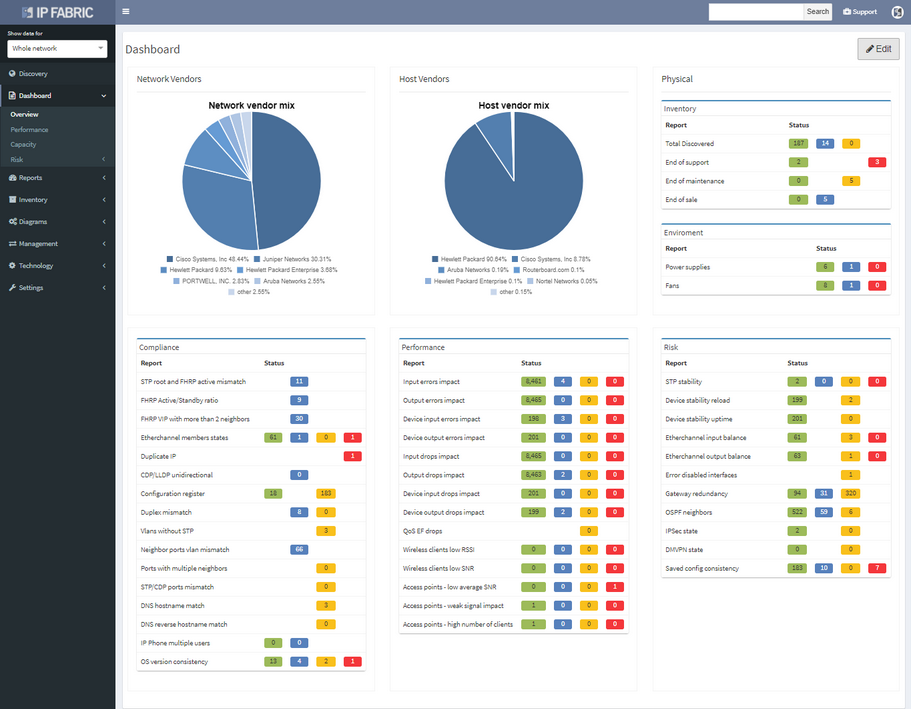
We’ve also revamped our diagrams to handle much larger scale, visualizing thousands of network devices and links on modest client hardware, and added many visualization options.
Version 2.2. also adds support for Junipers routers, switches, and firewalls, and base support for Fortinet FortiGate and Palo Alto.
We also haven’t forgotten about improving system administration, and this release has added options for encrypted backups and automatic updates.
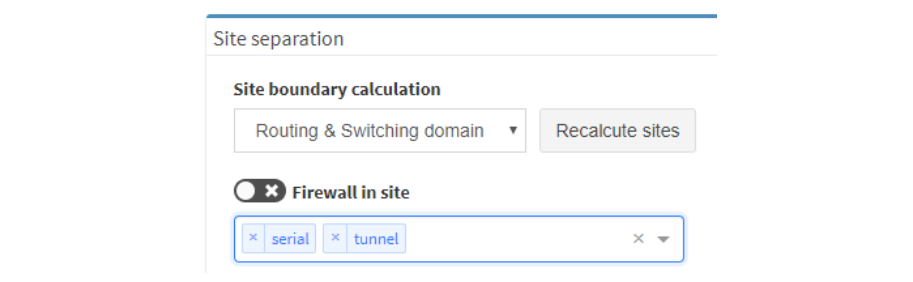
There were many other smaller enhancements such as the ability to recalculate site boundaries without running discovery, and the ability to use multiple nested regular expressions to separate sites based on the naming convention. I especially like that site recalculation also recreates all of the documentation according to the new separation rules, so even historical documentation can be updated.
As always, if you’re interested to know more, you can always drop me a line or request a demo or trial.
The IP Fabric platform is a network engineer's best friend when performing deep network audits. For example, to verify root placement for overlapping VLANs in a LAN, I would normally need to look through the STP roots, and painstakingly trace L2 links, reconstructing the topology of each instance.
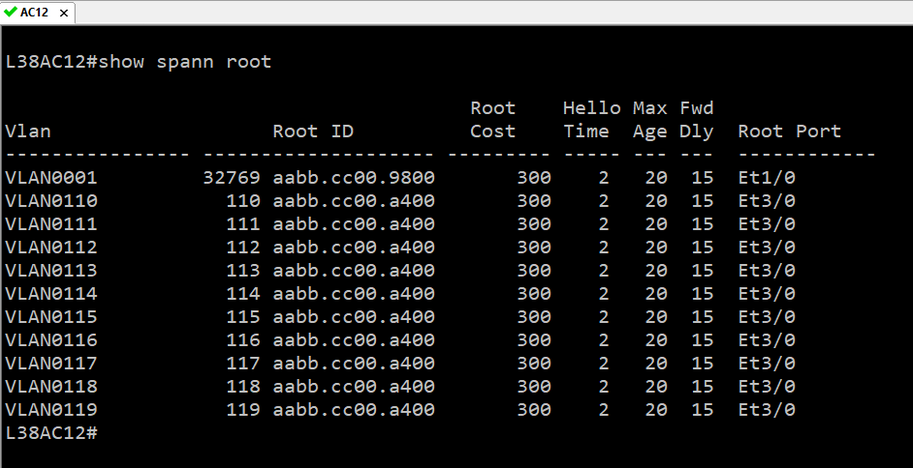
For example, to verify root placement for overlapping VLANs in a LAN, I would normally need to look through the STP roots, and painstakingly trace L2 links, reconstructing the topology of each instance.
With the IP Fabric platform, I can just grab the hostname of the device, and look it up in the device inventory to find the corresponding switching domain the device belongs to.
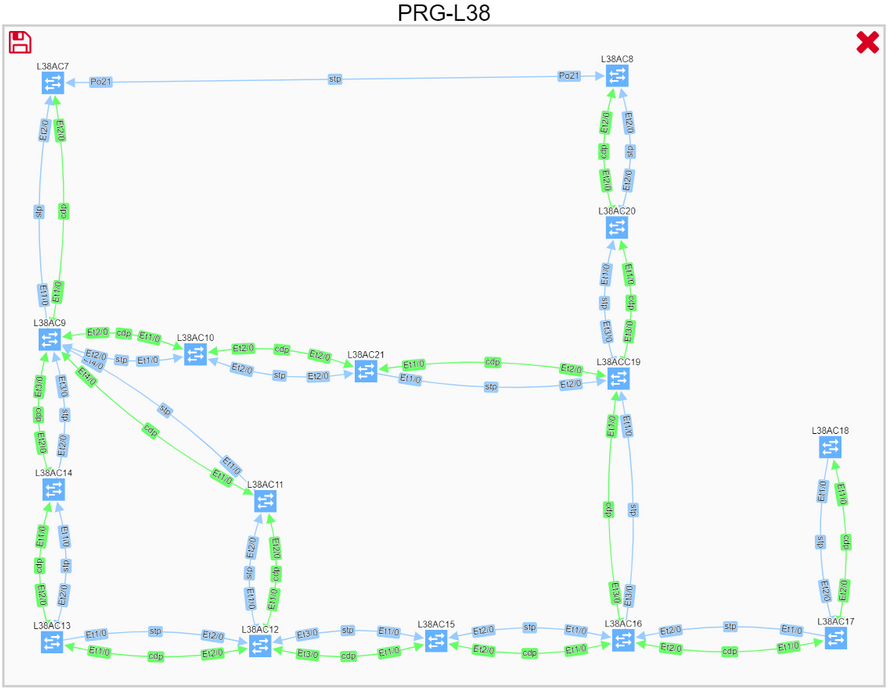
Click on the switching domain visualizes all overlapping spanning-tree instances. We can check the topology of a specific VLAN by adding the instance to the graph.
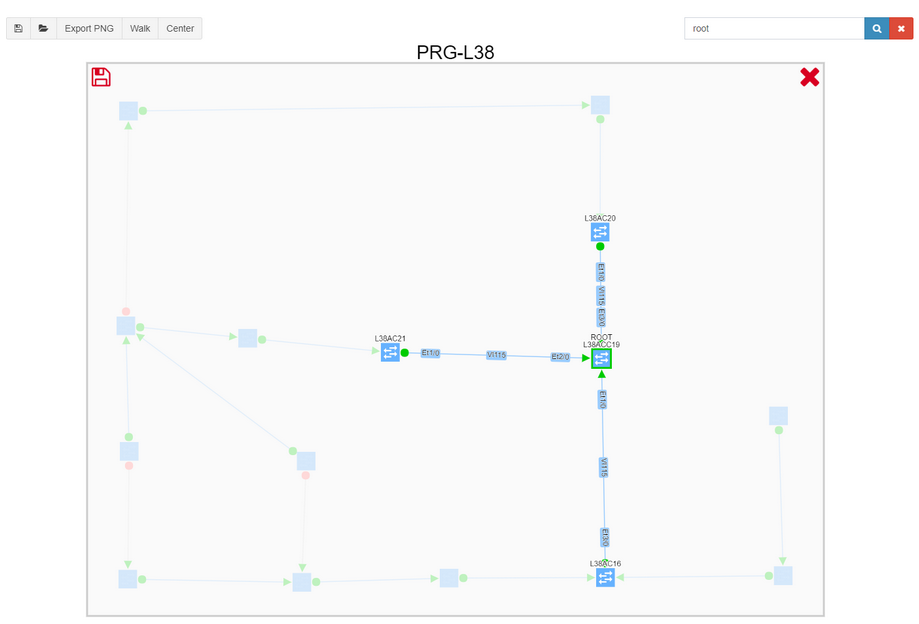
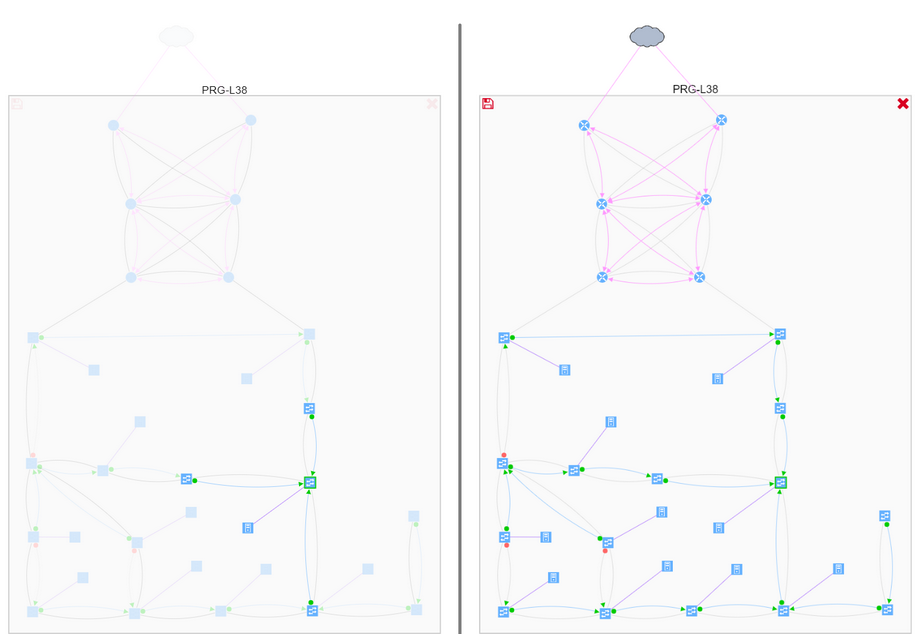
We can then search for root, and filter excess information to get a better understanding of the VLAN topology, including blocked links.
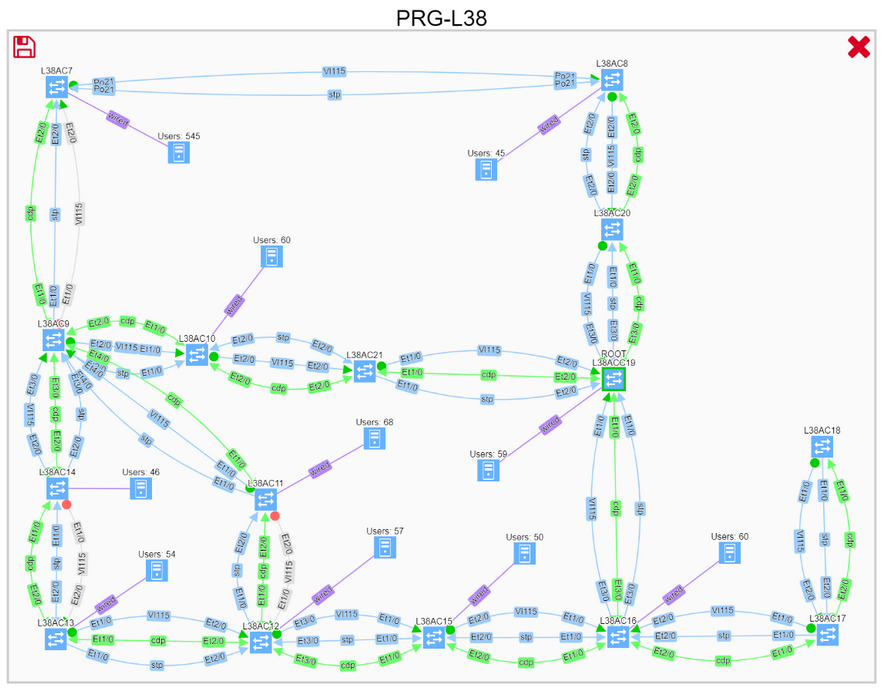
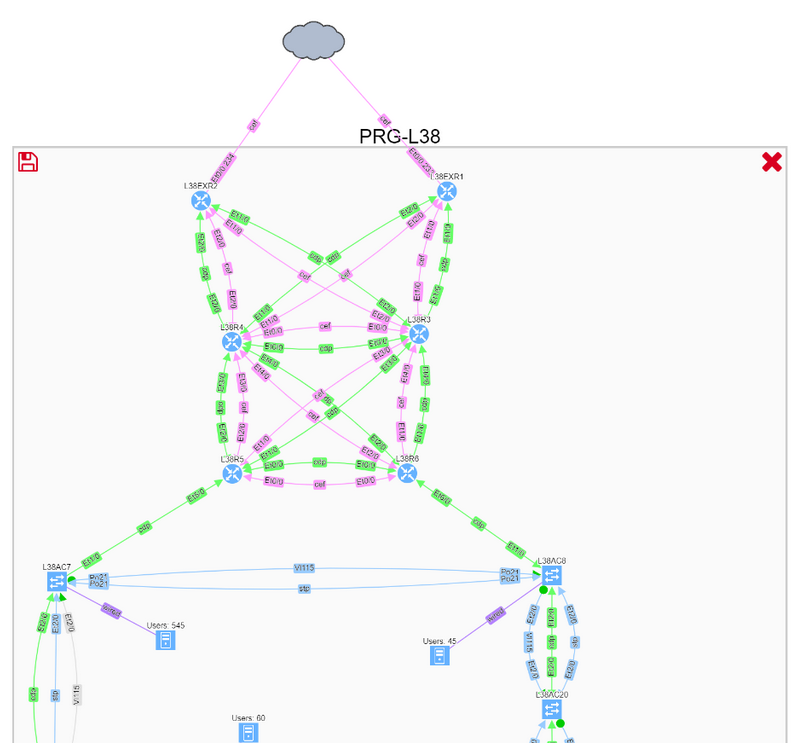
Thanks to graph math, we can instantly perform what-if scenarios, such as finding non-redundant links, displaying the location of the users, or adding a corresponding routing domain, to better understand communication needs, and see where the optimal root placement would be considering site’s edge.
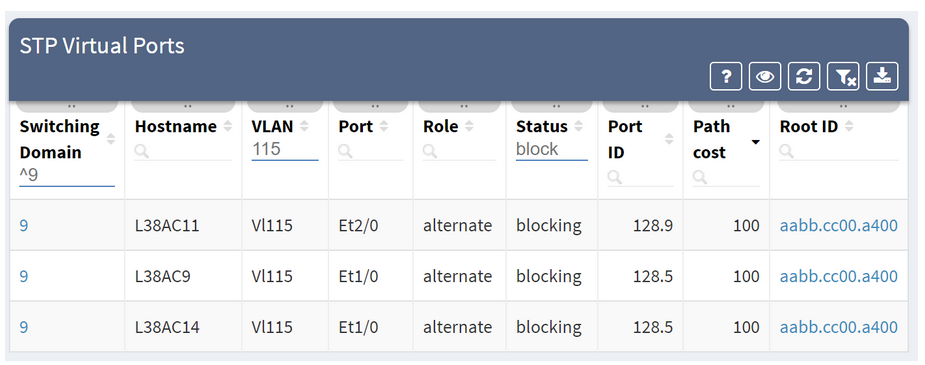
We can also drill down into further details all the way to the virtual port level, to make a sound engineering decision and understand any potential risks.
If you have found this article resourceful, please follow our company’s LinkedIn or Blog. There will be more content emerging. Furthermore, if you would like to test our platform to observe how it can assist you in more efficiently managing your network, please write us through our web page www.ipfabric.io
Discovery of existing IP network devices and links is essential to proper network management and control. How can you perform the discovery with the minimal initial information required?
While you are approaching an existing network that you know very little of, you usually spend a lot of time getting as much information as possible before you even look at and touch the network itself. You can study the documentation (if any), get the inventory lists, try to understand the topology and design, downloading configurations, gather IP ranges, ask for administrator privileges, etc. This can be a cumbersome process even if all involved people cooperate. And usually, the responsible people will not be happy about granting full access to the network for the discovery.
You can apply brute force reconnaissance methods as well — such as blindly scanning whole private IP ranges or trying to contact any IP address that goes around in your packet scanner. However, this is not something that you would like to see in a business critical network.
With the IP Fabric platform, you can start the network discovery right away without wasting any time or threatening your network by using a single set of read-only network access credentials only.
You do not need to define any seed devices or scanning ranges in most networks. You do not even need the full privileges as you are gathering operational data for the discovery only.
Discovery algorithms of the IP Fabric platform can use as little of initial information as available and still produce valid and useful results to support the proper network management and control.
If you have found this article resourceful, please follow our company’s LinkedIn or Blog. There will be more content emerging. Furthermore, if you would like to test our platform to observe how it can assist you in more efficiently managing your network, please write us through our web page www.ipfabric.io


