The fundamental purpose of a data network is to connect users with applications, data producers and consumers with storage. The most desirable feature of a network is to maximise availability of those services to the endpoints that consume them. In order to achieve that, we need to consider (amongst other things):
To be sure we can deliver availability then, we should design our networks with these tenets in mind.
Sometimes though, organic growth in your IT environment means that the original design principles can't be upheld. You need to change your network to fulfil a new requirement and fast! And so you build a change to your network that compromises the original design principles but provides a solution.
Often, this means connecting a new link to a new device which is not big enough, fast enough or resilient. Or some unseen configuration issue prevents redundant links from being available for use. Then, when an issue occurs later, you and your users suffer because the principles you laid out for maximising availability haven't been upheld and systems fall over. You are then left trying to trace the reason why things have failed.
Where do you start? Your diagrams and design documents were great when you built your network, but no one has kept them updated. And so, you have to start where they end, and:
then you sit down with your network team to analyse where your single points of failure are and what you can do about them. Don't forget that they might not be immediately obvious in the physical topology, but in the logical configuration!
Alternatively you could give the job to IP Fabric.
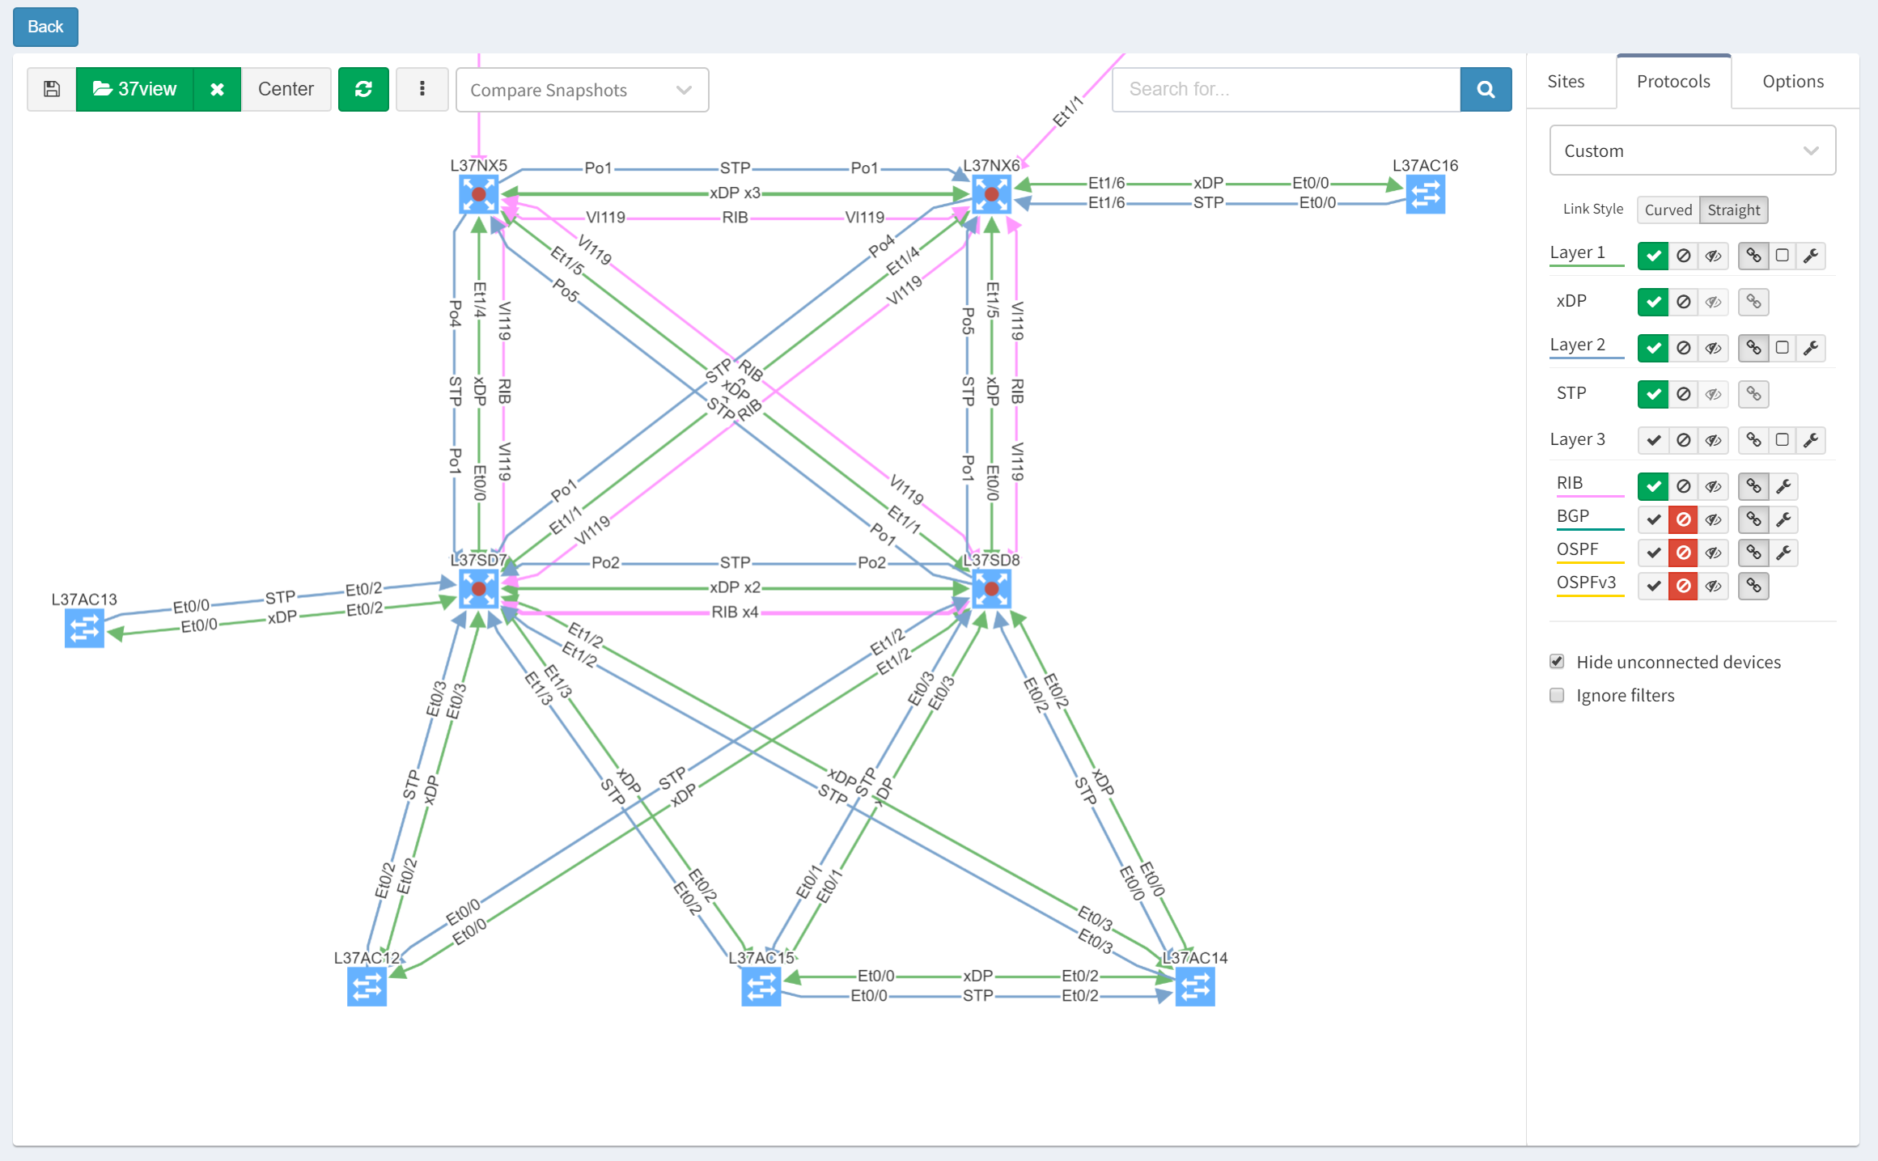
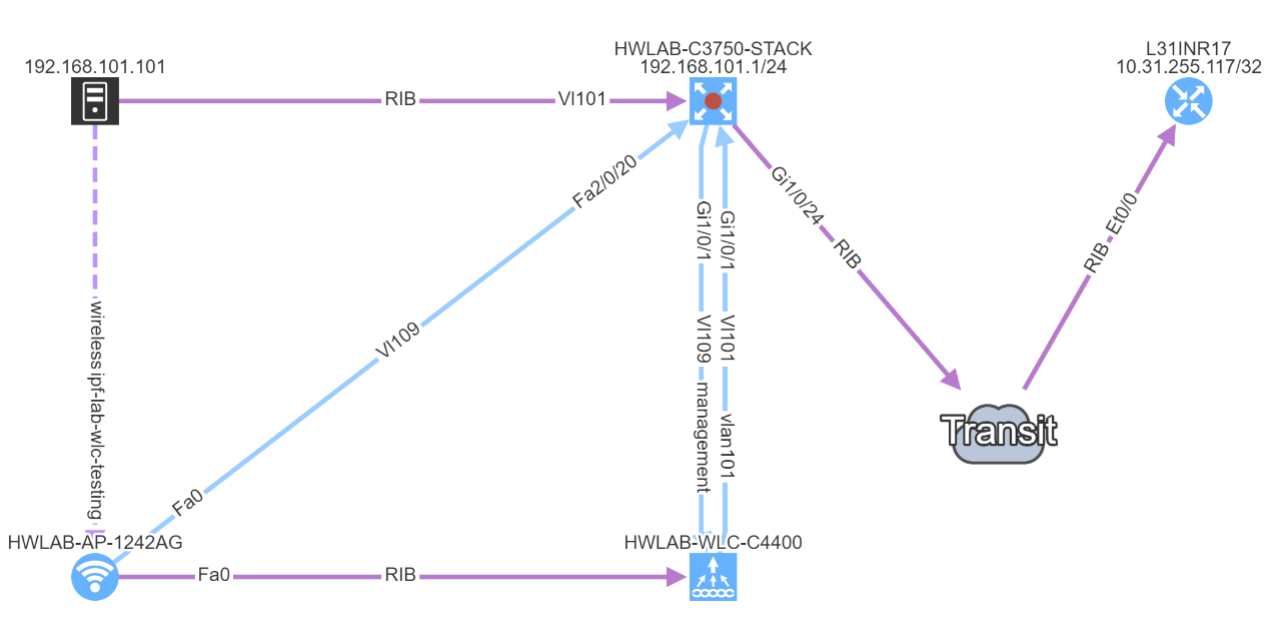
Each time IP Fabric runs a snapshot, it rediscovers the network topology from the physical layer upwards. Clicking through the Diagram | Site Diagrams menu shows a visualisation of the topology:
After turning off Layers 1 and 3 for clarity, then selecting the Options tab and clicking "Single Points of Failure", IP Fabric highlights them with red outlines:
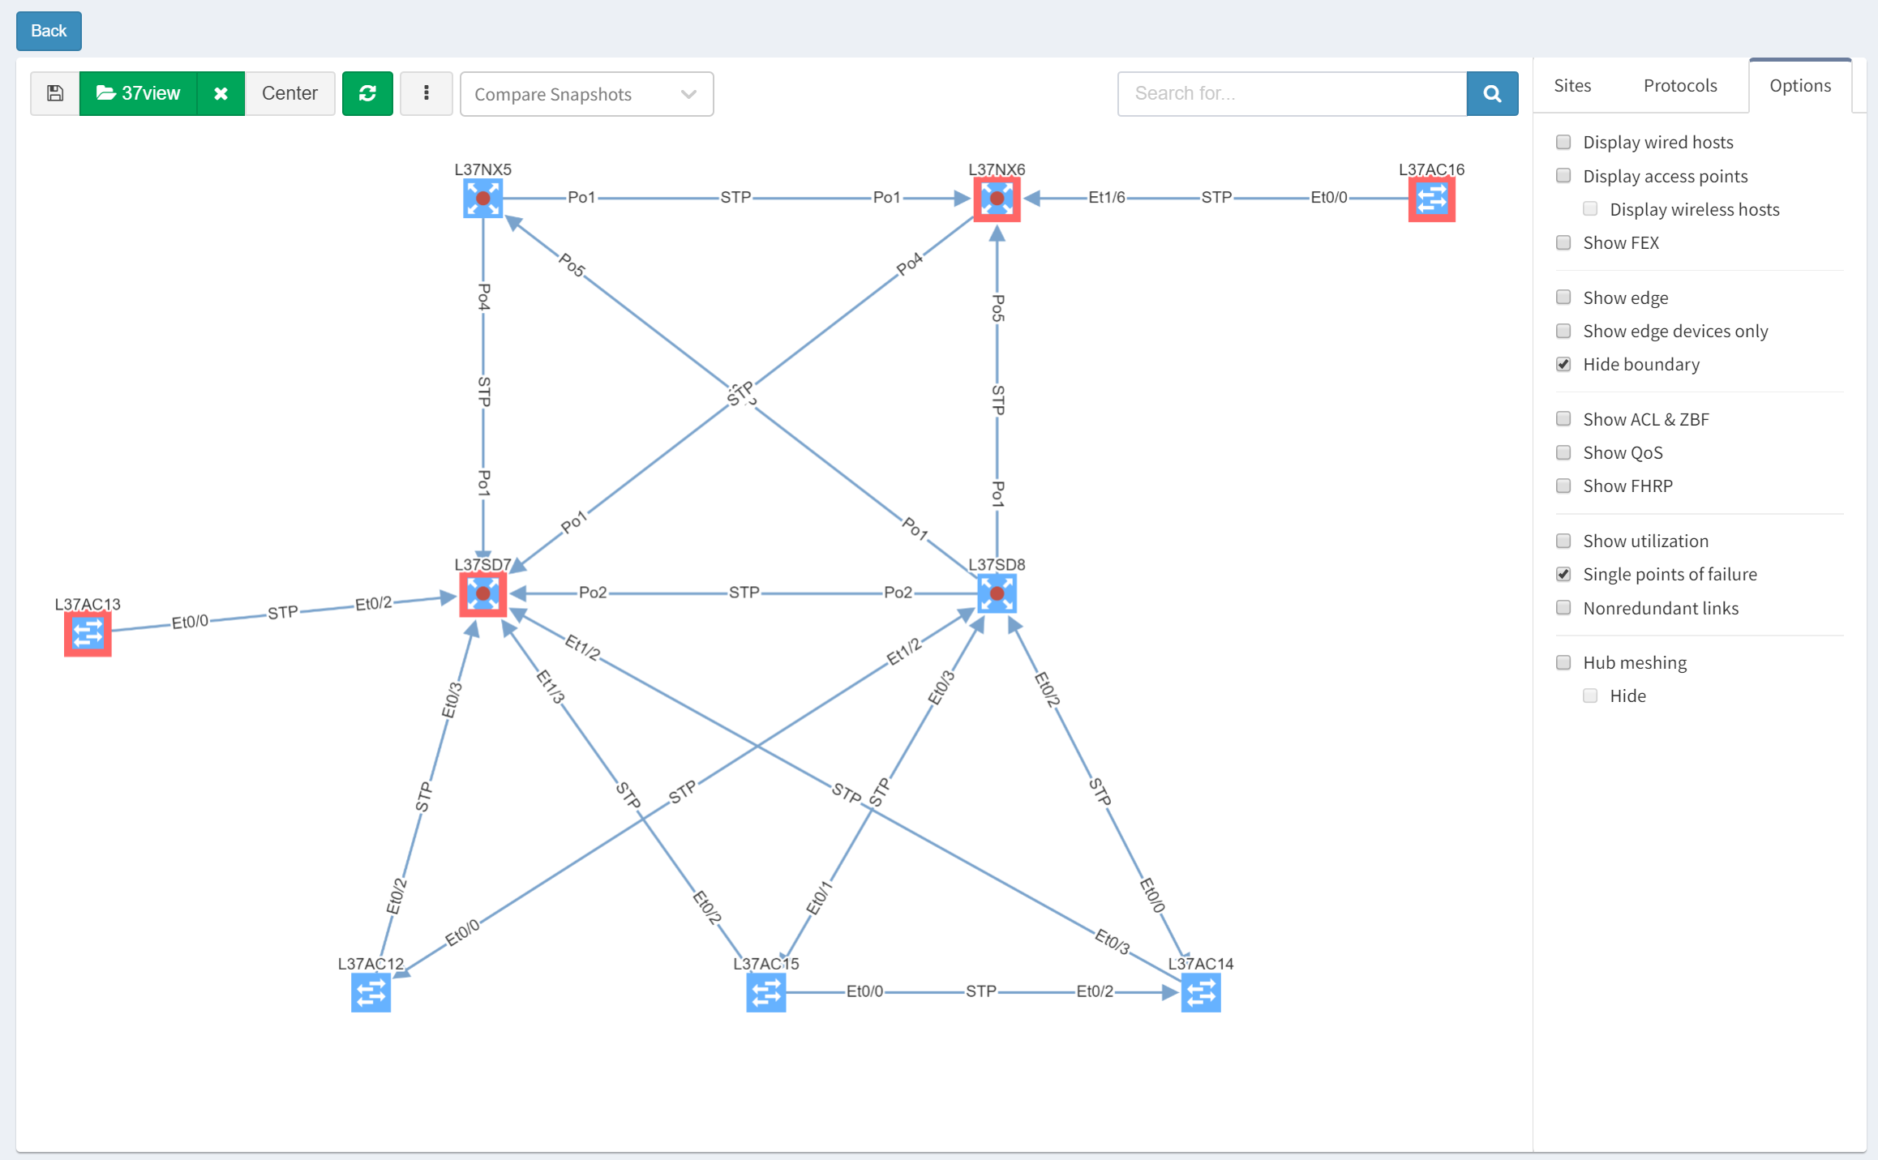
IP Fabric is able to analyse and interpret relationships between devices both upstream and downstream. In this case, switches are shown as SPOFs because they are the sole upstream devices for some access switches.
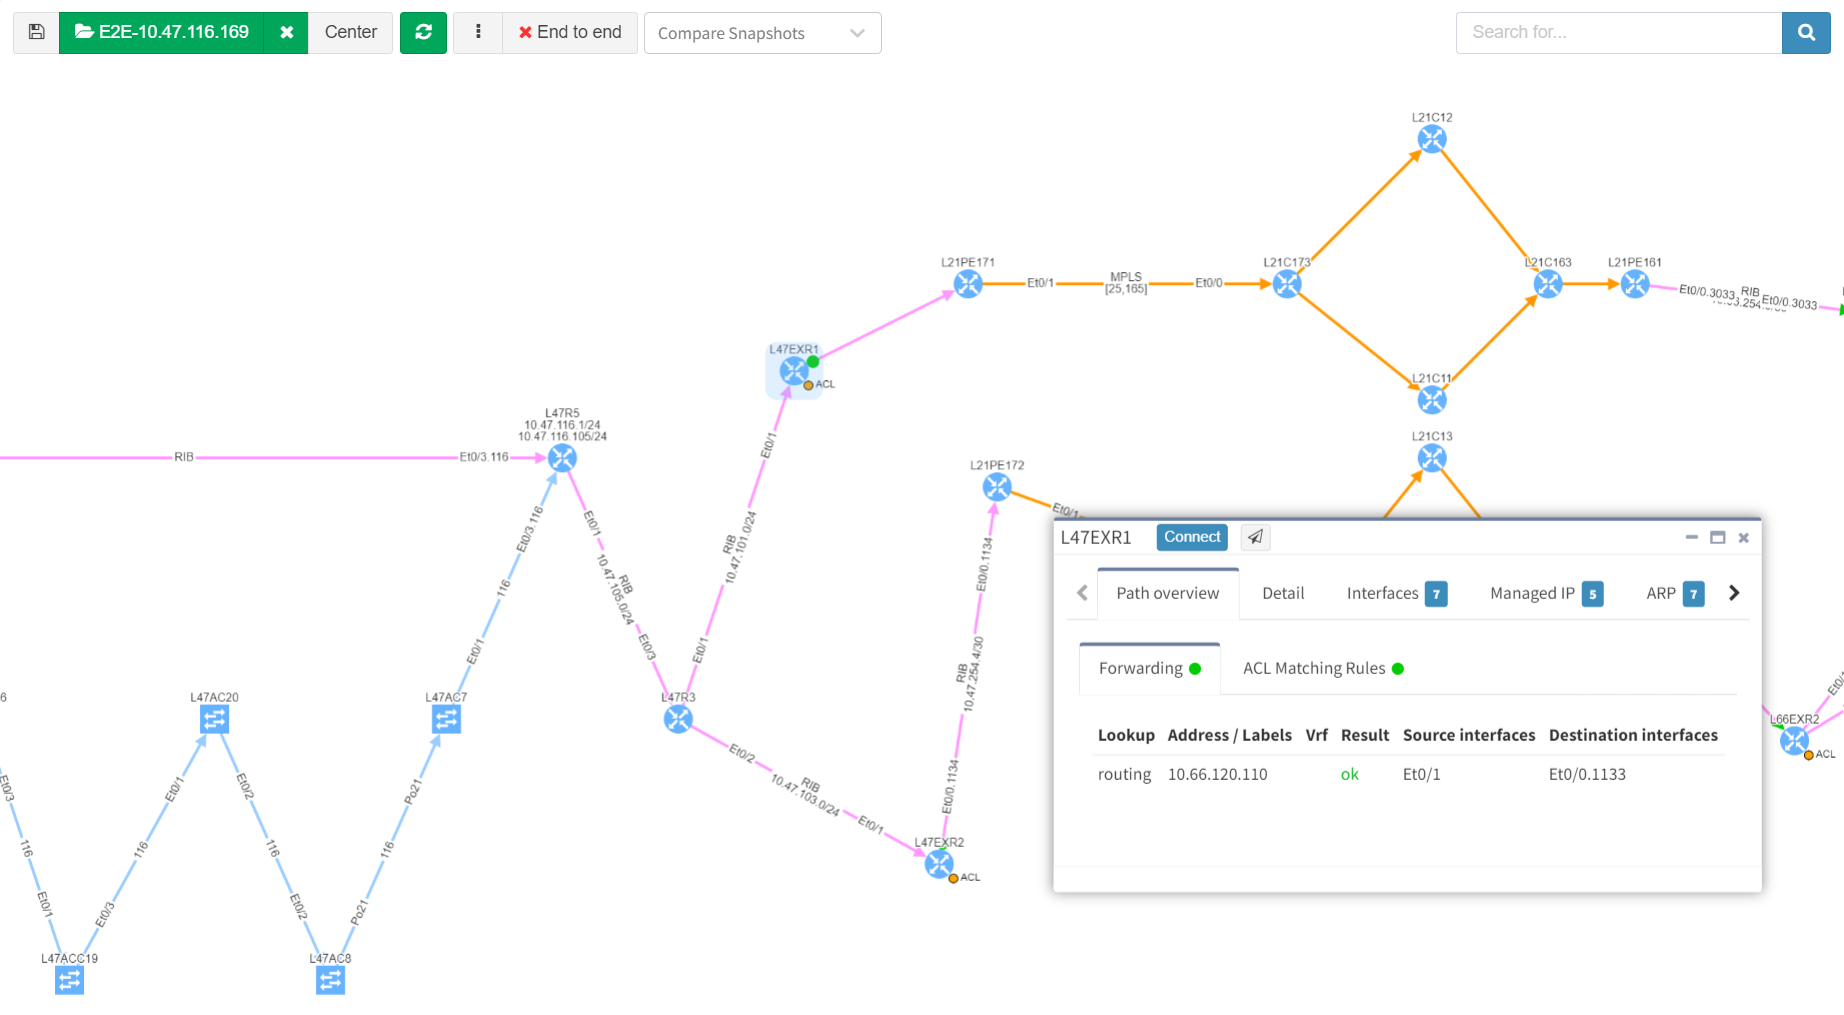
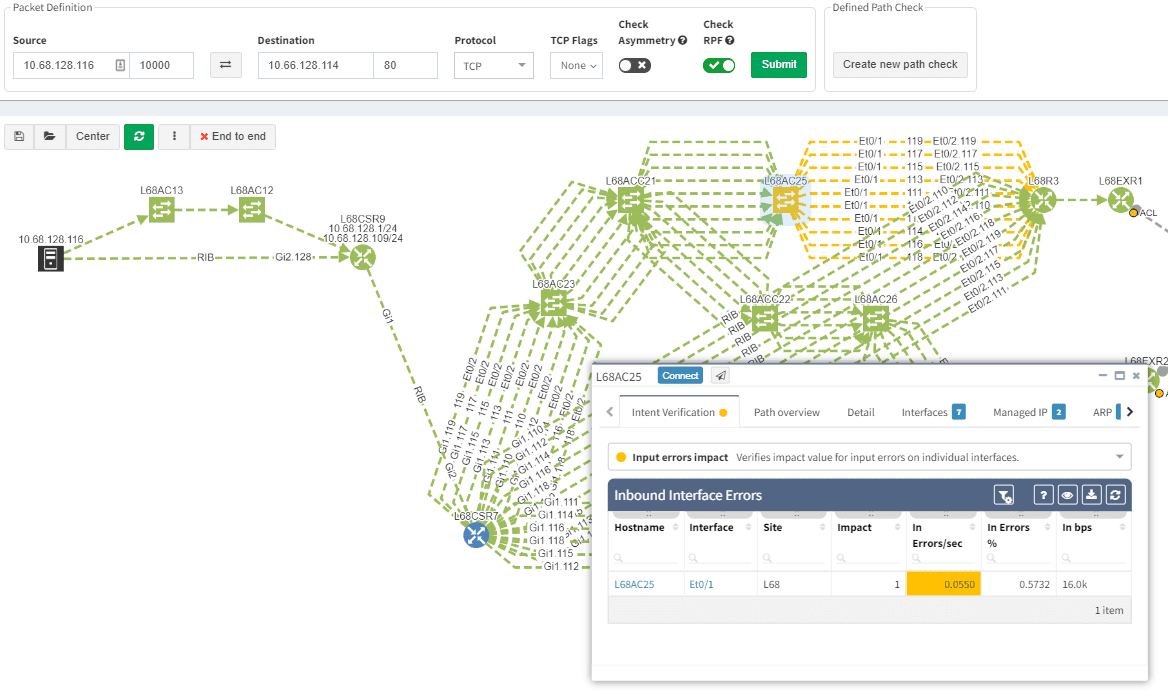
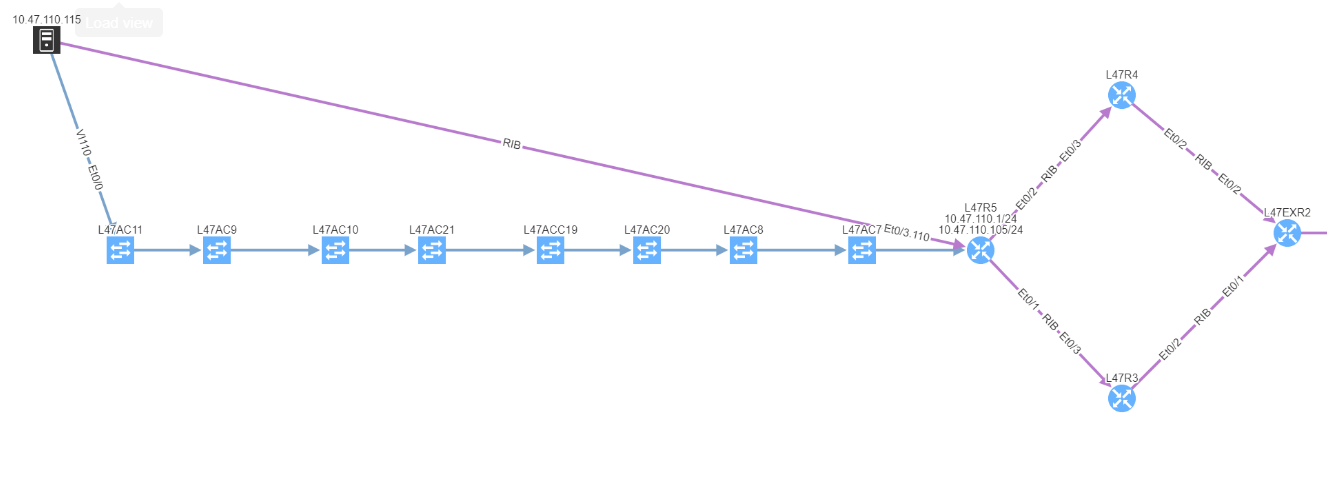
As we've seen, IP Fabric's powerful visualisation helps us appreciate problems in topologies, but there are alternative and equally powerful views of the network. For example, you can check a simulated path between hosts for single points of failure. Select Diagrams | End-to-end path. After submitting source and destination IPs, non-redundant devices can be highlighted along the path.
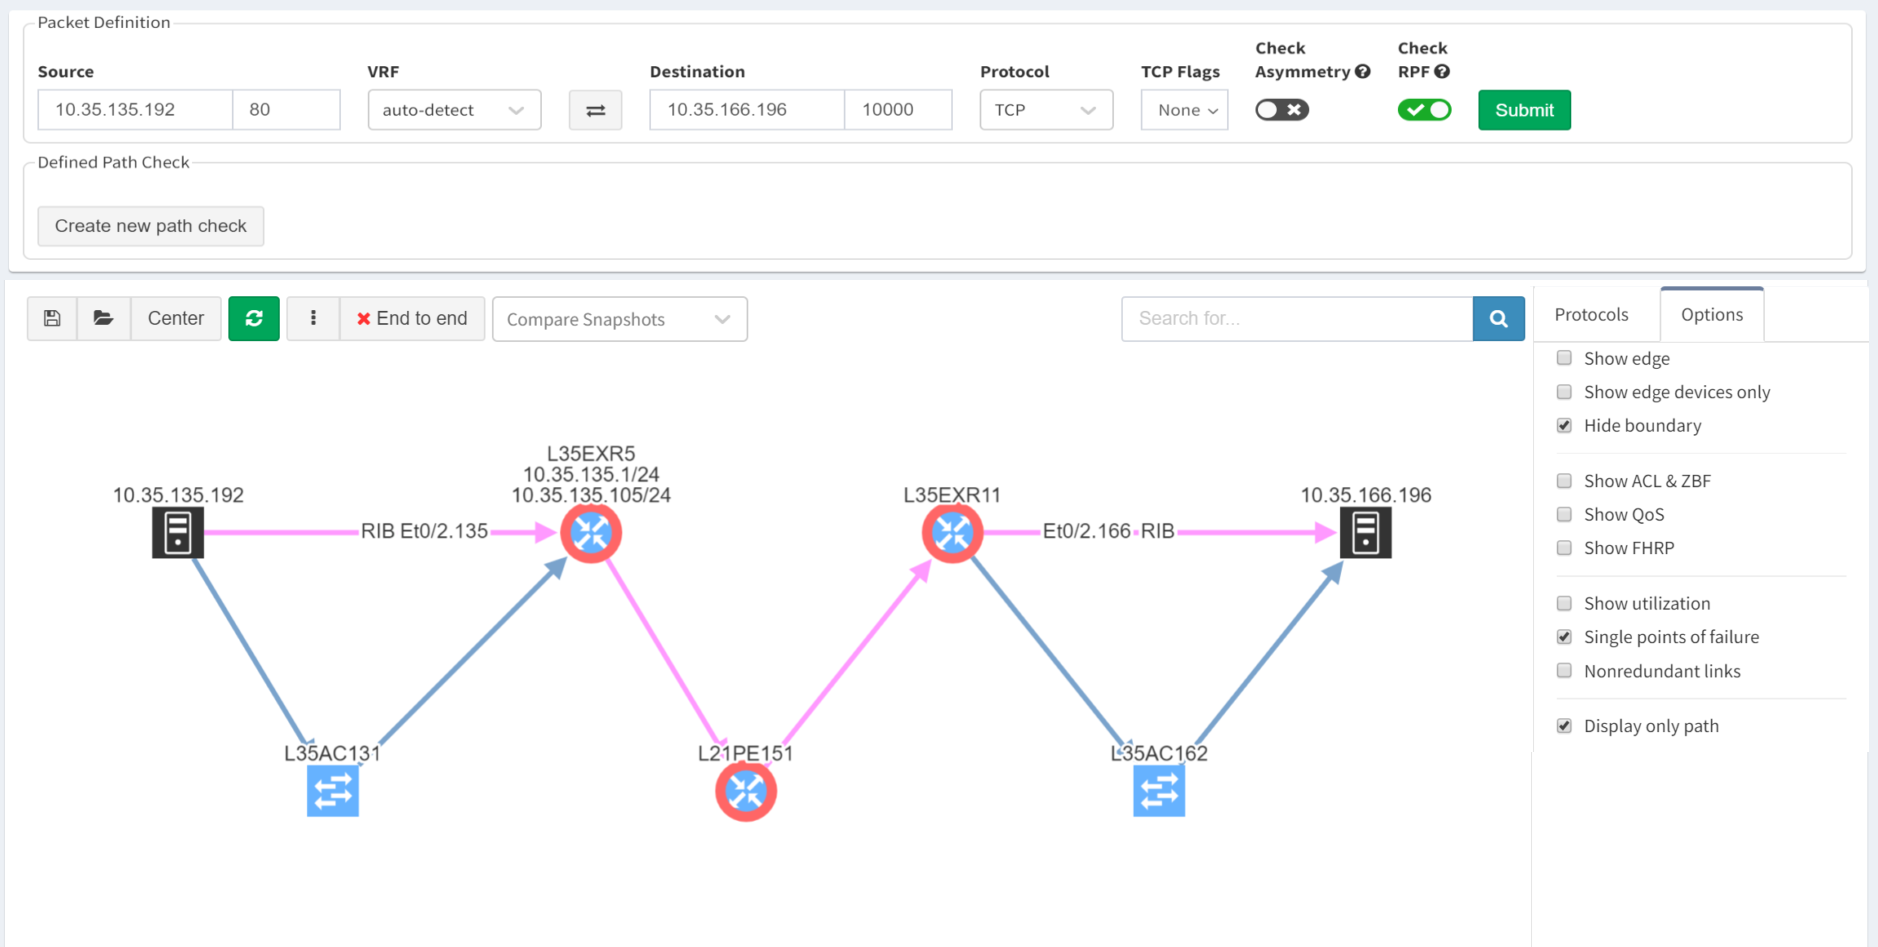
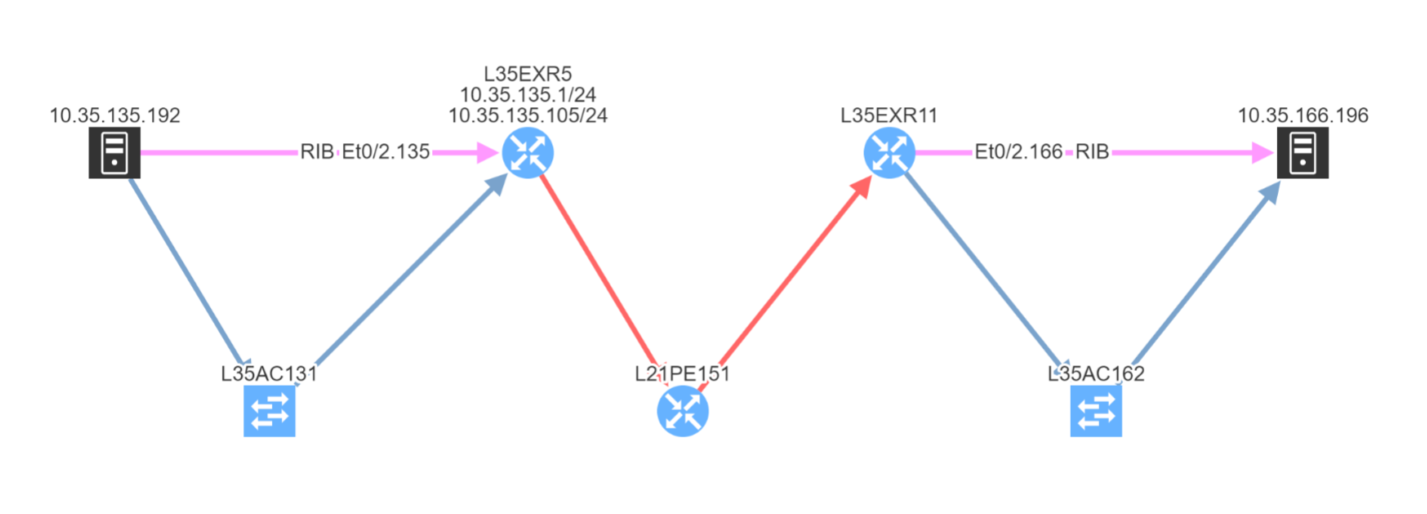
Subtly different, you are also able to highlight non-redundant links, showing where there is a strict dependency on the link to ensure an end-to-end path between the hosts.
So you can see how IP Fabric has saved you huge amounts of time and effort spotting single points of failure in your network topology. And now you are in a position to proactively remediate before this becomes a problem!
If you have found this article helpful, please follow our company’s LinkedIn or Blog, where more content will be emerging. If you would like to test our solution to see for yourself how IP Fabric can help you manage your network more effectively, please contact us through www.ipfabric.io.
The ability to perform end to end path simulation quickly across complex network environments means fast response to any issues or current design process requirements. The main reason that computer networks are built is to enable communication between two or more endpoints and the whole ecosystem is created for sharing information as efficiently as possible.
The IP Fabric platform is a unique tool that is capable of extremely fast end to end path simulation only by presenting the source IP (and VRF) and destination IP with port and protocol. Any application path can be technically verified from an operational perspective within seconds and without any extensive command-line knowledge just with read-only access to the platform.
In companies and organizations using IP Fabric, an End-to-End path simulation is often a go-to tool for technical teams that tend to use the network in any way. It can be a server, application, or helpdesk team.
Our previous articles are covering authentication and changing the settings via API. I strongly recommend reading them prior to testing the End to End over API. It will help with a basic understanding of workflows related to IP Fabric's API.
Now it's a good time to discover the endpoint with all its parameters.
# API Endpoint:
apiEndpoint = 'https://ipfServerUrl/api/v1/graph/end-to-end-path'

# API Parameters:
e2eParams = {
     'e2eEndpoint' :  apiEndpoint,
     'sourceIP' : '?source=10.66.128.112',
     'destinationIP' : '&destination=10.66.255.104',
     'sourcePort' : '&sourcePort=10000',
     'destinationPort' : '&destinationPort=22',
     'asymetricOption' : '&asymmetric=false',
     'rpfOption' : '&rpf=true',
     'protocolType' : '&protocol=tcp',
     'snapshotID' : '&snapshot=696aee04-7370-47cf-bbcc-ef86d1bc5244',
 }
In the previous Python3 snippet, we prepared the e2eParams object consisting of many keys and associated values. The API endpoint is a combination of the base and additional parameters, such as source and destination IP address, destination port, protocol type, and the snapshot ID.
The snapshot ID has to be defined and can be collected with GET request from 'https://ipfServerUrl/api/v1/snapshots'
As a next step, we can build the query to which we point the GET request towards:
e2eQuery = ''
for val in e2eParams.values(): e2eQuery += val
When the endpoint string is complete, we will simply send a GET type request. As a response, we get a full and detailed E2E path with each and every hop. For that purpose we can reuse the function from previous articles related to API webinar:
def e2ePath(e2e, e2eHeaders):
    e2eGet = requests.get(e2e, headers=e2eHeaders, verify=False)
    if e2eGet.ok: print(' The E2E path simulation is ready.')
    else: print(' UNABLE to simulate E2E: ' + e2eGet.text)
    return e2eGet

path = e2ePath(e2eQuery, authHeaders)
In the response we 3 main dictionary keys provided:
>>> e = e2ePath(e2eQuerry, headers)
The E2E path simulation is ready.

>>> e.json().keys()
dict_keys(['graph', 'ad'])

>>> e.json()['ad']
['vSite/138494449']

>>> e.json()['graph'].keys()
dict_keys(['nodes', 'lookup', 'edges', 'type'])

>>> for node in e.json()['graph']['nodes']: print(node['hostname'])
L66R4
L66R3
L66JR5
L66AC2111
L66JFW9
L66JFW10
L66ACC23
10.66.128.112  <<< HOST
In the Python3 console outputs above we requested the path from IP Fabric. Then we quickly observed available keys, and as a last step printed list of network devices that the path is using.
The End to End application path simulation in IP Fabric's GUI is a powerful and fast troubleshooting tool. It's interactive and each routing or switching hop can be investigated individually as well.
But still, there are advantages for API simulation over GUI one. At first, the output in JSON format is ready for non-standard applications. Verifications like what are the IP hops and interfaces used on the path can be easily obtained. Secondly, the API call for path testing can be faster for testing across more than one snapshot.
Another great advantage can be integration plans with other tools. The end to end testing engine is ready to provide answers at a speed of light fashion.
Thank you for reading!
If you have found this article helpful, please follow our company’s LinkedIn or Blog, where there will be more content emerging. Furthermore, if you would like to test our platform to evaluate how it can assist you in managing your network more effectively, please let us know through www.ipfabric.io.
With a growing number of customers and requests, the initial plans for minor bugfix release have been expanded into a major release which improves upon nearly all aspects of the product. Here we'll cover the biggest changes in the major release of IP Fabric 3.1.0. Customers can upgrade the installation via the administrative interface by following the procedure in the documentation.
Before we'll go into detail of the changes, let me point out a few of them in the beginning. For visualization, the new View Builder provides the option to create a fully custom diagram views, new manual site separation enables to refine automatic site detection, and improved object manipulation helps to deal with complex diagrams. For vendor and technology support, we've added basic support for Cisco Firepower Thread Defense, added vDOM and Zone Firewall support for Fortinet Fortigate family, and added OSPFv3 support for multiple families. Additionally, we've added customization options for Network Analysis Report, revamped snapshot management, re-engineered backup and restore system and much more, so let's dive straight in!
Based on numerous requests and thanks to our network automation architects, the Cisco Firepower Threat Defense devices are now being supported to complement our ever-expanding portfolio of supported network technologies and vendors. For now, only the basic support has been added as we're exploring use cases with this innovative platform.
The support for the Fortinet FortiGate family was expanded from basic discovery to support Virtual-Domains (VDOM), Zone Firewalls, and Port-Channels. This support has also made into network simulations expanding End-to-End path mapping capabilities with the security layer for this platform.
As more customers are working with IPv6, we've also added support for OSPFv3 for both IPv4 and IPv6 address families. Both technology tables and diagrams now have distinct OPSFv3 options, which include both IPv4 and IPv6 families.
With new released version 3.1.0, we introduce the View Builder. The ultimate feature that allows users to create any customized view of their own topologies and break the boundaries in diagrams. With its intuitive interface, the network devices can form logical groups regardless of any protocol relationship among them. If there is any protocol session between devices, the builder enables to crawl topology further expanding the view. If there is not any relation, the device still can be added manually by clicking the add device + button. The view builder is available through the tools menu in any of the diagrams (three dots).
From now on, it is not possible to save the backup data on the same file system where the platform resides. New partition has to be created to save the backup locally. If there's no secondary partition detected, the platform will not let the user save the backup. More information related to new options is available in our online documentation.
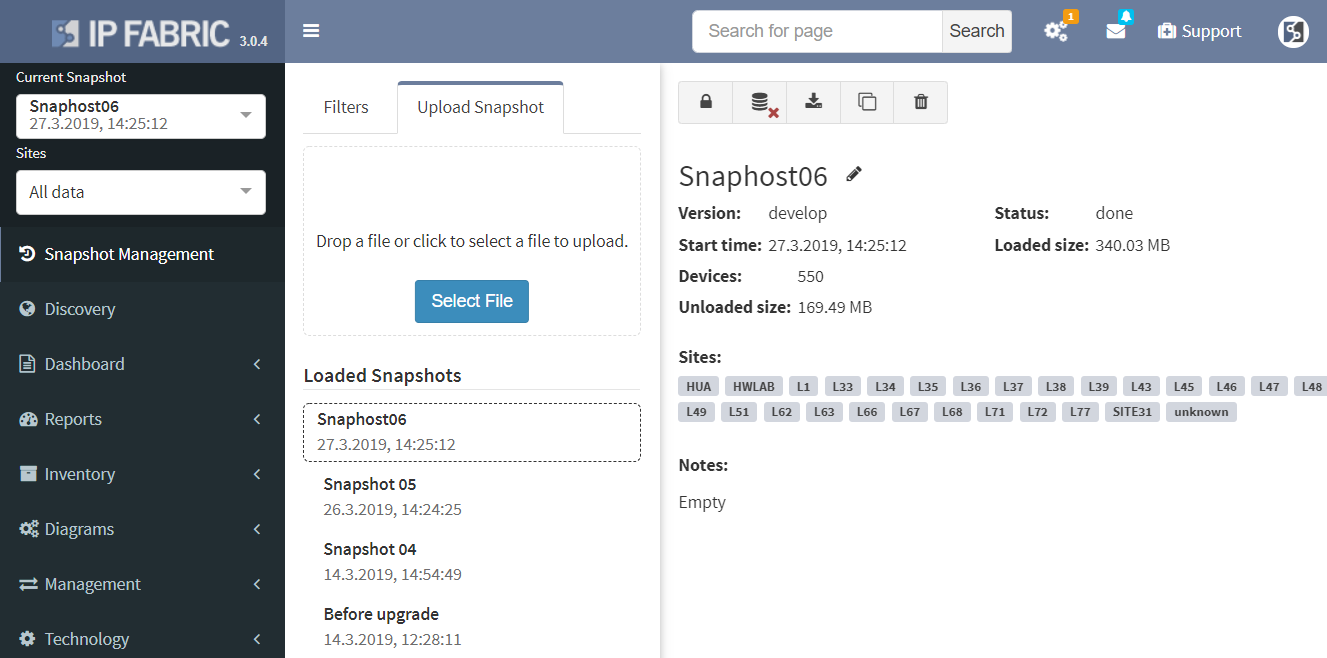
Notably, the Discovery and Snapshot Management pages were merged together. This was a logical step for the platform. We had the Discovery and the Snapshot Management on separated pages, however, every new discovery creates a new snapshot. Now it is much easier to navigate and manipulate with snapshots.
Another great news is for API documentation! From now on it's not only available online in the official documentation, but it is also included in the platform itself. At every one of the technology tables, we can now view related API details. This should make it easier to integrate the IP Fabric platform with any other management system.
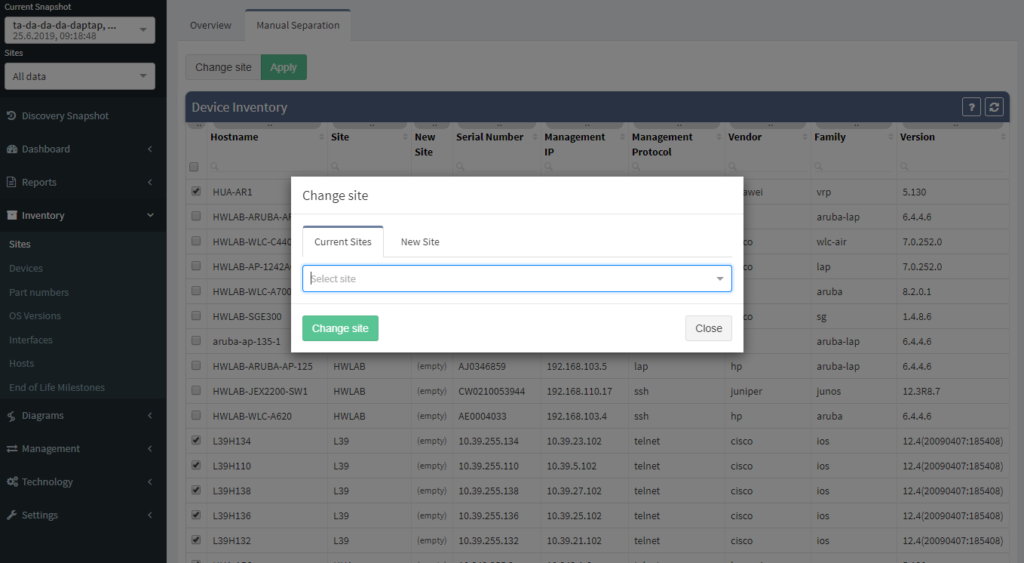
One of the most awaited features is undeniably the Site Separation update. It's only the first step, but the Manual Separation is available in the Inventory - Sites technological table. The logic is that the user would let the system separate the sites automatically and would then use the manual site separation option for fine-tuning and minor corrections through the inventory.
The network verifications are a pivotal part of the IP Fabric platform which enables a proactive approach to network management by uncovering hidden issues that might result in the outage or issue in the future. All network verifications within the IP Fabric platform have been refined to better serve their purpose and we've added descriptions to all of them.
All network verifications that are in the platform by default are still fully customizable and users can create their own of any type and include them in the main Dashboard.
In addition to this update, we've enabled customization of the Network Analysis Report document to reflect the changes and any customizations in the Dashboard, so that the report now includes the result of all verifications, including detailed descriptions of the issues.
This big change also meant any previous dashboard customizations are removed due to the difficulty of migration of old checks without descriptions to new checks with descriptions. Underlying verification definitions have remained in place, so it should be a matter of a few clicks to re-add them, and we'll be happy to help you in case you've lost track of the dashboard customizations.
End to End path simulation continues to be one of the key components in Intent-Based Network Analytics and an important use case of our platform. End-to-End path simulations verify the forwarding and security of any communication pair for every snapshot through our network model in mere milliseconds.
Since we've added support for Fortinet security policies, from now it's possible to verify both forwarding and security policies of Fortinet Fortigate equipment through vDOMs within the End-to-End path forwarding check.
There were a number of refinements to forwarding decision calculations in the network model and updates to the visual representation of the path. For example, MPLS links are now displayed based on the presence of the label stack to help to differentiate where the label is popped through PHP and where it is added.
To read more about individual changes that did not make it into the announcement, you can take a look into release notes.
If you have found this useful, follow our company’s LinkedIn or Blog, sign up for one of the Webinars, or request demo or trial to see how the platform can help you to manage your network infrastructure more effectively. For more information or to contact us please visit www.ipfabric.io.
Would you appreciate much faster end-to-end path lookup simulation on big networks, prettier diagram layout or more extensive routing protocol support? We thought so and that’s why we decided to create even more seamless experience through recent updates. Let’s summarize all the effort.

Special thanks to our Network Automation Architects, the routing protocol support has improved for Border Gateway Protocol (BGP) support, that is now available for majority of the platforms. And the same for IS-IS protocol support, which is now available for more hardware manufacturers than before as well. Apart from that we have also completed Spanning-Tree support for Extreme XOS.
Our core development team pushed their best to create better end-user experience when working with end-to-end path in diagrams. The overall layout of network devices on the path is improved and the user has the option to see isolated path only or include surrounding devices in visualization. Not to mention that query algorithm has been revamped as well, which improved its already satisfying performance.
Discovered end points connected to Access-points are now included in end-to-end path simulation besides.
Notably the discovery for some of the HP Aruba switches has been corrected. Another major improvement is with Network history feature. The Network history is available via what we call the Snapshots or Digital footprint of your network. It has started from version 3.0.0. A Snapshot is created with each new discovery and they are often used to view the historical correlation between past and present state.
To be able to use any snapshot, it needs to be available in Random Access Memory (RAM) where the most recent snapshots are being kept. If there’s any historical one that has already moved from RAM to HDD of the virtual machine, it needs to be loaded first. We can currently load up to 5 snapshots at a time. With version 3.0.5, thanks to updated algorithm, the load time is up to four times faster than with previous version.
If you have found this article resourceful, please follow our company’s LinkedIn or Blog. There you can find more content emerging. You would like to test our platform and observe how it can assist you in more efficiently managing your network? feel free to contact us through our web page www.ipfabric.io.
Today we’re announcing the release of IP Fabric 2.2.4. A network security oriented release, the new version enables you to troubleshoot the paths through firewall clusters, to have deeper insights into routing convergence and redundancy, or to prepare or verify migration changes to 802.1X among other enhancements.
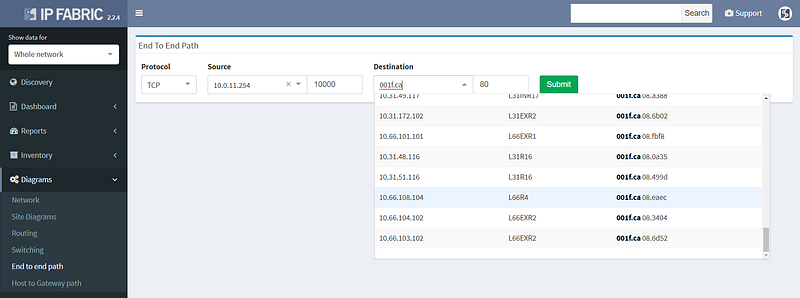
We’ve started by improving the user interface to End to End path lookup, simplifying to the usual combo of source and destination parameters. Typing hostname or IP or MAC address into the source or destination fields looks up the endpoint as you type, greatly simplifying the experience while keeping the most frequently used endpoint identification parameters. The previous lookup tables were much richer in information, but practically the additional information was more related to host location than end to end paths, and therefore seldom used.
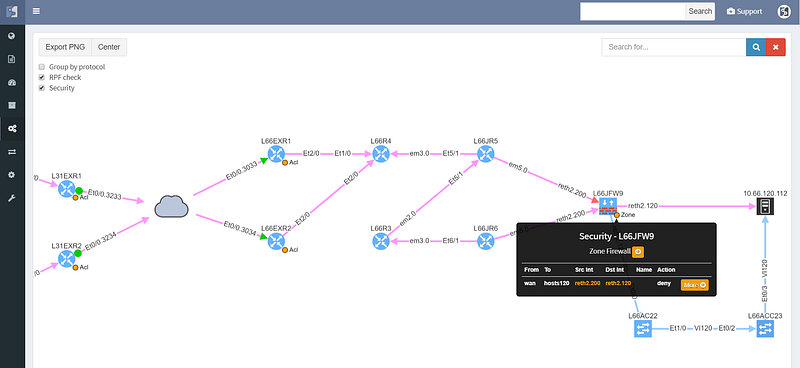
Simplifying the user interface was necessary to add L4 parameters of protocol and port, which are now used to calculate the resulting security decision though all of the access-lists or zone-based firewalls on the path. This enables to better troubleshoot complex paths throughout the network. For example, when a user reports that they are not able to access an app on a specific port, you can instantly check if they are allowed to access an app in the first place, and how all do possible paths look like from source to destination, including whether might be an issue with load balancing or missing path symmetry. Of course, to be able to do that, we have to have not only model of routing, but also of traffic filtering mechanisms. These have now been expanded to support zone-based firewalls and clusters.
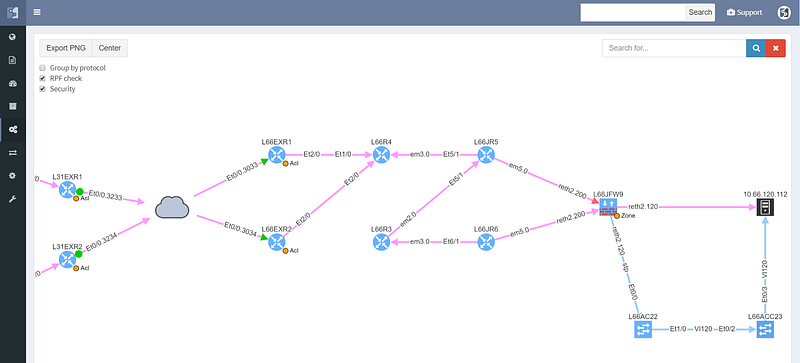
The cloud represents transit outside of administrative domain, such as MPLS carrier or DMVPN, usually a WAN. There is a missing path towards R3, and weird routing going on at R6 that should also be looked at. The WAN routers have egress and ingress filtering on the path that is permitting the communication (green color), however the cluster itself is dropping the packets (red color), so while the routed and switched path is built correctly, the traffic from this particular source/destination combination will never reach it’s destination.
Security rules for path visualization enable drill-down to the zone firewall policy details

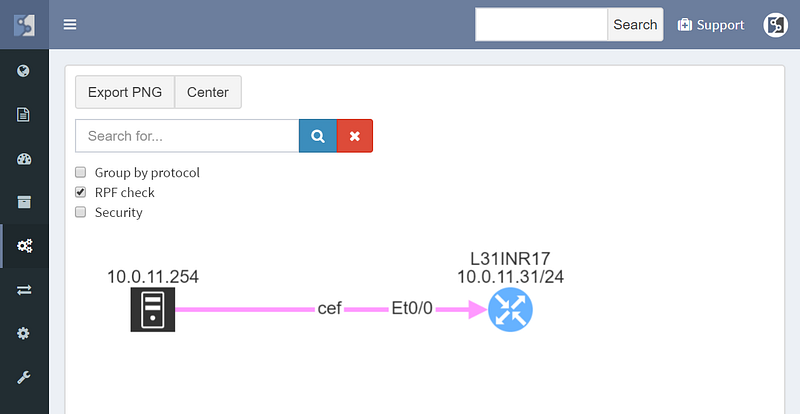
Path lookup was quite useful even in preparation of this demo. The connectivity to the end hosts wasn’t working, and the traceroutes from various points seemed to end in the MPLS cloud. Plotting the end to end path in IP Fabric immediately showed that the route at the source is missing, since the path stopped on the ingress router.
From there it was a matter of checking the cumulative routing table using routing lookup for the particular destination, which showed that no BGP routes can route these prefixes.
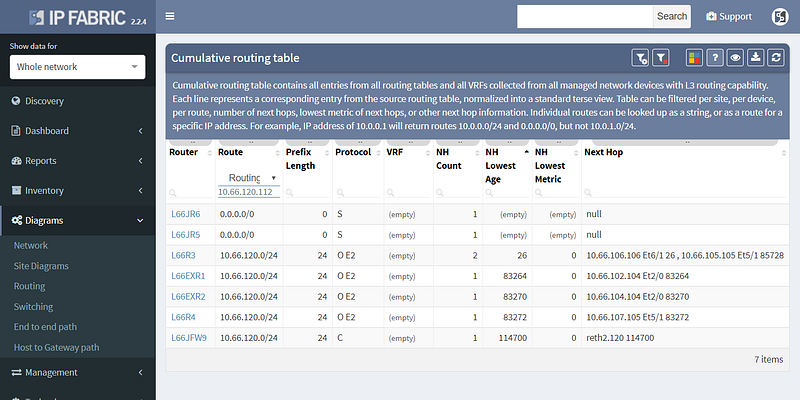
This pinpointed the problem to redistribution, since IGP had the route and BGP didn’t, and led to a quick fix.
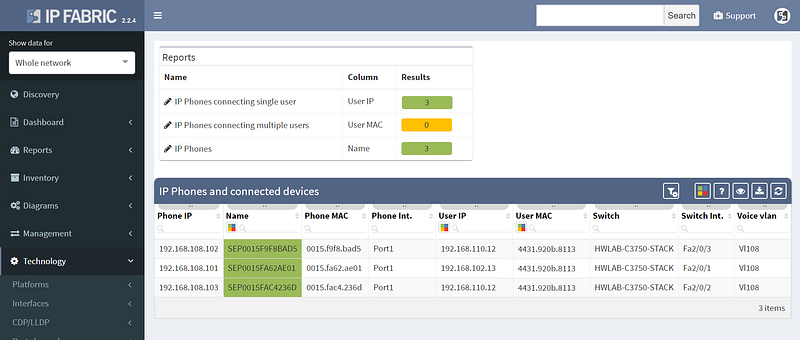
Other improvements in this release include improved 802.1x analytics, addition of STP guard tables, and usability improvements such as DNS resolution for hosts and voice VLANs for IP Phones.
However not all of the improvements were aimed squarely at analytics, as we’ve also added support for LDAP authentication to the platform, so you won’t have to remember the additional password.
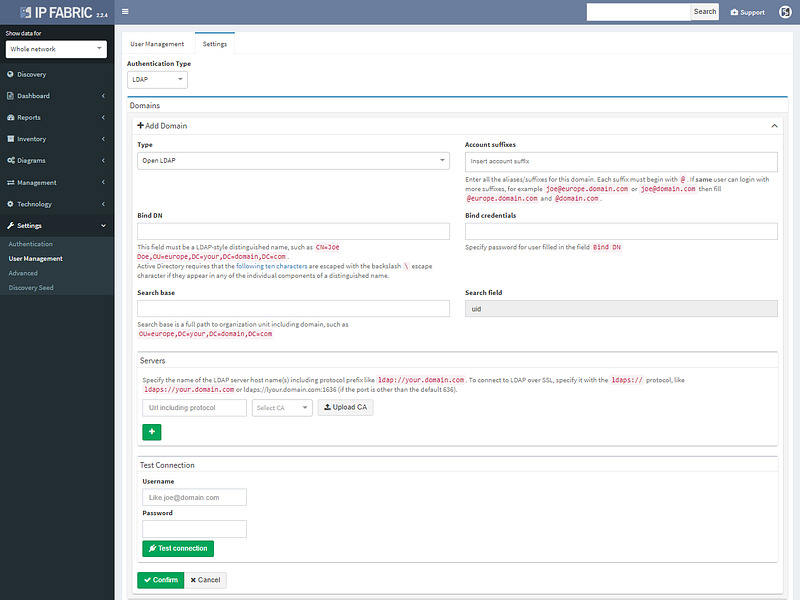
LDAP authentication supports Open LDAP or Microsoft AD.
We’ve also added restrictions per subnet for authentication credentials, so they can be specified more granularity for extensive administrative domains. The full list of changes is in the release notes at https://docs.wordpress-625423-2416527.cloudwaysapps.com/releasenotes.html. If you have IP Fabric installed, you can perform online or offline upgrade through the administrative interface following the guide.
If you’re interested in learning more about how IP Fabric’s platform can help you with analytics or intended network behavior reporting, contact us through our website, request a demo, follow this blog or sign up for our webinars.


