
 Blog
Blog Every tool in your network stack is saying that “traffic is allowed,” but one of your applications is still failing. You’re not alone; every network engineer’s been there.
As a network engineer, your job is to ensure that your applications are always available to your users. These users don’t care about underlying network controls like VRFs or BGP; they just want their applications to be fast, reliable, and secure. That means it’s up to you to map your cloud and network constructs to your critical applications.
Common Challenges With Mapping Application Dependencies
In most enterprise network environments, there are several teams looking after the IT stack. You’ve got the network team, the cloud team, the application team, and so on. Each of these teams have different systems, different knowledge, and different documentation, but they’re all trying to grasp how the whole infrastructure hangs together to deliver critical services.
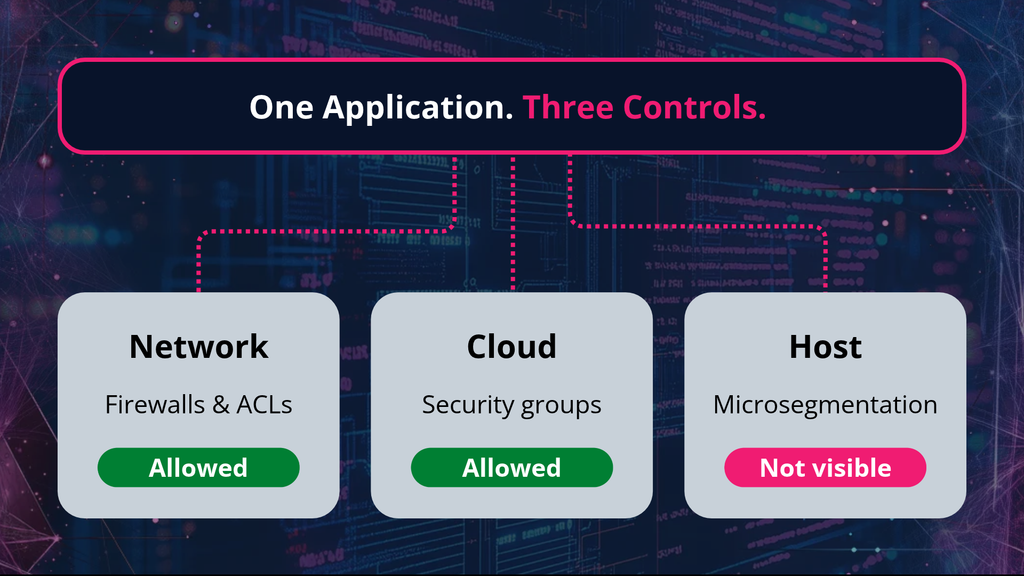
Imagine that your network and cloud are configured correctly, but a host-level microsegmentation policy is not. How would you track that down? Well, you’d have to look at every team’s platform, and make inferences to fill in any gaps between them. But even after hours of piecing it all together, you still wouldn’t have a cohesive or reliable picture of how your on-prem, cloud, and host-level controls work together to deliver your applications.
What you need in this situation is one tool to bring all of that data together and correlate it so that you can get the whole truth—which is exactly why we’ve built application infrastructure mapping into IP Fabric’s platform.
If you know IP Fabric, you know that we create a model of your observed cloud and network behavior. Now we’ve added application context to that model, which means you can ask our MCP server questions like:
- Why isn’t my application working?
- What infrastructure does this application depend on?
- What could break if I change this network or cloud component?
- Is this application properly segmented and compliant?
Read on to learn more about how you can use IP Fabric to map application dependencies, and what you can do with those dependencies once you have them.
How To Map Application Dependencies With IP Fabric
Before you can start mapping application dependencies to your infrastructure, you need to prepare raw application data. Many organizations already have this data stored in microsegmentation platforms like Illumio, Datadog, Dynatrace, or Guardicore. It’s also common to use the data in application performance monitoring tools or CMDBs.
Once you have your application data at the ready, follow these four steps:
- Ingest application data into IP Fabric via supported integrations (e.g. Illumio), open API, or manually curated CSV files.
- Wait a few seconds for IP Fabric to automatically calculate the flows for your target application.
- Drill down into each flow to identify associated workloads and devices.
- Run an end-to-end analysis on that particular flow to see the full path a packet takes from your target application to underlying cloud and network infrastructure.
Here’s a sneak peek at what your troubleshooting process could look like using IP Fabric’s application infrastructure mapping capabilities via the MCP server:
Transcript
My name is Mike Aragon. I’m a solutions architect with IP Fabric with a background in network tooling and observability. And I’m going to talk a little bit about my background because application visibility to me always meant flow and packets with application metadata. So, if you wanted to know what an application was doing on the network, you enabled flow and it provided a lot of useful information. And with NetFlow, you can understand what applications were on your network, how much traffic, you know, where the traffic was going in a general sense. But there were some fundamental challenges with this approach. It’s not because the tools were bad, but the data itself is challenging to work with and even more challenging in today’s, you know, multi-endor landscape.
So I’ve created a few illustrations and to kind of show what this data inconsistency looks like. And and this you can see the core router exports you know net flow version 9 with embar 2 app ids but the egress interface comes back at zero. The access switch gives you sflow. That’s a sampled frame and not a flow. You know bytes are an estimate. There’s no application field at all. The firewall it speaks IP fix with its own vendor specific nuances. Bite and packet counts, you know, land in reverse direction fields. So the forward fields read zero. Interface indexes are zero because a firewall doesn’t model them. So you have three records. The field names drift, the field meaning drifts. And if you look at where the gaps are, they’re not nulls, they’re they’re zero. So a collector can’t really always tell none from zero. So it maps them as real values, you know. So every router, switch and firewall family does this a little differently and and so does every model even within the same vendor. So your Cisco firewall, your Cisco router, your Cisco switch are going to export this information differently.
So then you have the DPIs, right? So how do you detect applications? You have Cisco I I just listed three here, but Cisco, MBAR, you know, Cosmos and IPO. These these labels are are illustrative, but the pattern isn’t. So you have short tokens on one engine, protocol fallbacks on another engine, maybe even marketing names on an engine, and there’s maybe even a little literal zero if something doesn’t get classified. So even with a handful of applications, there’s really no shared tonomy. So your normalization efforts become guessing and the next application signature update when you update your DPI could break and you know change everything.
And I’m going to switch to my browser here to show you a little bit of what the IP fabric data looks like here. So, here’s really why it matters, you know, a lot more today than it did, you know, 5 years ago. When you hand inconsistent data to an AI model, you don’t get a slightly worse answer. You get a really confident answer built on fields that that meant, you know, three different things, you know, and the common term everyone uses is it’s a hallucination, but it’s a real challenge when you’re working with AI models in our experience is that, you know, it starts with the data, not the model.
So IP fabric’s approach is kind of the opposite of the collector problem. We give you one normalized model, device inventory, a clean connectivity matrix. So in this particular view you can see how everything is connected. We show you routing and forwarding behavior and security enforcement from a firewall policy. I’ve got some different policies here and we bring all the security policies into a normalized view. So this is a zone firewall policy. This is a an access list the standard ACL. This is a a cloud security policy. So three very different animals in a very normalized data model which makes it great for feeding this into AI. So you know a clean contextual data means you get deterministic output and that’s what makes it you know really great for for AI.
So backing up to application infrastructure mapping. So in our MVP, this is what we’re giving you guys out of the box. This kind of our first launch. We’re going to show you applications, flows, workloads, and devices and how all these things are interconnected and and interdependent on each other. So for example, I can ingest the applications from external data sources such as Alumio and as Darren mentioned, we’re going to be adding others. But you can also through automation or manually ingest application information. We’re going to show you the flows associated to a given application and these flows are actually not calculated at snapshot time. So in our digital twin model we run snapshots. We capture all the data in the state of the network at a given point in time. But we’re not calculating these flows. We do understand how many they are. But if I were to click on this button here, this is going to calculate the flows in real time and it’s going to calculate all the flows for the HR system application. And it runs really fast. You can see that didn’t take very long. And that now gives me the ability to determine the number of devices and and workloads associated to that flow. So I can drill into these different views and understand you know for a specific application what network devices are affected. I can look at the specific workloads for those. And if I want to look at the individual conversations I now have all those flows that I can run our our standard you know end toend hopbyhop analysis on this to see the full the full path. So these are really interesting views to see within our tool. Of course we make this data very accessible through our a API and and most commonly nowadays it’s it’s being used very heavily through our MCP server integration. So this is kind of the the the key deliverables for the MVP.
Just a little bit about what’s under the hood. If we go into our discovery settings, once you have AIM enabled, you’ll have this application mapping menu within the discovery settings and that allows you to plug in your integrations with your micro segmentation and APM providers. You can manually insert applications. You can do it via CSV. All these things can also be done via the API like we mentioned. You can build the workloads. Workload in IP fabric is is a kind of a a unique term compared to how we normally operate. Try to think compute when you see the workloads and then of course we can ingest flows as well. So your five tuple source destination source port you know ephemeral port and destination port protocol so that we can run those path lookups. So, you know, the easiest way is obviously to integrate with your your providers to understand this information really quickly and that enables these views.
So, I’m going to segue and do some live prompts with you guys and show you what this would look like using claw desktop.
So you should be able to see my anthropic claude view now. And the first prompt I gave it was just to check the time stamp of the most recent snapshot. I like to make sure I understand when the data was collected for the queries. But I’m going to run a few really basic things to inquire about application infrastructure mapping. And I’m going to start with just asking it to show me the applications. So, show me the applications in IP fabric and I’m using the basic sonnet model nothing complex here.
So now we have a list of the applications and the details and I can query from here. Maybe I want to understand the network devices associated to a specific application. So I’m going to prompt it to list the network devices handling the use the instant payments. Fix my typo. So now we can understand what devices are handling the traffic for this particular application with a single prompt. And now I have the list of devices. Maybe I need to do an upgrade on the software for a specific device. I can ask the reverse question. What applications depend on this hardware device and with the flow information, we can run path simulations in AI as well and get really detailed information quickly.
So I’m going to give it another prompt asking it about the a specific end to-end path simulation. So I’m going to ask it to show me the I I’ll ask it about the flows first. The TCP 443 will focus on HTTPS flows for the instant payments application. So we can pull all the same information out. This allows you to infranchise all the data and your network data model really easily in a natural language to your entire organization.
So now that I can see the flows, I may want to understand the path and the connectivity for specific flows. I’m going to give it another prompt just to show me the path. Let’s do run and end in path analysis source source IP destination IP I’ll say using 443 for the instant payment application I didn’t typo anything there. Let’s let it go.
So, these path simulations are probably one of my p favorite features in IP Fabric. When you’re using Net Flow tools, they’re very dependent on the instrumentation. So, how you bolted everything together. IP fabric discovers your network as it’s actually connected. So you don’t have to guess, you know, what interface is connected to what and worry about your flow records actually showing the correct in interface and out interface and switched path. We already know all that information and now we can run these simulations and build diagrams over top of this data. So really quickly giving you an accurate view of how from source to destination a packet travels through the network. So now you can see the full path, the interface details, the device names and everything in your standard LLM interface.
So I could even ask it about the workloads. But as you can see here, this is really easy to to really get information from IP fabric using our MCP server. The sky is really the limit there. I’m going to switch to back to my browser and just show you a few cool artifacts that I’ve made with AI using application infrastructure mapping data.
So because our data is very clean and contextual, AI does a phenomenal job at building rendering the data in in very interesting ways. So I’ve built this just with some standard prompts to to render this in a 3D fashion so I can understand how devices are interconnected. This is kind of a cool you know 3D version. I can see you know the application what devices it actually traverses. These bars are actually devices. So this this is really powerful output using our clean data model. I did another simulation for the end toend path. So I had the the model load all the paths. So I have every single path for a specific applications loaded. I can switch back and forth between these different paths and and view, you know, all the network devices. And it even it even gives me a cool hop by hop simulation so I can see the packet as it traverses each device.
So that really allows us to answer those questions you know which which apps depend on this device or path you know what’s reachable if the work workload is breached what controls does my app rely on you know can we prove isolation is actually enforced you can always get there through the UI workflows but it’s really cool to use our MCP server too so that’s kind of the AIM MVP it’s the foundation where applications become you know first class objects and IP fabric built on a clean contextual model. You know this milestone kind of sets the stage for a lot more to come with intent validation to segmentation drift as we adopt more micro segmentation and APM integrations for application infrastructure mapping. So let us know if you have any any feedback or questions and thank you all so much for your time today.
4 Use Cases For Application Infrastructure Mapping
With data on application dependencies so easily accessible, you or your AI agent can quickly pinpoint any risks to application security, resilience, or performance. This manifests in four key use cases, some of which we’ve touched on already: troubleshooting, change management, security / regulatory compliance, and AIOps / automation.
Security & Regulatory Compliance
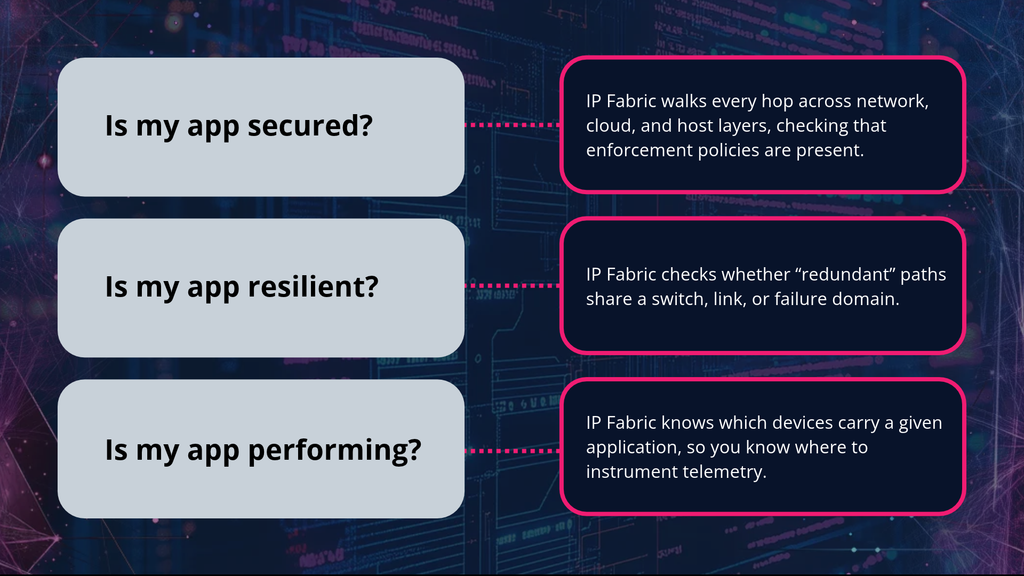
When you ask “is my network working as intended?” you’re really asking “are all my applications secured?” And the way we answer that is simple: we walk through every hop of every path for every application to see that your policies are properly enforced. IP Fabric does this by giving you a single vantage point to prove that all manner of security controls (e.g. ACLs, BGP routing, firewalls, segmentation policies) are behaving exactly as you intend them to across across on-prem, cloud, and host-level environments.
Change Management
When you know which flows and devices that each application depends on, you can more accurately predict the impact a change could have on application behavior. Before you make a change, you can ask yourself “Do these applications share any common infrastructure? If I change anything in that common infrastructure, will it affect application behavior or resilience?” Pose these questions to IP Fabric’s MCP server, and you’ll get a detailed report on which devices and paths your applications share, as well as which applications could be affected if any of those components were to fail.
Troubleshooting
If an application is failing, or a workload is breached, you’ll want to restore critical services as quickly as possible. With an application-aware network model available on demand, you can pinpoint every flow, workload, and device that affected applications depend on. For example, if multiple applications were failing at once, you could ask IP Fabric’s MCP server to pull up all the common points of the network that they share. Now, instead of spending hours hunting for the root cause, you can find it in a matter of minutes.
Network Automation & AIOps
When you train AI agents on unreliable data, you tend to get unreliable results. If you want to entrust an AI agent with any of the above use cases, it must have easy access to clean and contextual data on application dependencies. IP Fabric’s normalized data model is validated against your actual cloud, network, and application behavior, so when you query the MCP server, you’re querying this model directly. This results in consistent, deterministic outputs that your AI agents can rely on to push changes, troubleshoot issues, automate compliance audits, and more.
Transcript
Well, thank you everybody for for coming and joining us this afternoon in Europe. I think it’s it’s bright and early in the morning where where Mike is over the other side of the pond to this this webinar where we’re going to talk a bit about a new capability in IP Fabric. We call it application infrastructure mapping. And I mean this this kind of slide kind of gives it away what it’s all about. We could probably just go home to be honest with you, but what we wanted to do was dig a little into what it is, why it is, how it works, and and to give you a flavor of how you can use it. I suppose I wanted to start with the the motivation really why it is that we we chose to do this.
For those of you who know IP Fabric already, you’ll know what we are and what we do. It’s we we talk the game about network assurance. This is all about understanding what a network does and being able to measure that and then and then compare that with the way that you wanted it to be. But what we want to dig into a little is what we mean by intent in that sense. What what is it that’s the intent for the network? as as a network practitioner, you know, what we do is we look at our network in terms of devices and cables, in terms of protocols and addresses, but every VLAN, every subnet, every firewall rule is there for a reason. It’s almost like a fossil record of all of the changes that have happened through the network and and they’ve been put there for a purpose, but sometimes we lose sight of what that purpose actually is. Now for me it was always about making sure that the the network was available. But what again does that mean to a user? They do not care about things like VRFs or things like BGP. What they care about is something completely different that the applications that they use are delivered. that deliver securely, reliably, and fast because they have to service customers. And the customers are who give a business the money for the services that they’re buying, right? And and and fundamentally, that’s the the tension we’re trying to address. The challenge is, of course, how do you map all of those network constructs, all of those things to the applications that service customers?
Now, in real network environments, what you have is a bunch of different teams looking after a bunch of different capabilities across the IT stack. You’ve got the network people, you’ve got the server people, you’ve got the application people, the the load balancer people, the security people, all with different systems, all with different knowledge and all with different documentation trying to to to grasp how the whole infrastructure hangs together to deliver these application services. Great example is security. Security is not just one thing. You can see here we talk about security in the network which might be firewall rules and ACL. You talk about security in the cloud which is the security groups that will be applied to to to groups of of workloads. And of course now you’ve got this this newer capability of of host security managed with these micro segmentation platforms. And it could be that an application sits on the network and the network’s configured fine and the cloud is configured just fine, but the host micro segmentation policy is not configured correctly. How would you track that down? Well, you’d have to walk through every step, look at every different platform and pull together all that information to know. What you need is one tool to bring all of that data together to correlate it to reconcile that and give you the whole truth.
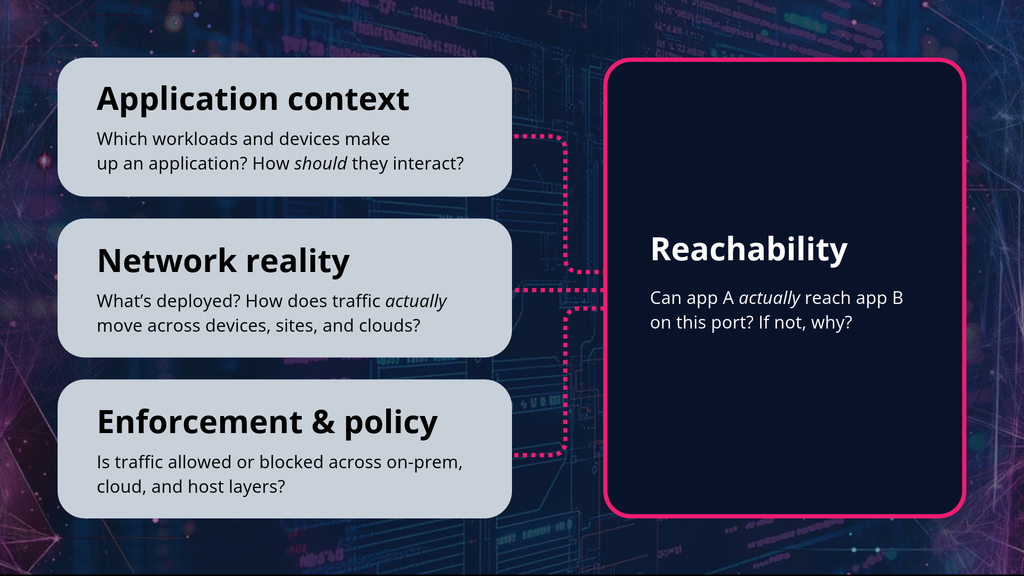
So that’s what application infrastructure mapping is doing today to to IP fabric. Again, if you know the platform, you know that we have the reality of the network in our data model already. We have the topology. We have the understanding of what it takes to to to trace a path through that topology. We know what security looks like in the network. We already have that discovered and in our snapshots. But what we’re introducing is this ability to to add application context. So which workloads make up an application, how they interact and what that what those interactions look like, how many of you know if they’re in parallel, if they’re sequenced, whatever it is to understand how an application functions and then to look at the the policy that’s enforced as part of that application build right down to the host itself. So we can appreciate whether the host firewalls themselves are allowing the traffic to pass. All of that just to answer the one question, can this application work? And if not, why? And what is stopping it? We want to be able to bring all of that that knowledge together to give you the answer to that question.
So what we’re going to do is we’re going to ingest application data into IP fabric into this this this AIM layer that that sits on top of the the the network model right now as of 8.1 which was released in the last couple of weeks. Elumio is our first supported integration. This is a micro segmentation platform that has information about your application flows and about your workloads. So, we’re going to pull the information through from Alumio natively. You can point us at your Alumio instance and we’ll gather that for you. But as well as doing that, we’ve opened up an API endpoint so you can script your own import from any platform into IP Fabric and we have an a manual import through the UI where you can literally import CSVs if you want to to to bring that application data, those flows and those workloads into IP Fabric to overlay over to over the network. We do have some more native integrations under development as you can see. The next will actually be Dino Trace. That’s an APM tool, but they guard and data dog are on their way and others will follow as they become apparent that we we need to do them for our customers.
And once we’ve done that and we’ve overlaid that onto IP Fabrics data, we can then start to answer those three questions we talked about. Is my network working as intended? Well, what that means is are my applications secured? And the way we answer that is simple. We walk every hop of every path for every application and we can check that that enforcement that you expect to be there is there. Whether that’s in the network, whether that’s across the cloud or whether that’s in host micro segmentation policy.
The the second question we wanted to ask was is the app resilient? Well, we can already do that for the network. We already show the the where the single points of failure. We already show information about topology. But now what we can do is look at individual paths and say well actually if I’ve got if I’ve got a multiple a set of paths do those paths share any common pieces of infrastructure and if they do what would happen if I were to lose that? Would it affect the behavior of the application or or not? So it gives us an answer to that question about resilience. And we can even start to address the performance piece as well. While we don’t watch live traffic, what we do know is where those that traffic is going to flow. So we know which devices carry the application. And so if you’ve got your te telemetry in place for your your application performance monitoring, we can tell you where and how to configure that.
And that kind of shows up in in three main areas as we’ve identified here. You can answer these kinds of questions. What infrastructure does this application depend on? Where where am I going to see those application flows? And then what would break if I changed any of those components? You know, you’ve got two sides of the same question there. Because you know and understand those dependencies, you can understand the risk of making change and the the understand when you come to troubleshoot a problem where to look. So if this application is failing right now, where do I go to try and identify what’s going on there? Especially if I’ve got multiple applications failing, I can go and look at the common points in the network that they touch. And then from a compliance perspective, I can start to answer questions like actually this application is it properly segmented? Does my PCI infrastructure live behind the correct firewalls and with behind the correct firewall policy? These are the kinds of questions that we’re going to be able to answer. So really what we’re doing is we’re stopping you from having to guess. We can and or or having to go and and collaborate with your teammates in order to understand what’s going on here. We’re giving you the the network facts and then we’re laying this application view on top which allows you to and it mentions here your AI that could be your UI in it could be you sitting in front of the product. It could be that you script and automation that uses this data but also once you get to AI and correlation you’re able to bring this application data into a wider conversation about the behavior of the network.
I’m going to hand you over at this point to my colleague Mike. Mike has a very particular perspective that’s really really useful to to understand here. So Mike, I’m going to stop sharing. And if you want to to pick up from there, I’d appreciate it. Thanks for everyone for listening so far.
All right. Thanks Darren so much. Get my slides shared out here.
So again, hello everyone. My name is Mike Aragon. I’m a solutions architect with IP fabric with a background in network tooling and observability. And I’m going to talk a little bit about my background because application visibility to me always meant flow and packets with application metadata. So if you wanted to know what an application was doing on the network, you enabled flow and it provided a lot of useful information and with net flow you can understand what applications were on your network, how much traffic you know where the traffic was going in a general sense but there were some fundamental challenges with this approach. It’s not because the tools were bad, but the data itself is challenging to work with and even more challenging in today’s, you know, multi- vendor landscape.
So I’ve created a few illustrations and to kind of show what this data inconsistency looks like. And and this you can see the core router exports, you know, net flow version 9 with embar 2 app ids, but the egress interface comes back at zero. The access switch gives you sflow. That’s a sampled frame and not a flow. You know bytes are an estimate. There’s no application field at all. The firewall it speaks IP fix with its own vendor specific nuances. Bite and packet counts you know land and reverse direction fields. So the forward fields read zero. Interface indexes are zero because a firewall doesn’t model them. So you have three records. The field names drift. the field meaning drifts and if you look at where the gaps are, they’re not nulls, they’re they’re zero. So a collector can’t really always tell none from zero. So it maps them as real values, you know. So every router switch and firewall family does this a little differently and and so does every model even within the same vendor. So your Cisco firewall, your Cisco router, your Cisco switch are going to export this information differently.
So then you have the DPIs, right? So how do you detect applications? You have Cisco I I just listed three here but Cisco MBAR you know Cosmos and IPO these these labels are are illustrative but the pattern isn’t. So you have short tokens on one engine protocol fallbacks on another engine maybe even marketing names on an engine and there’s maybe even a little literal zero if something doesn’t get classified. So even with a handful of applications, there’s really no shared tonomy. So your normalization efforts become guessing and the next application signature update when you update your DPI could break and you know change everything.
And I’m going to switch to my browser here to show you a little bit of what the IP fabric data looks like here.
So, here’s really why it matters, you know, a lot more today than it did, you know, 5 years ago. When you hand inconsistent data to an AI model, you don’t get a slightly worse answer. you get a really confident answer built on fields that that meant, you know, three different things, you know, and the common term everyone uses is it’s a hallucination, but it’s a real challenge when you’re working with AI models in our experience is that, you know, it starts with the data, not the model.
So IP fabric’s approach is kind of the opposite of the collector problem. We give you one normalized model, device inventory, a clean connectivity matrix. So in this particular view you can see how everything is connected. We show you routing and forwarding behavior and security enforcement from a firewall policy. I’ve got some different policies here and we bring all the security policies into a normalized view. So this is a zone firewall policy. This is a an access list just a standard ACL. This is a a cloud security policy. So three very different animals in a very normalized data model which makes it great for feeding this into AI. So you know a clean contextual data means you get deterministic output and that’s what makes it you know really great for for AI.
So backing up to application infrastructure mapping. So in our MVP, this is what we’re giving you guys out of the box. This kind of our first launch. We’re going to show you applications, flows, workloads, and devices and how all these things are interconnected and and interdependent on each other. So for example, I can ingest the applications from external data sources such as Alumio and as Darren mentioned, we’re going to be adding others. But you can also through automation or manually ingest application information. We’re going to show you the flows associated to a given application and these flows are actually not calculated at snapshot time. So in our digital twin model we run snapshots. We capture all the data in the state of the network at a given point in time. But we’re not calculating these flows. We do understand how many they are. But if I were to click on this button here, this is going to calculate the flows in real time and it’s going to calculate all the flows for the HR system application. And it runs really fast. You can see that didn’t take very long. And that now gives me the ability to determine the number of devices and and workloads associated to that flow. So I can drill into these different views and understand you know for a specific application what network devices are affected. I can look at the specific workloads for those. And if I want to look at the individual conversations I now have all those flows that I can run our our standard you know end toend hopbyhop analysis on this to see the full the full path. So these are really interesting views to see within our tool. Of course we make this data very accessible through our a API and and most commonly nowadays it’s it’s being used very heavily through our MCP server integration. So this is kind of the the the key deliverables for the MVP.
Just a little bit about what’s under the hood. If we go into our discovery settings, once you have AIM enabled, you’ll have this application mapping menu within the discovery settings and that allows you to plug in your integrations with your micro segmentation and APM providers. You can manually insert applications. You can do it via CSV. All these things can also be done via the API like we mentioned. You can build the workloads. Workload in IP fabric is is a kind of a a unique term compared to how we normally operate. Try to think compute when you see the workloads and then of course we can ingest flows as well. So your five tuple source destination source port you know ephemeral port and destination port protocol so that we can run those path lookups. So, you know, the easiest way is obviously to integrate with your your providers to understand this information really quickly and that enables these views.
So, I’m going to segue and do some live prompts with you guys and show you what this would look like using claw desktop.
So you should be able to see my anthropic claude view now. And the first prompt I gave it was just to check the time stamp of the most recent snapshot. I like to make sure I understand when the data was collected for the queries. But I’m going to run a few really basic things to inquire about application infrastructure mapping. And I’m going to start with just asking it to show me the applications. So, show me the applications in IP fabric and I’m using the basic sonnet model nothing complex here.
So now we have a list of the applications and the details and I can query from here. Maybe I want to understand the network devices associated to a specific application. So I’m going to prompt it to list the network devices handling the use the instant payments. Fix my typo. So now we can understand what devices are handling the traffic for this particular application with a single prompt. And now I have the list of devices. Maybe I need to do an upgrade on the software for a specific device. I can ask the reverse question. What applications depend on this hardware device and with the flow information, we can run path simulations in AI as well and get really detailed information quickly.
So I’m going to give it another prompt asking it about the a specific end to-end path simulation. So I’m going to ask it to show me the I I’ll ask it about the flows first. The TCP 443 will focus on HTTPS flows for the instant payments application. So we can pull all the same information out. This allows you to infranchise all the data and your network data model really easily in a natural language to your entire organization.
So now that I can see the flows, I may want to understand the path and the connectivity for specific flows. I’m going to give it another prompt just to show me the path. Let’s do run and end in path analysis source source IP destination IP I’ll say using 443 for the instant payment application I didn’t typo anything there. Let’s let it go.
So, these path simulations are probably one of my p favorite features in IP Fabric. When you’re using Net Flow tools, they’re very dependent on the instrumentation. So, how you bolted everything together. IP Fabric discovers your network as it’s actually connected. So you don’t have to guess, you know, what interface is connected to what and worry about your flow records actually showing the correct in interface and out interface and switched path. We already know all that information and now we can run these simulations and build diagrams over top of this data. So really quickly giving you an accurate view of how from source to destination a packet travels through the network. So now you can see the full path, the interface details, the device names and everything in your standard LLM interface.
So I could even ask it about the workloads. But as you can see here, this is really easy to to really get information from IP Fabric using our MCP server. The sky is really the limit there. I’m going to switch to back to my browser and just show you a few cool artifacts that I’ve made with AI using application infrastructure mapping data.
So, because our data is very clean and contextual, AI does a phenomenal job at building rendering the data in in very interesting ways. So I’ve built this just with some standard prompts to to render this in a 3D fashion so I can understand how devices are interconnected. This is kind of a cool you know 3D version. I can see you know the application what devices it actually traverses. These bars are actually devices. So this this is really powerful output using our clean data model. I did another simulation for the end toend path. So I had the the model load all the paths. So I have every single path for a specific applications loaded. I can switch back and forth between these different paths and and view, you know, all the network devices. And it even it even gives me a cool hop by hop simulation so I can see the packet as it traverses each device.
So that really allows us to answer those questions you know which which apps depend on this device or path you know what’s reachable if the work workload is breached what controls does my app rely on you know can we prove isolation is actually enforced you can always get there through the UI workflows but it’s really cool to use our MCP server too so that’s kind of the AIM MVP it’s the foundation where applications become from you know first class objects and IP fabric built on a clean contextual model. You know this milestone kind of sets the stage for a lot more to come with intent validation to segmentation drift as we adopt more micro segmentation and APM integrations for application infrastructure mapping. So definitely check out the resources in goldcast and and let us know if you have any any feedback or questions and thank you all so much for your time today.
Thanks for that, Mike. We have already got a couple of questions and and one of them we we should look at straight away actually. George has asked can you just go back and have a look at your instant payment flows and see where whether you got those through the manual edition of the flows or whether they were from from Illumio. George to to to the point here I suppose the the the what you’re able to do is bring these this flow information from wherever you have it. So if you have it in a a manual source in a CSV or or a spreadsheet if you have it in another tool we’ll accept it from from wherever and we’ll combine those flows as well. So if we’ve got for example Illumio with some application flows you can bring those in from there but we’ll also add more flows if you have them manually stored as well. So it it we we combine the two. Hope that answers your question but we’ll we’ll dig out the specific on that one for you. You should be able to pick that up from the recording. Just looking at any other questions.
We’ve got a few come through. So, so the first one I wanted to pick up Renata was asking whether we plan to integrate with SEC Cisco secure workload app dynamics or other Cisco solutions. And that’s a really great question, Renato. We’re we’re working quite closely with Cisco as a a development partner on a number of things including the cloud control studio. But certainly the plan is to is to be able to pull this application data from wherever you find it. So yes, secure workload was was next on our list of of micro segmentation platforms. Yes, app dynamics very much on on our list of APMs. Prioritization is what it is, but but ultimately once we’ve built the capability, bringing new vendors in in on that integration is hopefully relatively straightforward. So we should be able to do that fairly quickly. Expect we we’ve got integrations planned into the beginning of next year, but but beyond that, we would expect to start seeing others. So, I would I would hope that we’d be addressing those sort of midterm next year. I’m not making any any commitment on that, of course, but hey.
We’ve got another message from from Christopher asking if Claude is the only AI that this integrates with. No, in in short, Christopher is your answer. If you and if you want to feel free to go back and look at our previous webinars on on our MCP server capability. But essentially any agent that can consume data over MCP we can integrate with. So we use claude by default. It’s our internal tool but we do test against others and and we use all models as well right so we’ll we’ll use obviously against chat G GPT and the like but also local mod models as well. Obviously your mileage varies depending on what what’s powering the conversation but as Mike showed you before I mean he used a fairly fairly simple low-key model. And yet it was able to generate some really good good answers. Main thing re being because the quality the data is good you’re going to get you know good answers to your questions.
Just looking to see we’ve had a couple of questions asking things like does IP Fabric replace the AP a APM tool? The short answer is is no on that one I guess. Mike having worked in the APM space, I’m sure is is sees a big difference between what IP Fabric is doing here and and what APM does, but yeah, I don’t know if you want to speak to that at all, Mike.
Yeah, no, very different very different animals there. We’re we’re ingesting the data from these these systems. We’re definitely not not replacing it. If you if you leverage an APM or even you could use a net flow analyzer to to extrapolate flows from your network and and run these simulations through IP fabric using our application infrastructure mapping feature.
Yeah, thanks for that. And and P just just your to your question. P was asking the question of of how trustworthy the AI agent answers the hallucination shortcuts question. Okay, I guess we’ve kind of touched on that. But the point here, P, is that that the MCP is really only providing the deterministic data that sits on on top of the model that comes from the model that lives in IP fabric. And so it’s only it’s only when that data is missing that things are going to potentially an agent will start hallucinating. I guess the point being here that we are we will tell you if the data is missing and so the intention being that the guidance is in place that if there’s no data don’t don’t try and guess just use the use the data you have to hand which is what comes from open fabric.
Yeah, that’s one of the big advantages, you know, having very clean tables and very well modeled data and normalized data. You know, being able to actually just do security intent through all the different firewall vendors that we support and being able to see that in a normalized fashion, whether you’re using our tool or using the API or or through MCP, you you’ll get the same output. And the the models work really well with IP Fabric for that reason, you know, because it’s very clean and organized.
And just to to follow up as well and and and following up on Christopher’s point before, you know, those models don’t have to be the frontier cloud models either, right? They they works quite happily and well with a a local LLM. we’ve we’ve got a lot of internal experimentation is around using using those local models. So for example, if you don’t want your data to leave your your environment, you can do that all on prem with a with a local model quite quite comfortably.
So now you’re showing off, Mike.
I really like this one, you know, just showing the the blast radius of the of the workload and what it’s what it’s connected to.
Yeah, and I guess that’s the point, isn’t it? That the data is there to to get all of these kind of visualizations while these visualizations aren’t in the UI of the product. This is the the joy of AI tooling, right? Is giving us this this capability to to create new ways to look at data. So, love this.
Awesome.
I just want to see if we’ve got any more questions. Yeah. No, I think we’re good. So, thanks ever so much for your time everybody for for joining us. It’s been really great to have so many questions and and hopefully been insightful to see what it is that that the MVP. So, this is the first release of of application infrastructure mapping brings. There will be more. Well, there’s a lot more capability once you bring all these things together and some of those things we touched on at the beginning in terms of the the way you can analyze your network from a whole different perspective with a different lens. This is only going to bring more and more use cases. So, watch this space. There will be definitely follow-up webinars to this hopefully with more visualizations like this. So, Mike will definitely be inviting you along for that one. Thank you very much for your time, my friend.
Benefits of Mapping Application Dependencies With IP Fabric
The biggest benefit of mapping application dependencies with IP Fabric is that it gives you and your AI agents trustworthy insights for governing your infrastructure. Gone are the days of cobbling together data from three different tools; now every team can know exactly how your network, cloud, and applications are behaving, and why.
Though we only gave you four sample use cases, you can use IP Fabric’s application-aware data model to inform virtually every decision you make about your network. Building out a service map? You can trace each critical service across on-prem, cloud, and host-level infrastructure, instead of relying on diagrams that may be months out of date. Worried about CMDB accuracy? You can check your CMDB against observed cloud, network, and application behavior. Planning a refresh or migration? You can see which applications run on each device and start with the ones carrying your most critical services.
And this is only the beginning. Application awareness is a big milestone for IP Fabric, and it sets the stage for a lot more to come. Watch this space for more on new integrations and expanded application infrastructure mapping capabilities.
Want to see what application infrastructure mapping could uncover in your environment? Contact our team to learn more!
This blog was co-written by Daren Fulwell and Mike Aragon, based on their latest webinar on application infrastructure mapping.