Operational Resilience now mandated for EU Financial Institutions
The safety and resilience of financial and credit institutions will soon be enforced by the Digital Operational Resilience Act and applicable to any of the relevant institutions doing business in the European Union.
With the deadline less than a year away (enforcement begins on 17th January 2025), enterprises need a clear path to compliance that they can implement and maintain.
DORA outlines five critical areas where organizations must adhere to technical specifications:
The overarching goal is to maintain the resilience of the financial system as a whole, minimizing disruption, and downtime, and ensuring business continuity.
What does this mean for the IT network, in the context of large enterprises? Here's three things to keep in mind as you prepare for DORA.
This regulation will bring renewed focus to identifying and classifying your critical business functions. In DORA, with respect to the financial industry, these are defined as areas where "the disruption of which would materially impair the financial performance of a financial entity, or the soundness or continuity of its services and activities, or the discontinued, defective or failed performance of that function would materially impair the continuing compliance of a financial entity." (DORA Article 3).
Ultimately, a key goal of DORA is business continuity. While it may seem very clear to network operators how critical continued network services are to the health and success of the business, in the context of a large organization, business leaders may not understand just how reliant their business is on the operational resilience of the network. A network compliance issue can be the first domino in costly, reputation-damaging business interruptions.

They don't know the scale of change (planned, and unplanned) network operators are managing day to day; they don't understand the complexity of dealing with different technologies and vendors, to satisfy ever-changing business operations; they don't understand that securing a network against a growing threat landscape is a continuous activity.
That said, as DORA compliance escalates to top priority - there are, after all, criminal penalties for non-compliance (DORA Article 52) - the network will take the spotlight as key to understand, visualize, and report on.
This fresh attention to what might have been previously relegated to "plumbing" or a cost center in the minds of leadership will unlock resources network engineers have been desperately needing for years, but also scrutiny. And let's be clear, the first question will be "Where's your network documentation?"
This leads us to point 2...
The regulations put forth in DORA make it clear that it's not enough to assume compliance - financial entities have a burden of proof, and must (both internally, and externally) continuously validate their compliance.
Exactly what this proof will look like might differ by organization (there is also a proportionality principle to note within DORA), but it includes, for example:
All this proof must be reported in the manner, and through the mechanisms specific in Pillar 2 - ICT-related incident management, classification, and reporting - and the Regulatory Technical Standards that will specify the harmonization and centralization of DORA compliance reporting.
That said, the appointed overseers and responsible parties might not be networking experts, so raw network data won't be of much use. Which brings us to point 3...
A lot of DORA is principles-based; not necessarily specifying exact policies or technologies to implement, but more so about having the right people, planning, and frameworks in place to provide continuous oversight.

It's key to note that there's a lot that must be communicated to business leaders, clients, and stakeholders in the event of an ICT-related incident, for example "to relevant senior management and inform the management body of at least major ICT-related incidents, explaining the impact, response and additional controls to be established as a result" and to "clients about the major ICT-related incident and about the measures that have been taken to mitigate the adverse effects of such incident" (Article 17).
It's easy to imagine, then, in the event of a network-based ICT-related incident, that there is specific and complicated network information that must be made available and consumable for the above-mentioned parties.
These are just three threads to pull at as DORA crystallizes into clear specifications for financial entities and the IT networks that underpin them. As the scramble to assure and prove compliance starts, we'll keep an eye on the challenges and themes emerging for network teams.
For now, the best way to prepare is to ensure that your team has a comprehensive and accurate network understanding; an accurate inventory; clear and complete documentation; a mechanism to visualize the network and its interconnections and dependencies; and a realistic and feasible way to keep this all up-to-date and therefore, useful.
For more information on IP Fabric's network assurance platform, reach out to the team or try our self-guided online demo.
To address Cobit 2019 certification we need to make sure we have an understanding of what Cobit stands for, "Control Objectives for Information and Related Technology". First of all, it was mainly focused on auditing, specifically helping financial auditors navigate IT environments. Now it is the leading framework for the governance and management of enterprise IT. It includes breadth of tools, resources and guidance. Its main value is leveraging proven practices to inspire IT innovation and fuel business success.
The network infrastructure is the most critical underlay for any applications running in enterprise environments. In addition, data security is critical to any organization. That's the reason why at least some information security standard must be incorporated. This applies to anyone who aims to keep the data well protected.
Any value created in the digital world automatically attracts those who intend to capture its value. Of course without any necessary permission. It can be a hacker or medium-skilled student with malicious intent. But it's not important who desires to access your data or why. Without following any security best practices, you are out in the open.
Moreover, in our previous post related to security audits automation, other relevant information related to Cobit can be found. In this article, we will focus on how the IP Fabric platform can assist with network security management. Further, bringing benefits to everyday operations.
At first, the IT domain needs to be perfectly specified and well-aligned with the business goals. The starting point for further security practices development in any certification is to be aware of all its infrastructure elements.
The infrastructure elements may include all active network devices (routers, switches, firewalls, load-balancers, etc.), a full inventory of end-points (virtual or physical servers) communicating on the network or entry points to the network (available physical interfaces, wireless access points and more). All in all, an up-to-date detailed inventory is the most important factor for any enablement.

For the IP Fabric platform, the full and up-to-date inventory of any elements on the network is an easy task. It provides its users with complete visibility. Moreover with multiple views and end-of-life information, with automated protocol level diagrams fresh every day. Apart from that, all data is easily exportable manually or by any integrated system via API.
The definition above relates to mapping existing information flows across routed or switched networks with clear security objectives. Firewalls with properly configured security policies are the key components in building secure networks and preventing unwanted access.
However as the network grows in complexity, more teams participate in network security policies administration. Hence, the restrictive rules may be violated with unauthorized or temporary changes on firewalls or access-lists.
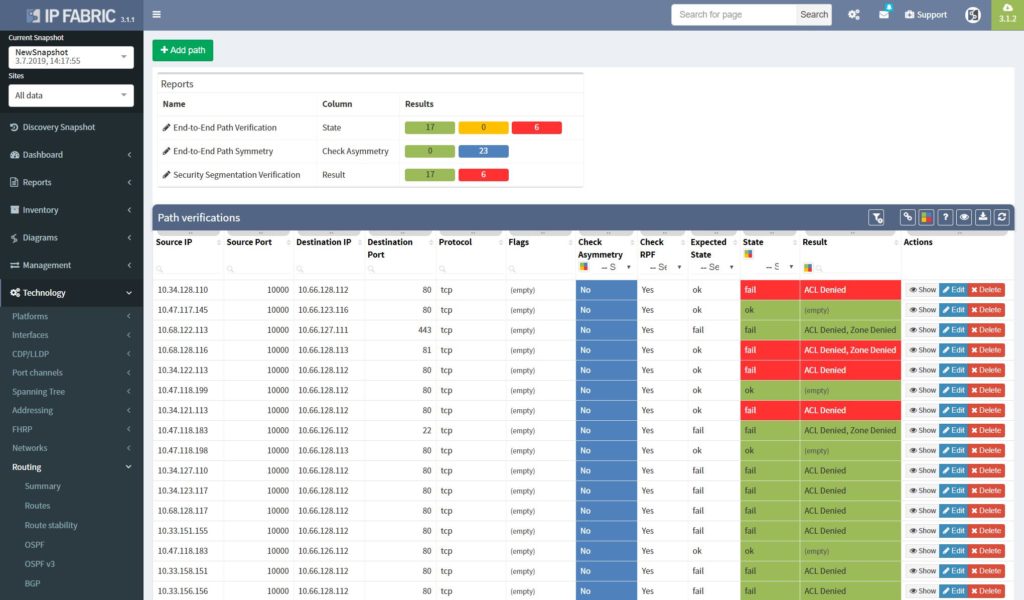
The best approach to a stable security environment that meets the high standards is continuous security policies and end-to-end path verification. In addition, with the IP Fabric platform, users are provided with the tool that can help with both. The platform reads and stores all security policies from selected vendors. As well as, immediately detecting changes and providing historical data. Besides, with the end-to-end path testing feature available, it can store hundreds of defined path checks, that are being continuously verified with every new network snapshot.
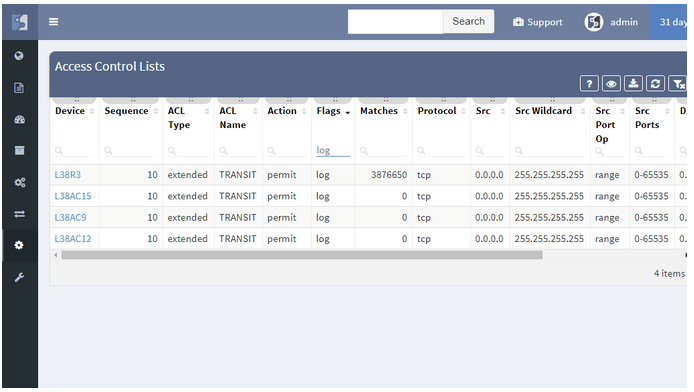
The network management misconfigurations are maybe one of the most discovered with the IP Fabric tool at the first run. What we often detect with automated verifications is legacy Simple Network Management Protocol (SNMP) configurations, old TACACS+ or RADIUS servers left in or outdated access-lists (ACL) applied to management interfaces.
If you have found this article resourceful, please follow our company’s LinkedIn or Blog, where there will be more content emerging. Furthermore, if you would like to test our platform to observe how it can assist you in more efficiently managing your network, please write us through our web page www.ipfabric.io
Transcript
Today we will go through a quick demonstration of the IP Fabric platform and its main features. The IP Fabric platform is the network management system that helps companies to empower network engineers and teams to discover, verify, and document large scale networks within minutes.
IP Fabric's lightning-quick processes intelligently discover over 3,000 network infrastructure nodes an hour and collect more than 2,000 configurational and operational state data per active network device.
The system then generates a digital model of the entire network with the switching/routing and security logic built-in. Since IP Fabric can identify both known and unknown devices, it eliminates the need for manual inventory processes in the company.
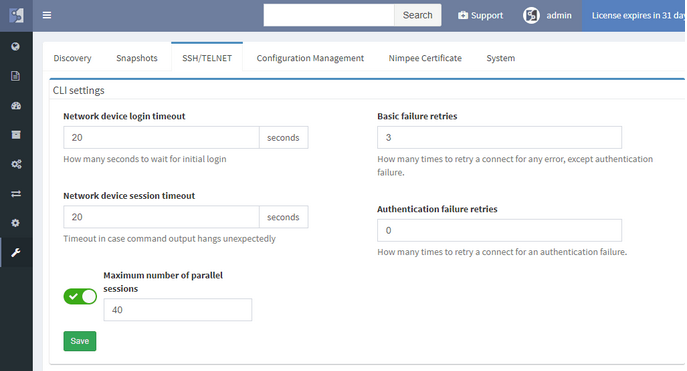
To initiate the IP Fabric platform successfully, it first needs to be installed on VMWare 5.0 or later and have an access to all infrastructure devices via SSH or Telnet with correct credentials.
Of course we can apply additional settings, such as IP subnets to include or exclude from discovery, limit the bandwidth or the number of concurrent sessions during and many other.
Once the discovery is finished we have a complete digital image of the entire network, which we call the snapshot. In every snapshot, we can run end to end path simulations, view all operational data about the network, analyze network topology maps or verify the network’s overal state with the Assurance Engine.
That is all for the introduction, now let’s get started with the demo.
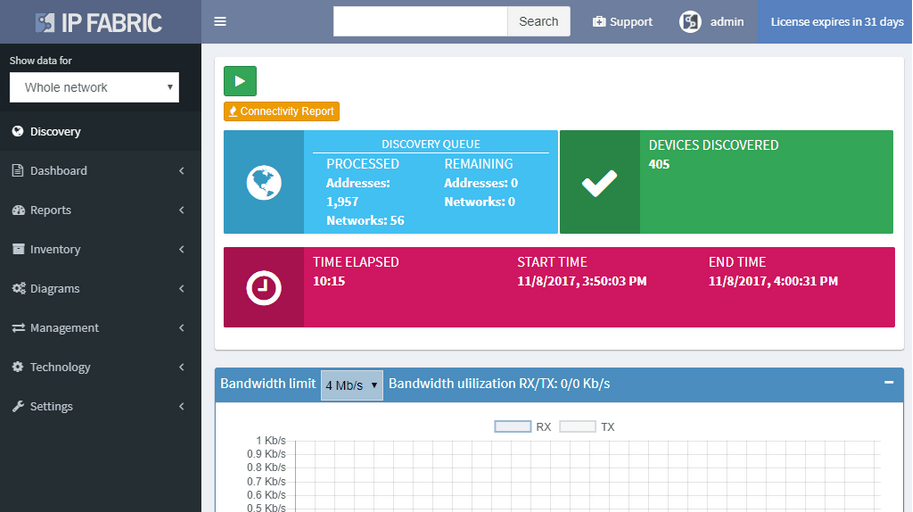
We are currently in the Snapshot management area. We have 4 snapshots loaded in the RAM memory and they are available to be explored immediately. Historical ones are stored on the Hard drive and can be loaded to RAM anytime. We can decide to add more devices to currently active snapshot or reinitiate discovery on selected devices and get the newest data.
We have the Connectivity Report which contains all IPs that the platform interacted with during discovery process, which is great for troubleshooting purposes and it underlines complete transparency that the user has when using the platform.
With our current snapshot, we discovered almost 600 devices and it took us about 10 minutes. We have the list of sites that serve as a logical groups for network devices. The user has full control over the Site Separation mechanism, sites can be based on devices’ location or function, it’s up to administrator to decide.
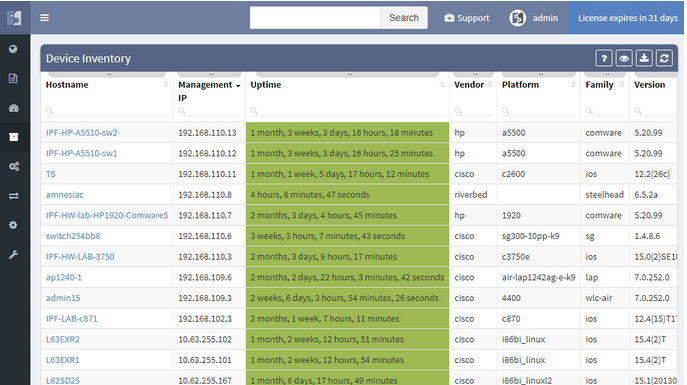
Now we will examine the inventories. We have full and very detailed visibility into all types of inventories: Devices, Interfaces, End-points or End-Of-Life milestones, which are very important for lifecycle management.
In any inventory or technplogy tables Sorting and Filtering tools are available. For example, in case I want to find all Juniper SRX devices within the inventory, I will fill in the vendor and the platform field and I have results available in seconds.
I can choose which parameters will be visible or change the columns’ order. Any filtered output is easily exportable to a CSV document and can be shared with the team. By the way, all search or filter functions available in graphical user interface are obtainable via API as well, with full documentation available online or in the platform.
MTU
Because the platform is the tool not only for viewing static data but also for analyzing behaviour of variety of protocols. Addressing any inconsistent states is very easy. As an example we can explore data for the Maximum Transmission Unit (or MTU) on all links just by few clicks.
I will search for an MTU, where we have all the information available. To discover any issues, we’ll just click on available verficiation and we have results in seconds.
Detecting inconsistent MTUs on all transit links in large scale networks can be a really time consuming to get, there can be tens of thousands links to verify.
After discovery, we only export the data and send it to operations team immediately. This type of proactive network management will help us to decrease the number of network issues in the future.
If we desire to have a visual representation of MTU results in diagrams, we will click on the site button and check for MTU in there.
OSPF
Similar applies if for any other supported technology. In the platform we can research routing and switching protocols, stacks, clusters, 802.1X, PoE, Quality of service and many many more. The IP Fabric platform is a search engine for any network.
As an example may be OSPF protocol.
We are very quickly seeing all OSPF sessions with all details on the network. By a single click we can tell if there are any sessions down or in transition state and use it for documentation purposes or for troubleshooting.
In addition we can go back in time, switch the snapshot and see historical results, which makes it an amazing tool for root cause analysis.
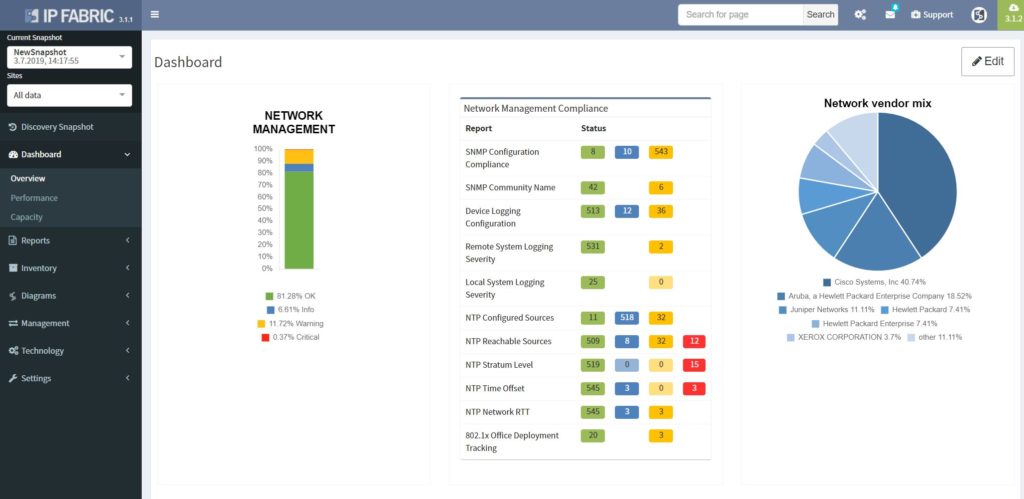
Assurance Dashboard
Last feature we would like to delve into, before we move on to diagrams, is the IP Fabric’s Assurance Dashboard, where all these verifications are displayed in one place.
IP Fabric is supplied with dozens of predefined network verification checks. These checks can be altered based on your needs, or you can create your custom ones very easily.
There are many focusing on Management protocols, Performance, Stability, Routing and Switching protocols, and we can go on..
All verifications are provided with explainers and all these results can be exported to the Network Analysis Report, which can be generated by the platfrom on demand.
Diagrams
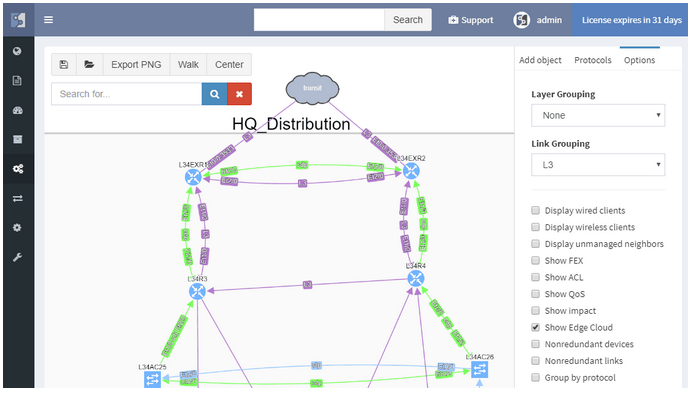
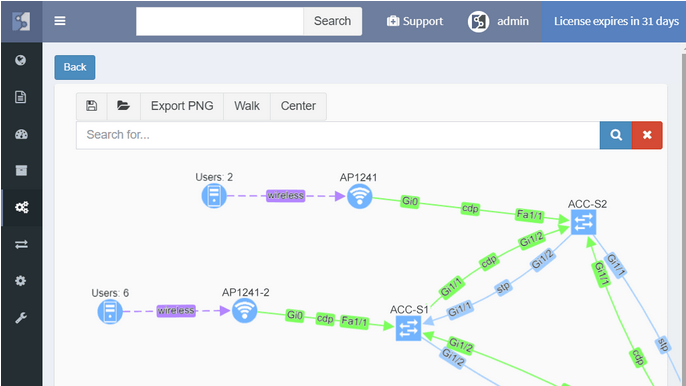
And now the Diagrams. With the IP Fabric, you have full and detailed visibility on a protocol level. There are not only physical links between devices in the topology maps but all relations between devices. If it's OSPF or BGP session, Spanning-Tree or discovery protocols.
All views and layouts can be easily modified or built from the scratch with the amazing View Builder feature. All available in a multivendor environment.
The network devices can be repositioned freely and the layout can be saved for future analysis. And the same diagram appears in the Low-Level design document, which can be also generated by the platform.
What we can quickly explore in terms of layers is Discovery protocols, which can be considered as physical layer mapping, Spanning-Tree or Mac layer and Routing protocols, all separately or together at once in a diagram.
In case we desire, for example, to track a single VLAN in the topology, we will click on any trunk link, select the VLAN number and immediately analyze which ports are in forwarding or blocking state for any particular VLAN or examine where the root bridge is.
The same we can do for any previous snapshot, we may go back in time and analyze any topology from the past!
Now a quick look at routing protocols. In the current topology, we have OSPF and BGP present, apart from that we support all mayor routing protocols including EIGRP, RIP, IS-IS or Label Distribution protocol from the MPLS environment.
By interacting with any link or node we get more detailed data, we can add the cost on OSPF links if we want to and export the topologies.
In addition we are able to visualize connected servers, IP phones or PC or wireless access-points if they are present. Then visualize QoS, Access-Lists or First Hop Redundancy protocols, detect single points of failure or non-redundant links.
End-to-End
Now we will move on to the E2E path testing. The End to End path testing can be essential for root cause analysis, verifying the post-migration state of selected application paths across the network or any ad-hoc testing related to client’s portion of the network. The IP Fabric platform enables seamless and extremenly fast path testing on the created mathematical model.
It takes literally seconds to complete standard end to end simulations for switching, routing and security portion. It is also possible to test end-to-end in MPLS networks based on labels.
So let’s test on our own:
With the path check feature, selected paths can be saved and continuously verified by the platform with every new discovery automatically.
Documentation
Maintaining network documentation may be a tedious and difficult process, that requires a vast amount of time. Which is the main reason why many companies are necessarily hiring external resources to complete the task.
To simplify the process, IP Fabric platform automates network documentation. There are currently two types of automated documents. The first one is the LLD document, which provides a detailed network overview for each business location, including topology visualization.
The second one is the Network Analysis Report, which will give you an overall report of your network, including network state checks.
If you’re interested in learning more about how IP Fabric’s platform can help you with analytics or intended network behavior reporting, contact us through our website, request a demo, follow this blog or sign up for our webinars.
International standard or ISO 27001 certification is helping organizations to better understand network and security area administration. It also defines models for increasing network and security resilience and other features.
To begin with, the network infrastructure has become more and more important for many organizations. Hence, nothing is more valuable than data being transferred between the systems or stored within the secured perimeter. That's why the information security standard should be incorporated by anyone who aims to keep the data well protected.

Furthermore, any value created in the digital world automatically attracts those who intend capturing the value without any necessary permission. It can be a hacker or medium-skilled student with malicious intent. But it's not important who desires to access your data or why. Without following any security best practices, you are out in the open.
In addition, our previous post related to security audits automation, provides other relevant information to ISO 27001 certification . Further, in this article we will focus on how the IP Fabric platform can assist with network security management. Hence, bringing benefits to everyday operations.
"ISO/IEC 27001 formally specifies an Information Security Management System (ISMS), a suite of activities concerning the management of information risks (called ‘information security risks’ in the standard). The ISMS is an overarching management framework through which the organization identifies, analyzes and addresses its information risks."
From https://www.iso27001security.com/html/27001.html
The definition above perfectly describes the starting point for further security practices development in ISO 27001 certification. However, to proceed with the next steps of the standardization, the company needs to be aware of all infrastructure elements.
The infrastructure elements may include all active network devices (routers, switches, firewalls, load-balancers, etc.). Furthermore, a full inventory of end-points (virtual or physical servers) communicating on the network or entry points to the network. These are available physical interfaces, wireless access points and more. To summarize the point, an up-to-date detailed inventory is the most important factor for any enablement.
For the IP Fabric platform, the full and up-to-date inventory of any elements on the network is an easy task. It provides its users with complete visibility with multiple views and end-of-life information, with automated protocol level diagrams fresh every day. Apart from that, all data is easily exportable manually or by any integrated system via API.
"It recommends information security controls addressing information security control objectives arising from risks to the confidentiality, integrity, and availability of information. Organizations that adopt ISO/IEC 27002 must assess their own information risks, clarify their control objectives and apply suitable controls (or indeed other forms of risk treatment) using the standard for guidance."
From https://www.iso27001security.com/html/27002.html
The definition above relates to mapping existing information flows across routed or switched networks with clear security objectives. Firewalls with properly configured security policies are the key components in building secure networks and preventing unwanted access.
However as the network grows in complexity, more teams participate in network security policies administration. As a result, the restrictive rules may be violated with unauthorized or temporary changes on firewalls or access-lists.
The best approach to a stable security environment that meets the high standards is continuous security policies and end-to-end path verifications. With the IP Fabric platform, users are provided with the tool that can help with both. The platform reads and stores all security policies from selected vendors, it can immediately detect changes and provide historical data. Besides with the end-to-end path testing feature available, it can store hundreds of defined path checks, that are being continuously verified with every new network snapshot.
The network management misconfigurations are maybe one of the most discovered with the IP Fabric tool at the first run. What we often detect with automated verifications is legacy Simple Network Management Protocol (SNMP) configurations, old TACACS+ or RADIUS servers left in or outdated access-lists (ACL) applied to management interfaces.
The operations security is clearly described in Section 12 in ISO 27002 and is essential to any environment compliant with the standard.
If you have found this article resourceful, please follow our company’s LinkedIn or Blog, where there will be more content emerging. Furthermore, if you would like to test our platform to observe how it can assist you in more efficiently managing your network, please write us through our web page www.ipfabric.io
It’s been very fruitful last weeks and months, new releases of IP Fabric platform are leaving the factory at its pace. Very big thank to all our engineers and developers for new updates, well-thought upgrades and long hours spent on the project, it’s been a pretty challenging ride so far. That’s all for latest positive appraisals and let’s move on to our topic of interest.
I already mentioned platform versatility when it comes to representation of gathered information in particular sections before, we can call them the ‘VIEWS’. Their modification capabilities are very straight forward. But let me provide you with one hidden feature. For instance, try to hover over the column title with colored content, that would provide you with more sorting options (what a handy one).
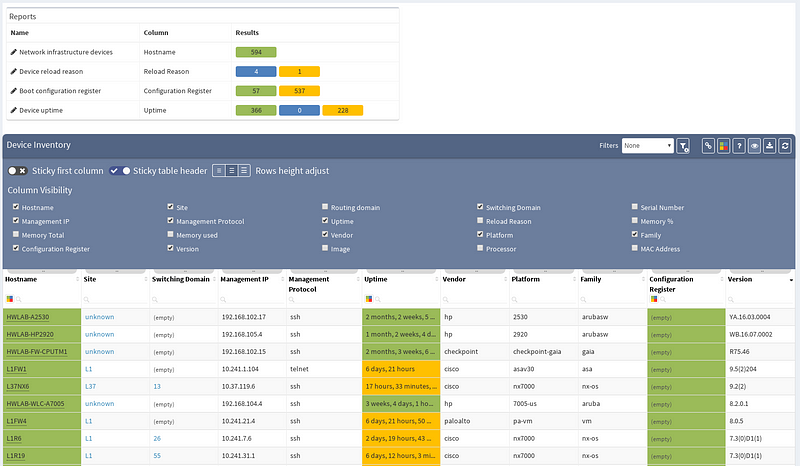
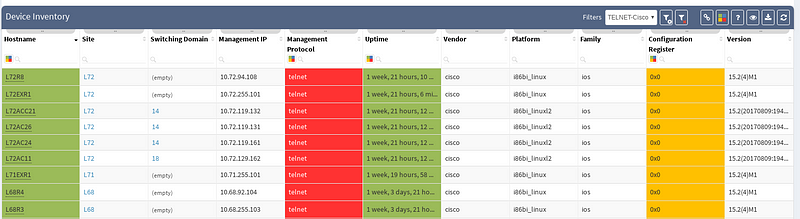
Previous screenshot of Device inventory table depicts the list of discovered devices and their properties, those can be sorted alphabetically ascending or descending by any column (or color). Now, we will create a simple filter that will provide us only with those devices that use ‘telnet’ as their management protocol, which should appear as a potential security risk.
Keep in mind that any filtered view can be exported and used in further more sophisticated reports. Advanced filters can be activated with small filter icon in the top-right corner.
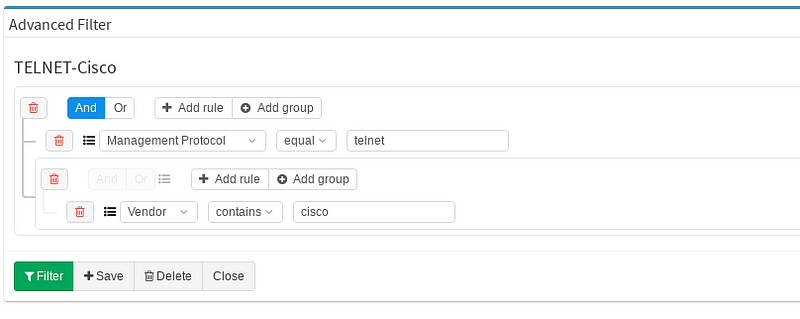
I decided to create the filter named TELNET-Cisco, which contains two basic rules. First one for Management Protocol and second for Vendor column. Keeping those two rules under one single group is completely fine, they can be also split in two different groups. You may toggle between logical OR and AND as your use case requires. At the end you will be prompted for filter name and that’s it. Let’s have a look how the view changed after the filter application (IMG3).
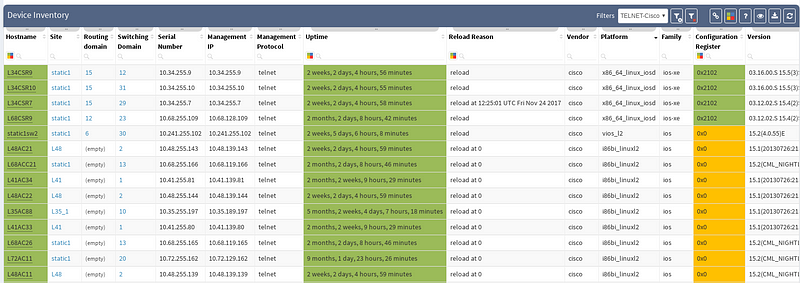
Our filter has been saved in the system and applied successfully, we can turn it off and on or switch to another filter we created before. Our personalized filter will stay ready to use anytime of course.
Similarly we are able to play around with coloring schemes. There’re already few predefined ones for Uptime or Configuration register column. But our point of interest will be tweaking our previously created filter to emphasize telnet as a security risk. By colorizing the columns we will move our report to the next level and clearly state that telnet feature is an unwanted property in our network environment.
On primary Device inventory bar let’s navigate over to Colorize columns. Again it’s very simple and straightforward, we specify the Rule name and define Colorize column, those are mandatory. Next we’ll pick up the color, bloody red in this case. Now he same logical structure appears as before when creating filters. We can specify the green or blue (if we want to) as our default color and hit Create rule.
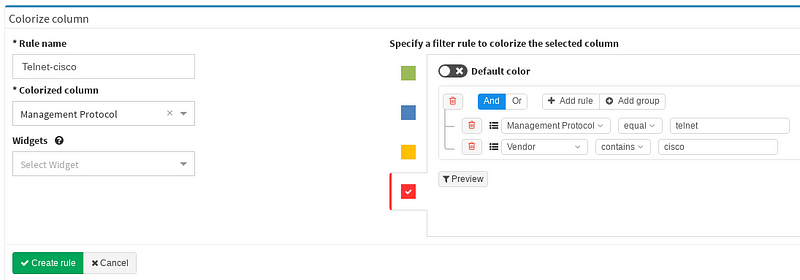
Now the colorizing scheme is included in our reports and we can immediately see how many devices are using telnet from Device inventory.
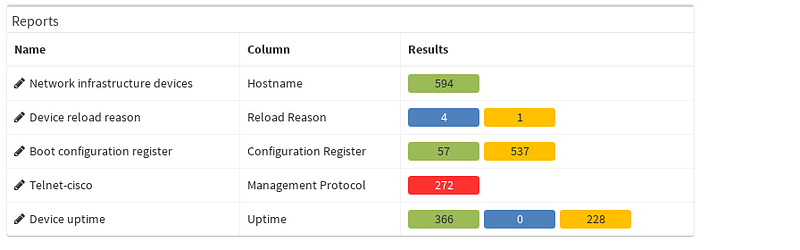
Filters and views can be much more sophisticated, this was a very simplified case, but of course clearly cuts the mustard. With certain amount of imagination, options are almost infinite. All filters and schemes can be saved and used later. Our final result can be seen below (IMG6).
All similar features may be added to your Customized Full Network Audit.
If you’re interested in learning more about how IP Fabric’s platform can help you with analytics or intended network behavior reporting, contact us through our website, request a demo, follow this blog or sign up for our webinars.
The IP Fabric platform 2.0 is a major new version of the network engineer’s best friend. A number of big changes and customer feedback have made it into the release. From tracking all changes in the network to supporting more networking technologies, and going deeper into the technology stack than any other product.
A single button now discovers the network and takes a thorough snapshot at the same time. Large networks are undergoing constant change. Analyzing partial network does not provide a full picture, while discovery alone was not sufficient to provide valuable insight about the network. Discovery of new devices, new connectivity, and new protocols, is now combined with an in-depth network analysis and assessment, user location mapping, and efficiency and risk metrics.
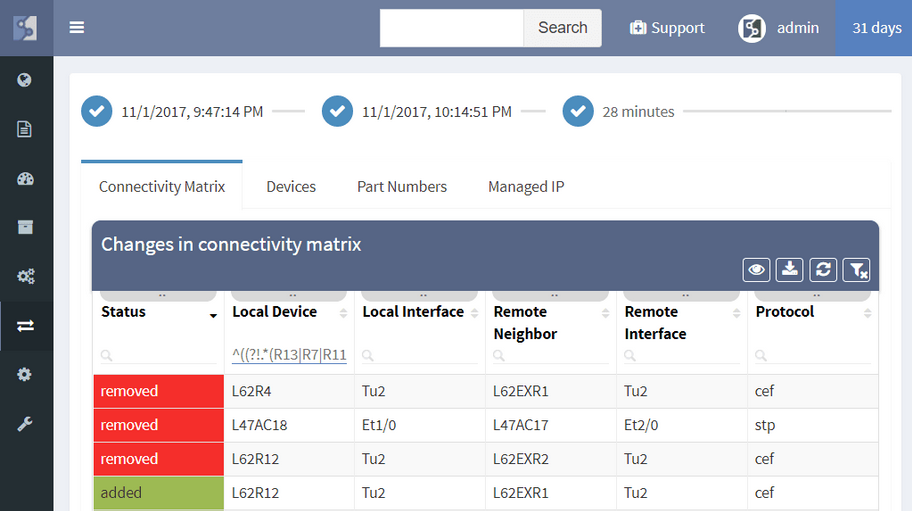
The IP Fabric platform now allows tracking of dynamic changes across the whole of network infrastructure, not just administrative changes in configuration. See whether someone reconnected a device, added a new device, swapped an SFP module, or standby router became an active one. Historical data from any of the two previous network state snapshots can be compared to find dynamic changes in the network, such as:
Administrative changes, or Configuration Management, is also available and shows when the last change on the device has occurred, allows to view most recent or historical configuration, or use the configuration to restore a failed device.
Diagrams have been significantly improved, enabling to zoom in from site overview to individual user. Diagrams allow to display or hide topology and protocols, collapse or expand links and layers, show wired and wireless users, and much more. One of the more important aspects is that topology can be saved, and that element position is unchanged throughout network changes.
While routers and switches are the backbone of any large network, it was clear that network engineers are interested in more than wired infrastructure. Support for Routers, Switches, and Firewalls was expanded with support for Wireless Controllers, Access Points, and IP Phones.
In a continuous quest to support all major enterprise networking technologies, the analytics support for Routing, Spanning Tree, Aggregation links, Link Layer, ACL, and Gateway redundancy have been expanded with QoS, StackWise, and Power Over Ethernet.
New driver system enables to add support for more vendors more easily. In addition to the Cisco IOS, IOS-XE, NX-OS, IOS-XR support, we have added:
To facilitate integration, we’ve transitioned to a single API which we use internally, and which can be used by users. The new version also features more granular TACACS controls, robust user management, encrypted channel for offline tech-support file handling, JumpHost support, and more.
We’re taking user feedback to heart. When it was clear, that IP awareness is needed for routing and host lookups, we’ve added it right away. We're continuing the trend of incremental improvements, and adding routing protocol overview, ACL entry port lookups, ACL options lookup and hit count, Interface rate to supplement rolling over counters, and many others.
Network loss is one of the key performance indicators and is used throughout the networking industry for performance evaluations. But how do you evaluate loss network-wide?
Monitoring loss in a specific flow or service is precise but has a number of inherent disadvantages, such as that it must be explicitly provisioned, that the resulting measurement only tells information about a single service path, and that there is no specific information of where the loss occurred or what caused it.
Interface packet counters can provide this information, as they already record every single packet loss, including the specific reason for the loss. However, counters report a loss for a specific element, and high dropping element might be a mirroring port or a port connecting a misbehaving printer, with little impact to production. Surely you’ll want to know about those issues as well, but a significant loss on an uplink interface serving thousands of users is going to have much higher business productivity impact.
The IP Fabric platform combines these approaches, providing loss impact visibility at every point in the network from deltas of the packet counters, and then determining the significance of each issue by calculating the number of affected users.
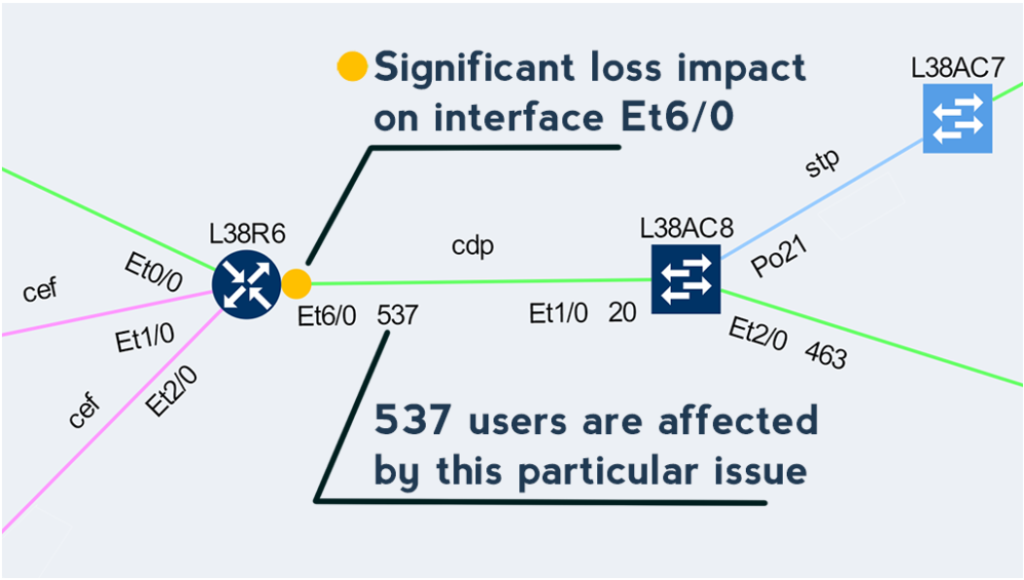
This approach enables to quickly prioritize issues affecting business productivity the most, and at the same time pinpoint the exact location and cause of the issue, providing a clear path to remediation.
If you have found this article resourceful, please follow our company’s LinkedIn or Blog. There will be more content emerging. Furthermore, if you would like to test our platform to observe how it can assist you in more efficiently managing your network, please write us through our web page www.ipfabric.io


