As enterprise networks grow in complexity, the need for reliable and efficient network monitoring tools is more vital than ever. Network monitoring tools allow businesses and organizations to monitor their network performance, detect potential security threats, and ensure that their network is functioning properly. We've covered their importance in previous blog posts.
Zabbix is a popular open-source network monitoring tool that provides real-time monitoring and alerting for network infrastructure. On the other hand, IP Fabric is a network assurance platform that provides end-to-end visibility into network infrastructure, automates network analysis and troubleshooting, and enables network administrators to optimize network performance and security. While Zabbix is a powerful tool for detecting network issues in real-time, IP Fabric can complement Zabbix by providing additional insights and capabilities. In this blog post, we'll explore how IP Fabric's comprehensive network discovery capabilities can be used to populate the hosts list, and how IP Fabric can provide assurance information to create problem records for non-compliant issues.
We're excited to announce the release of our new Zabbix template for IP Fabric. With this template, you can easily pull metrics and devices from IP Fabric and streamline your network monitoring efforts. Zabbix templates are pre-defined monitoring configurations that allow you to apply the same monitoring settings to multiple devices or services at once. By using our Zabbix template, you'll save time and effort while ensuring consistent monitoring across your network. Our Zabbix template for IP Fabric includes everything you need to monitor your network devices and services effectively. Simply apply the template, and you're ready to go. Whether you're a small business or a large enterprise, our template makes network monitoring simple and efficient.
To configure the template effectively, you need to provide two pieces of information to IP Fabric.
Download the IP Fabric Zabbix Template and navigate to Zabbix Data collection -> Templates -> Import.
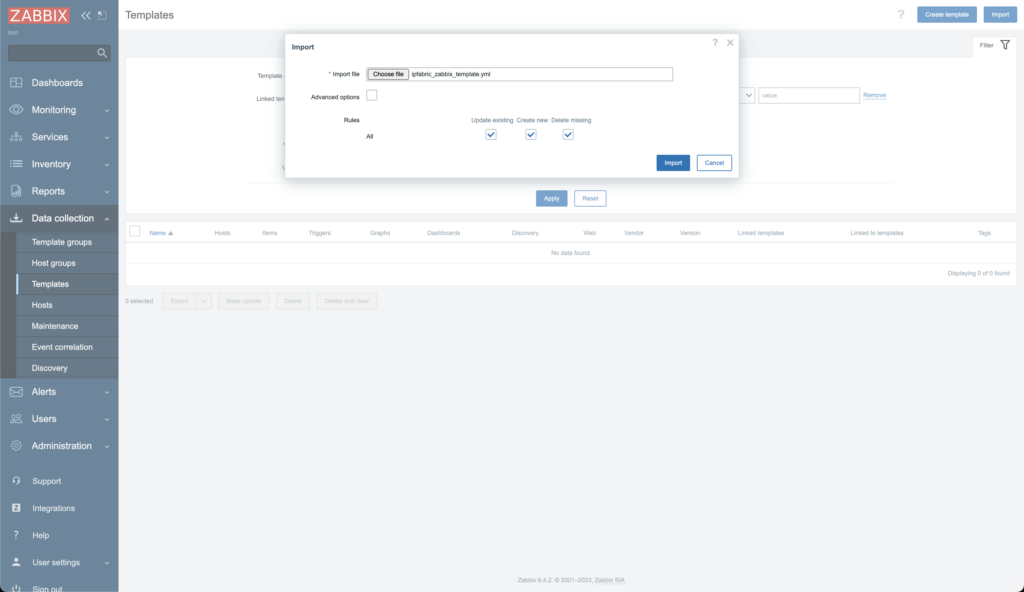
Select Import
Navigate to Monitoring -> Hosts -> Create Host
| Field | Value |
| Host Name | IP Fabric |
| Templates | IP Fabric Template |
| Interfaces | Type: SNMP IP Address: Address of IPF VM SNMP Community: Value configured previously |
| Macros | Macro Name: {$IPF_URL} Macro Type: Text Macro Value: https://<IP_ADDRESS>/api/v6.2/ Macro Name: {$IPF_TOKEN} Macro Type: <token created earlier> |
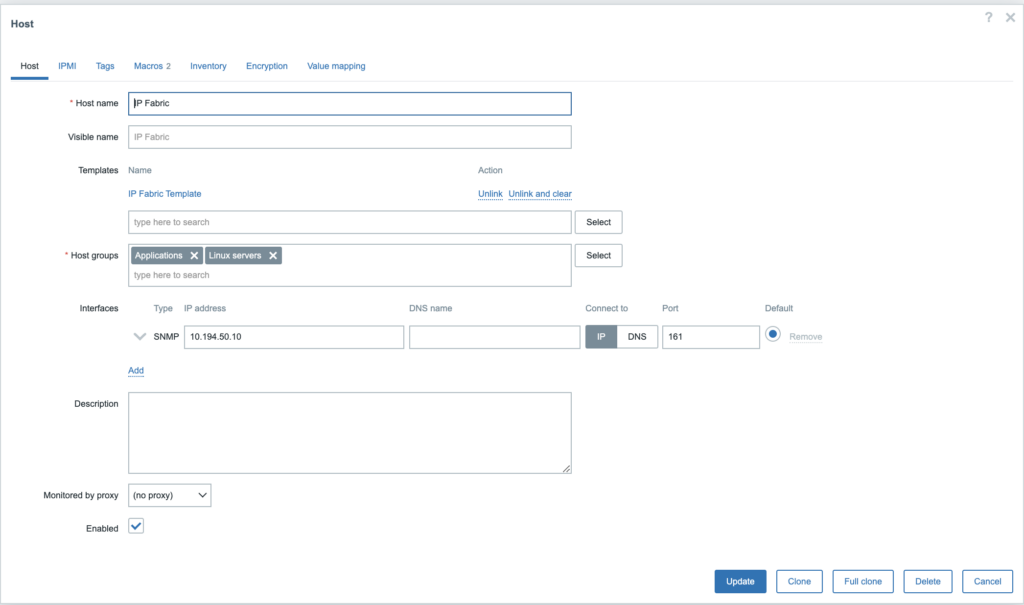
Enter the IP Address and SNMP community string.
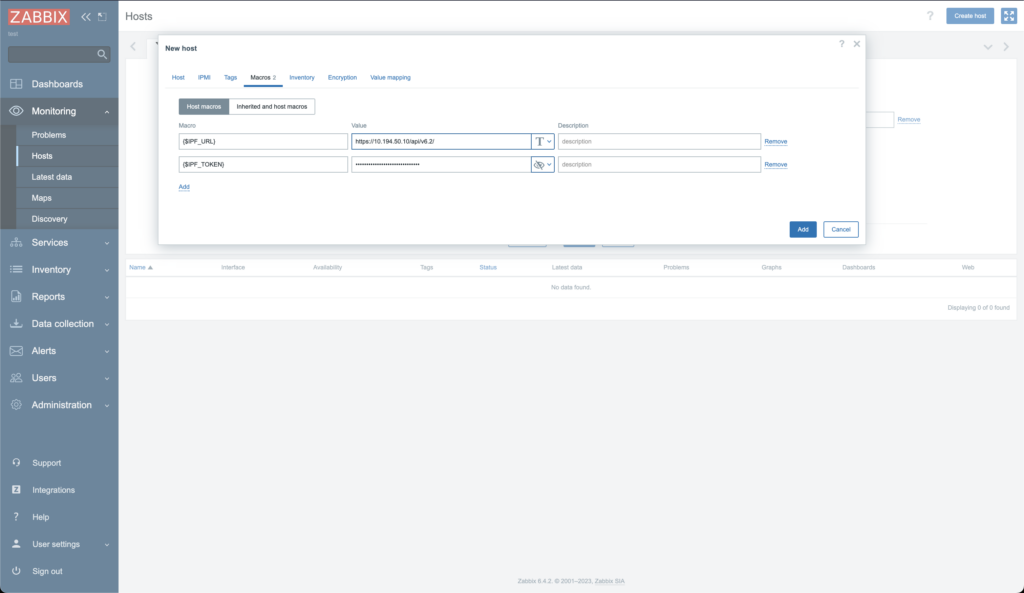
Enter the macros stated above for the IP Fabric API and API Token. Once completed select Add.
The IP Fabric VM should now be monitored via Zabbix. The IP Fabric template includes the Linux SNMP monitoring template. This enables the monitoring of VM vitals, as well as information regarding snapshots and more.
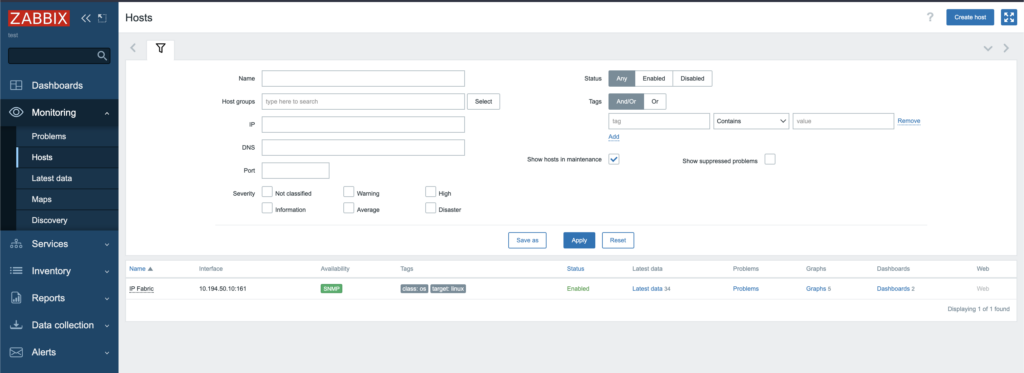
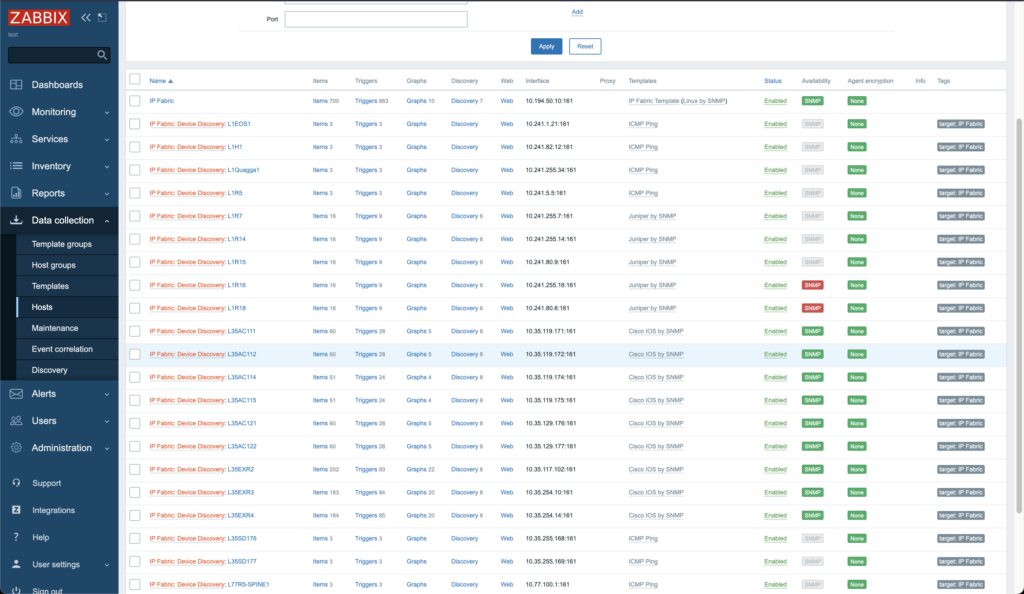
After some time Zabbix will have auto-populated hosts collected from IP Fabric.
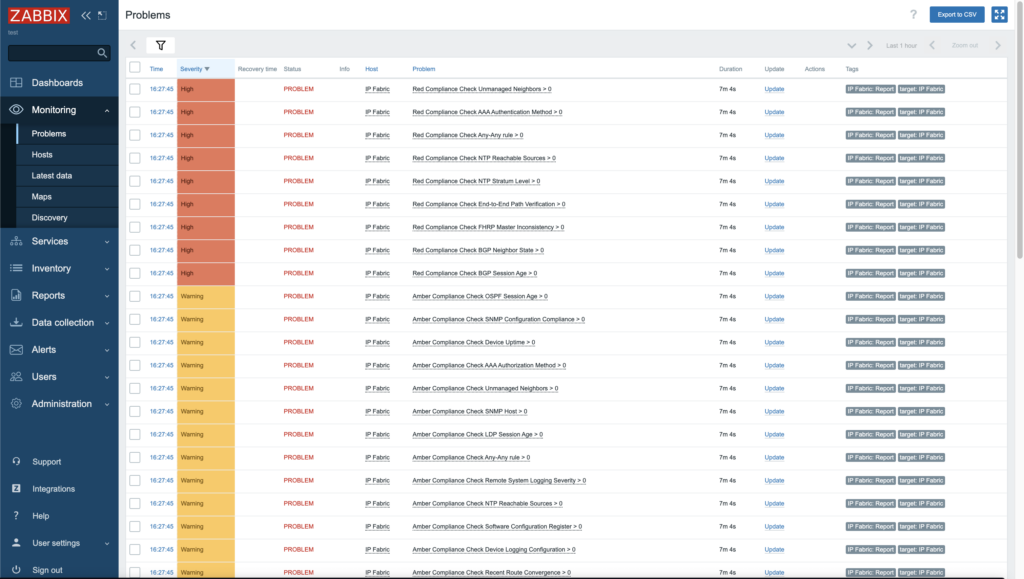
Within Zabbix, upon navigating to Monitoring -> Latest Data IP Fabric intent verification rule results will be present for each rule and color specified.
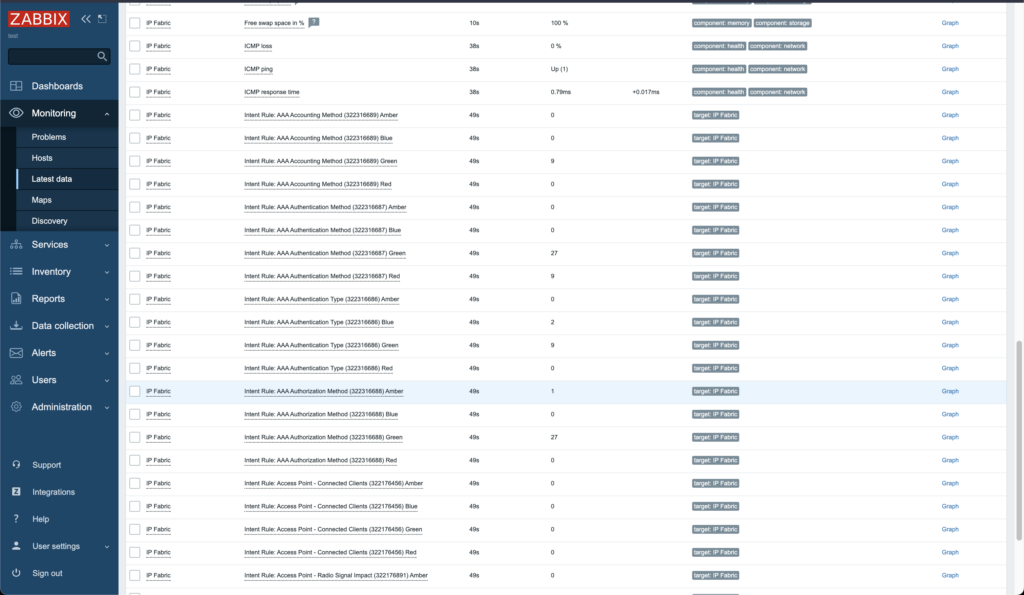
This is interesting as it allows triggers to be created when intent verification rules go above a specific threshold. By default the template ships some basic triggers which can be customized but if we look into problems within Zabbix and see what has been created.
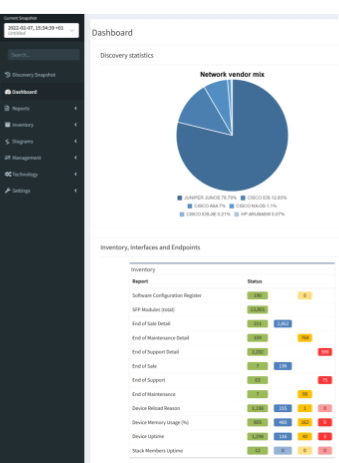
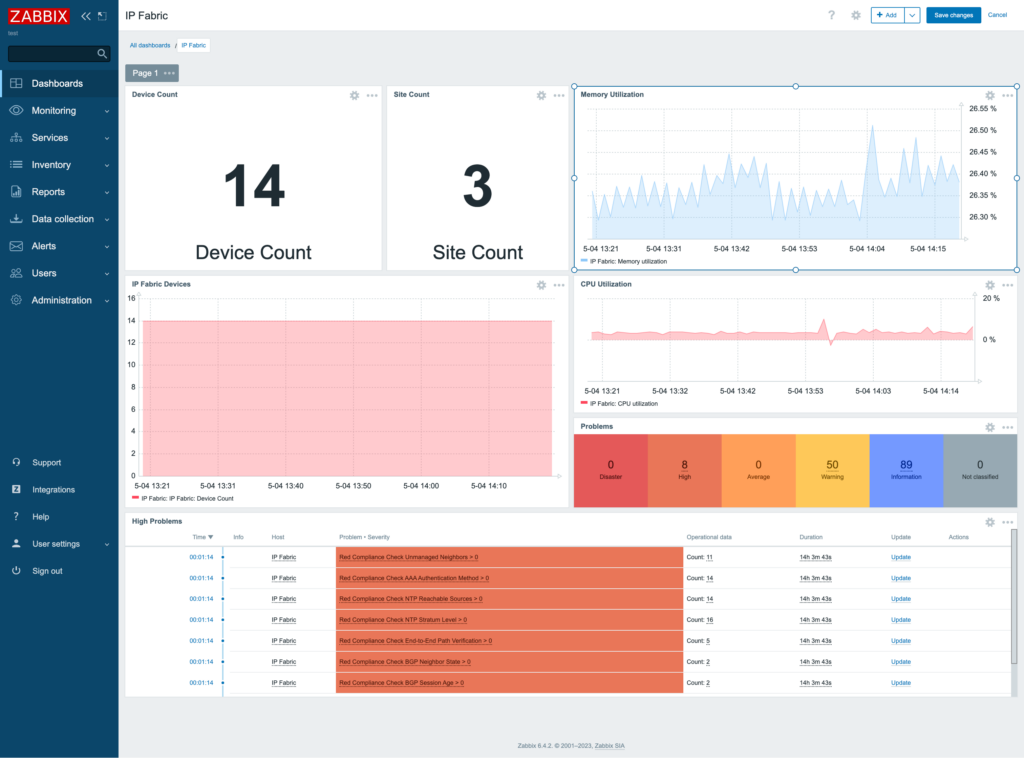
With all the data the IP Fabric Zabbix template collects dashboards can be created to present a large amount of information in one view. See the image below as an example.
Adding assurance capabilities to your network monitoring tool means faster incident resolution, less time wasted on unimportant alerts, and ultimately, more value out of your existing network tools. If you need more information on the above template or processes, please reach out to our team and we'd be happy to help you out.
If you are not yet using IP Fabric and want to see what it could do for your network team, take a look at our Free, Self-Guided Demo or check out our ROI calculator.
The IP Fabric platform provides a standard Application Programming Interface (API), and this interface allows to integrate IP Fabric platform with any 3rd party software or build any custom scripts. See the official documentation for details on how to use our API.
Thanks to a unique discovery algorithm, IP Fabric is capable of collecting data about all active network devices automatically. It collects more than 1000 parameters from each individual device and provides the data in a standardized form. Those data can be viewed in GUI or accessed via API. Hence all available data serves as a perfect baseline for any automation or API integration efforts.
This article demonstrates how to add devices to Zabbix monitoring software. Zabbix uses the SNMP protocol for monitoring; therefore, we have to check if a device has SNMP configured and if no, then we will configure it automatically using the Ansible tool.
The IP Fabric is a very flexible tool when it comes to getting information. The same applies to well-documented API fetch points. In every technology table, including the main device inventory, there's table description, that appears on request.
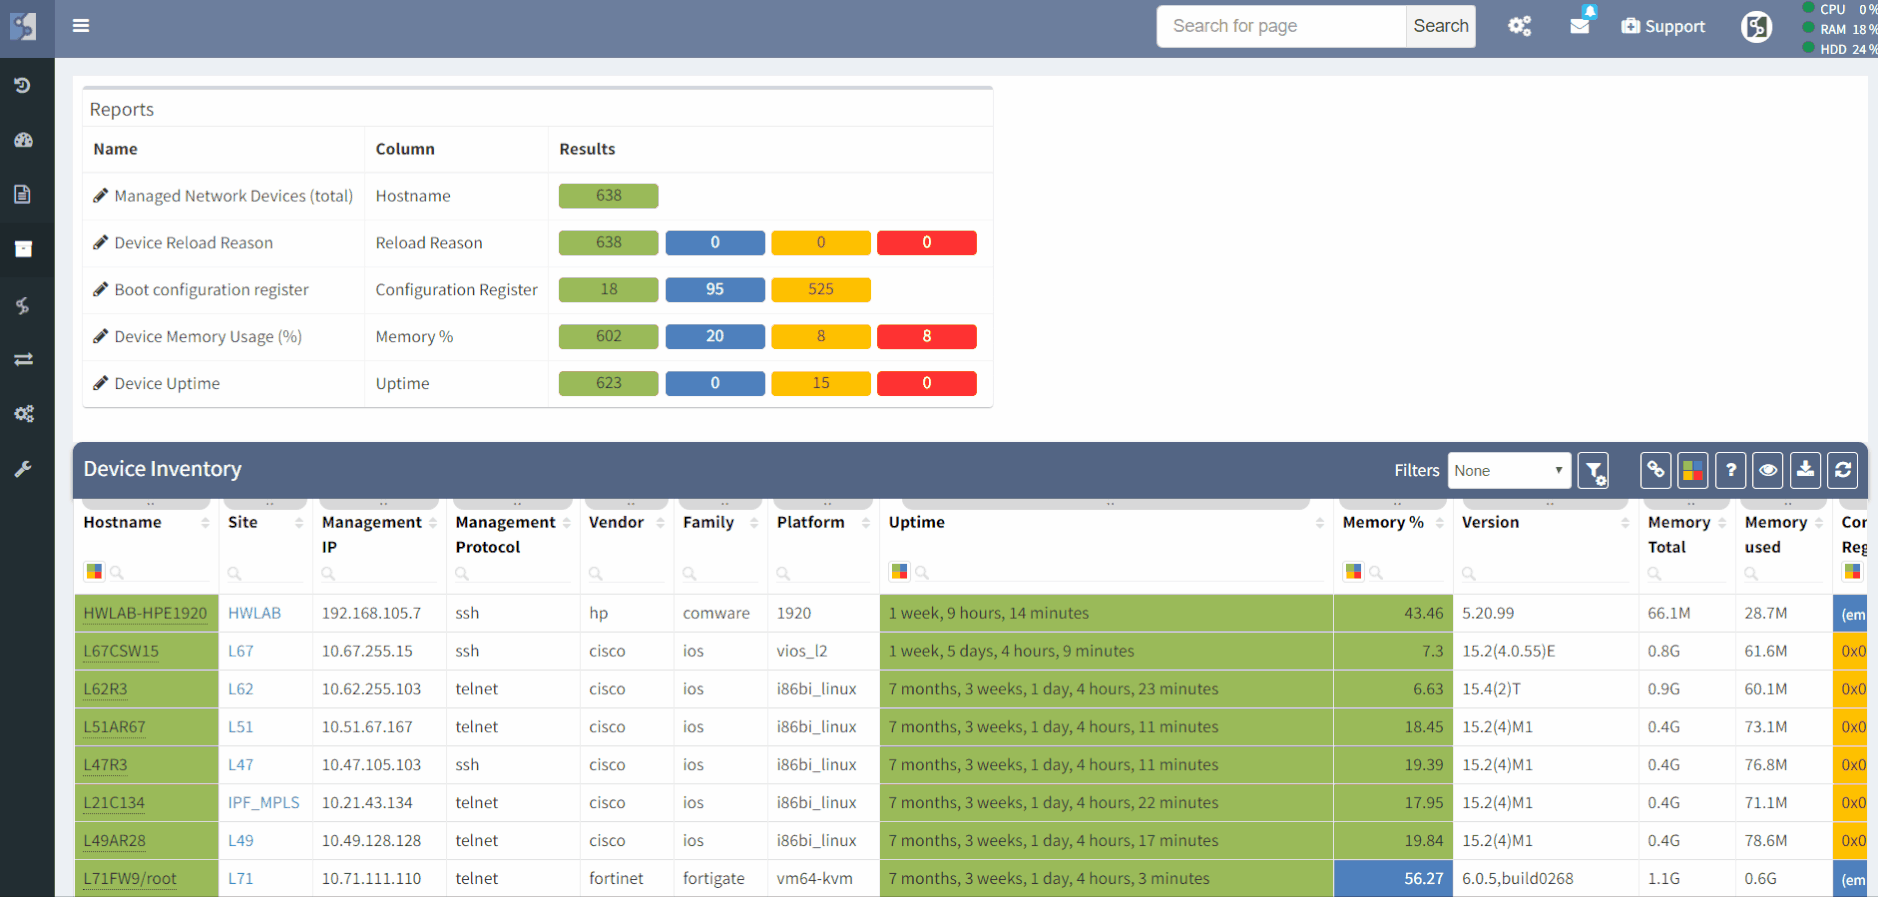
The full device inventory can be accessed with a POST request to https://ipfabric.domain.com/api/v1/tables/inventory/devices. The response can be filtered by any column.
So let's say that we want to get all Cisco IOS, IOS-XE devices, the following code snippet will accomplish just that:
curl -k -s https://ipfabric.domain.com/api/v1/tables/inventory/devices \
   -u 'username:password' \
   -H 'Content-Type: application/json' \
   --data-binary '{"columns":["sn","hostname","loginIp","loginType"],"filters":{"or":[{"family":["eq", "ios"]},{"vendor":["eq","ios-xe"]}]},"snapshot":"$last"}'
All data related to SNMP configuration for all discovered devices is presented in a different technology table related to SNMP. If in doubt, there's always the search box that will help with finding a specific target. Let's say we are looking for SNMP information, let's just type 'SNMP' and see results. The platform will provide us with information about tables, including SNMP information. We will navigate to SNMP Summary, where we again collect API link.

In the same way, we collected full device inventory, filtering IOS and IOS-XE, we can collect all devices with that has no SNMP community configured.
curl -k -s  https://ipfabric.domain.com/api/v1/tables/management/snmp/summary \
     -u 'username:password' \
     -H 'Content-Type: application/json' \
     --data-binary '{"columns":["id"],"filters":{"communitiesCount":["eq",0],"sn":["eq","'"$sn"'"]},"snapshot":"$last"}'
By comparing Inventory with IOS or IOS-XE devices and SNMP summary table information, where we can find devices with no configured SNMP community, we will get the full list of devices that need to be added to Zabbix and configured with Ansible.
The entire bash script can be seen in our public repository.
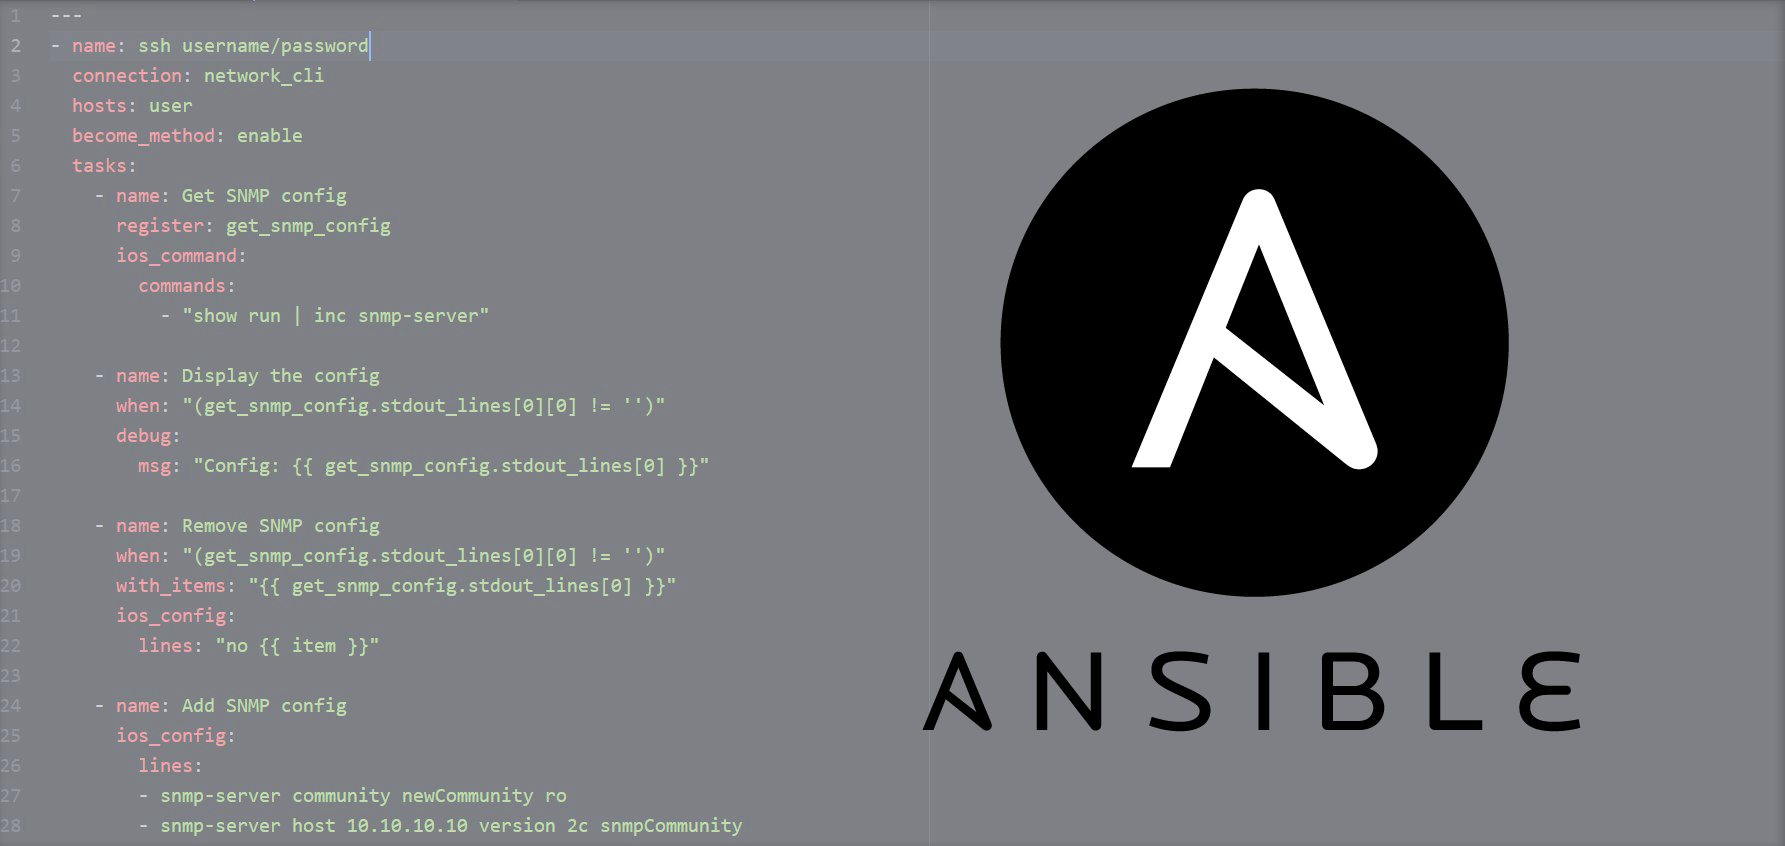
Ansible is an open-source configuration management and application-deployment tool. It helps to automate configuration updates with templates called the 'playbooks' with various network vendors, including servers.
We used the Ansible version 2.5.1. Our simple Ansible playbook will add a new SNMP community and trap the host server as well.
Please note, that you may want to modify the YAML file to fit your environment, we only used 'dummy' SNMP server IP, which may be the Zabbix IP address and SNMP community as an example. The following snippet may need an update per case.
     - name: Add SNMP config
      ios_config:
        lines:
        - snmp-server community newCommunity ro
        - snmp-server host 10.10.10.10 version 2c snmpCommunity
      notify:
      - Save Configuration
The entire Yaml file can be seen in our public repository.

The Zabbix configuration is updated with the help of powerful Zabbix-CLI, which was originally developed by members of the Department for IT Infrastructure at the Center for Information Technology at the University of Oslo, Norway. It's a very user-friendly and powerful solution for connecting to Zabbix's API.
The connector needs to be preinstalled and configured accordingly. For the full installation process, please, follow the documentation.
Thank you for reading!
If you have found this article helpful, please follow our company’s LinkedIn or Blog, where there will be more content emerging.