BGP is famously known for being the routing protocol of the internet, but not only. A lot of companies are using BGP in their internal network. One of the main reasons for that: it allows great control and flexibility with routing exchange.
As with any routing protocol and critical connectivity, we want to ensure we are resilient to failure and that the resiliency is operational. With BGP, to do so, we need to have a closer look at the received prefixes.
Let's take a classic example, where you would have two devices connected to an external party. This could be your ISP, MPLS provider…
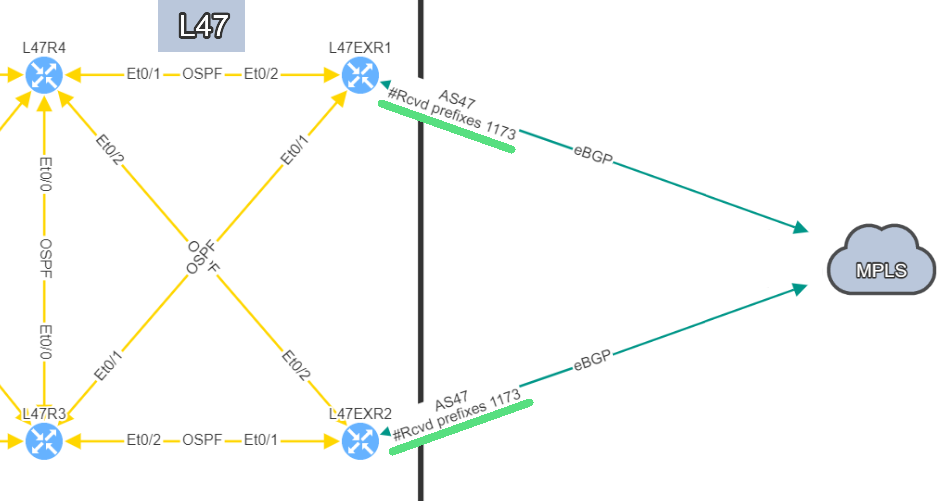
In this example, site L47, on the left, is connected to site L21 which is your MPLS cloud.
You have your two eBGP sessions established with the MPLS cloud, that's great! Now you want to ensure that you are resilient by checking the receive routes from the provider on both links. This is how you will be able to reach any of your sites connected to the MPLS cloud.
In this situation, if one link fails, you have full resiliency. You will not lose connectivity to your MPLS network and all the services hosted outside site L47.
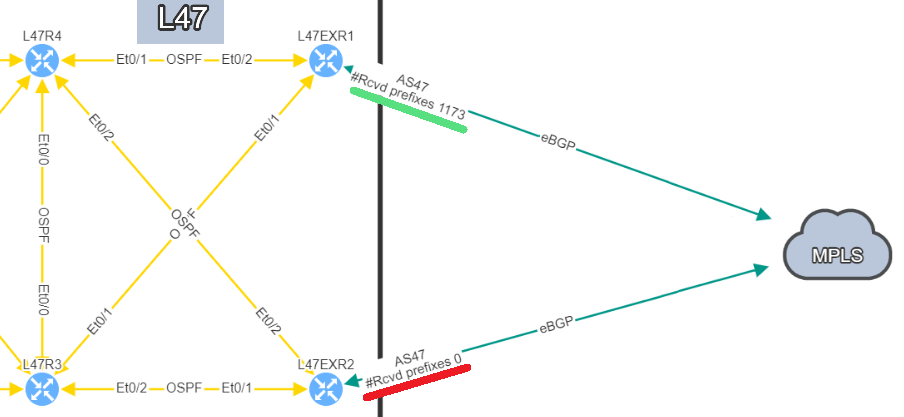
In this situation, if you lose L47EXR1 or the link between this router and site L21, your secondary link will not be able to forward any traffic. L47EXR2 is not receiving any routes.
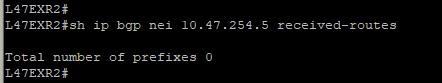
This is what you would see on your device:
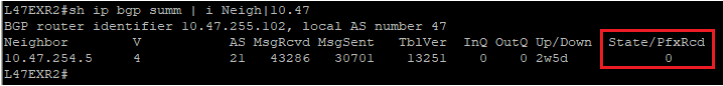
The fact that you can see State/PfxRcd showing "0" tells you the BGP session is established, otherwise, you would see the current state (Idle, Active...). Any other number would be good, unfortunately in this scenario, you are not receiving any route.
You are now in a situation where you do not have any resiliency, and your monitoring system is not alerting us on the issue.
That’s a very good question! In a situation like this one, the BGP session is not affected, which means there is no error generated by the router. The device will not send Syslog messages or SNMP traps to inform your monitoring system that you are not receiving any routes.
That's where IP Fabric can play a crucial role to identify the issue quickly before it causes any damages. There are several ways to see the problem:
The IP Fabric dashboard provides an overview of the network analysis results, including issues and links to the detailed reports.
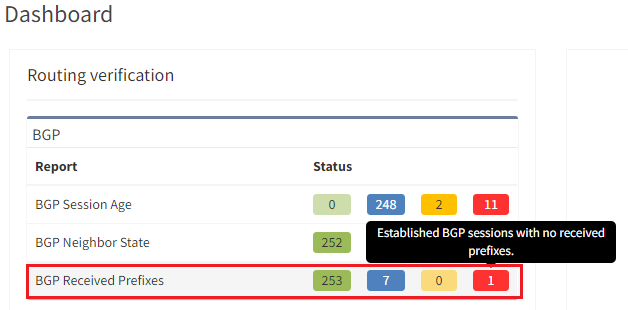
After seeing this table, you will want to check further details regarding the issue. Just click on the interesting number, and you will be redirected to the appropriate technology page and the intent verifications.
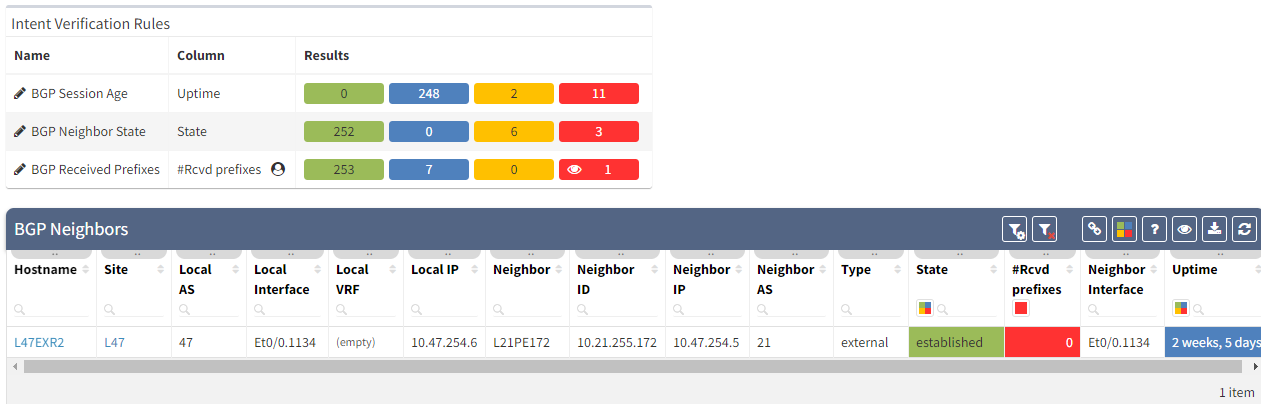
As we have seen at the beginning, you will be able to check directly on the diagram the number of received prefixes for a specific neighbor.
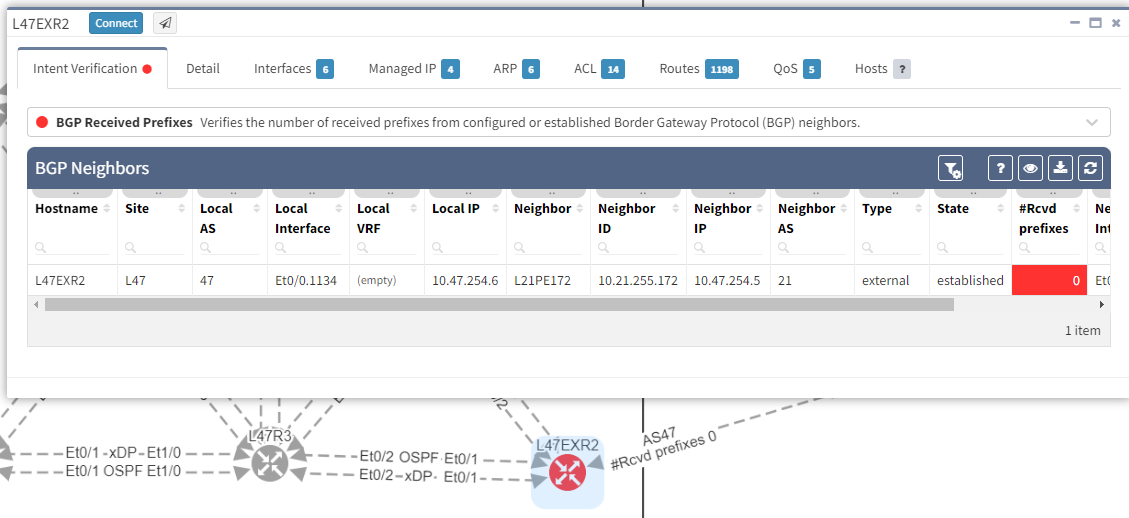
It's also possible to display on the diagram the verification information from all the supported technologies. In this example, we will add the BGP information on the diagram for site 47:
The moment we select the verification to add to the diagram, we can see L47EXR2 becomes red. If we click on the device, we will see the explanation on why it's showing red:
In addition, we can spot this issue by looking at the end-to-end path. Let's take an example where we are looking at the path from a source in site L47 to a destination in site L66, which is connected to the MPLS cloud.
In a normal situation, we would expect to see the traffic being able to use both links to reach the MPLS cloud:
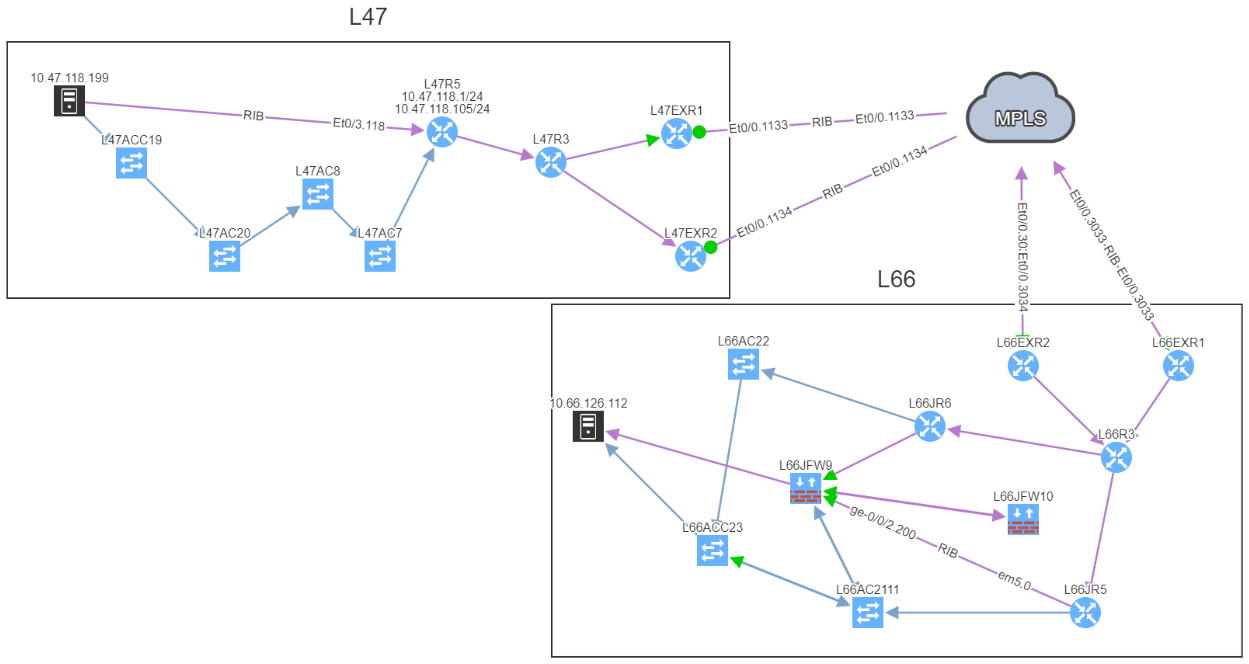
If we now compare with the snapshot where we have the issue, we can clearly see that we have lost our resiliency:
You can't ensure BGP resiliency if you do not look at the received prefixes. The main issue with this situation is the fact that your monitoring system will not be able to inform you of the loss of received prefixes. The last thing you want is to face a massive outage because of one link failure and your secondary link was not operational.
I have been in that exact situation previously, and let's just say I did not enjoy writing the postmortem explaining why we did not know our redundant path wasn't working. It's not a situation you want to be in...
If you would like to find out more about IP Fabric and how it can help improve your existing infrastructure by detecting issues you are not aware of, please contact us through www.ipfabric.io! You can also follow our company’s LinkedIn or Blog, where more content will be emerging.
After presenting IP Fabric at Networking Field Day 23, a number of Twitter threads started probing at the idea of Intent-Based Networking (IBN) - is it simply a marketing term that vendors use to sell more gear or does it have a deeper meaning? And what impact does it have on the network team? Does it automate them out of a job?
It’s safe to say that every modern business depends on its IT, and the network provides the underpinning to all the systems on which we rely. Business needs IT to just “be”. It should be permanently available, supporting business process with a minimal operational overhead. But it’s obvious to anyone in IT just how big a stretch that is due to many factors, not least:
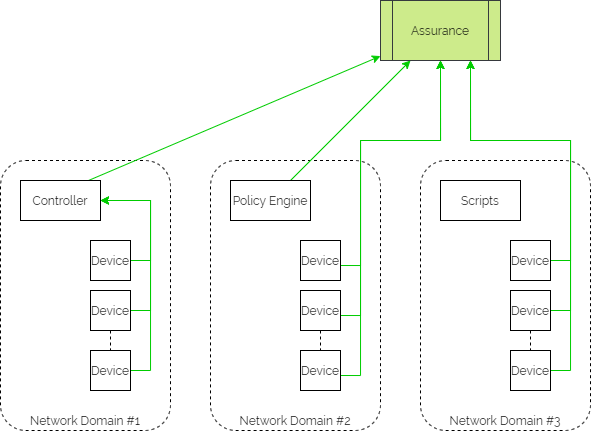
Automating regularly occurring network tasks helps reduce the operational overhead of running the network, of course. You might use controllers or scripts, templates, zero-touch provisioning and automated change mechanisms. There are plenty of benefits in being able to treat a network domain as a macro entity and allow the micro tasks that are required to maintain the environment be taken care of by automated processes.
However, it's vital that we fully understand the networks we build. This ensures that the automation platform is deploying configuration with the expected outcome. Configuration still happens in a network domain on a box-by-box basis. The process uses configuration detail from a knowledgeable and experienced network engineer. In reality, the automation system functions like a fast, consistent network analyst. It makes and tests changes and fetches data about operations, based on rules defined by its "superiors"!
IBN takes the automation approach to the next level. Given the business intent for the network, you first translate it to a set of technical capabilities, then:
What we’re really doing here though is subtly evolving the roles of the network architect, designer and engineer.
The business intent may include such abstract ideas as “make sure that my critical applications are always available”. The traditional approach would involve a network architect in translating that intent to some design criteria: “always use High Availability, no SPOFs, converge my routing protocol within x seconds, define QoS across the network” and so on. A network designer will then take those principles, and looking at each network domain in turn, consider how to turn out specific bills of material, Layers 1, 2 and 3 topologies and designs using specific vendor platforms. The network engineer would finally deploy this. They would turn the designs into actual configuration, and then manage and maintain the resulting network.
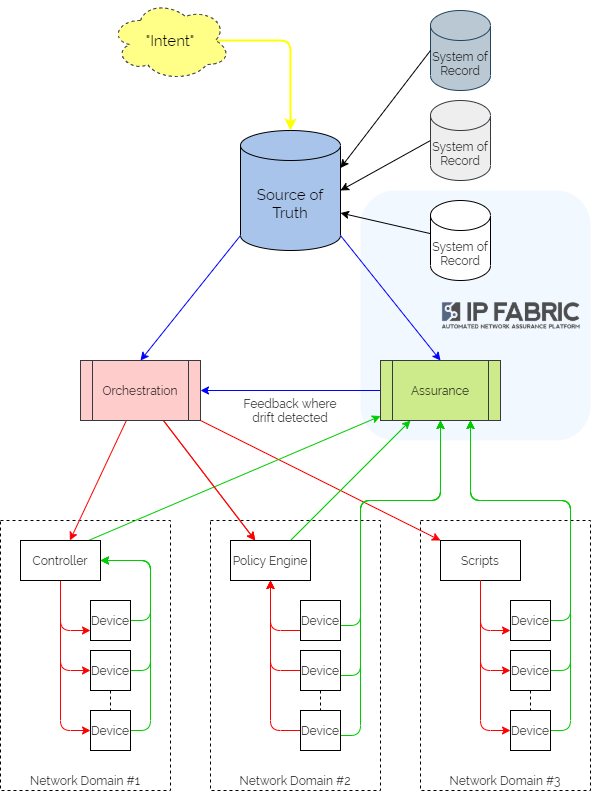
IBN automates much of this process, taking business intent and delivering a self-regulating, self-healing network environment.
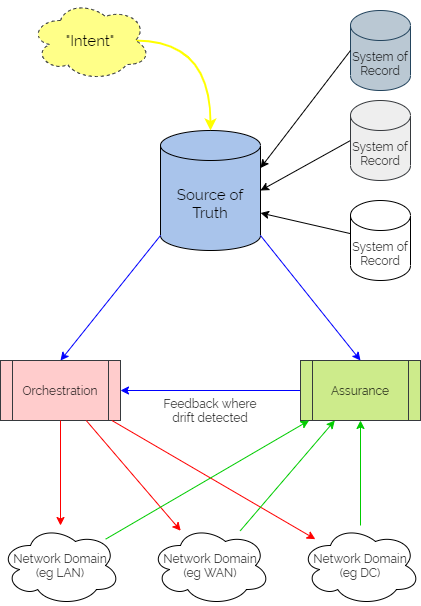
It centres on a “Source of Truth” (SoT) – a picture of the network as it is intended to look, developed from the business intent using logic defined by the network architects and designers. It is then used as a central reference point for all intended configuration data – often referring to other “Systems of Record” as definitive reference sources where necessary.
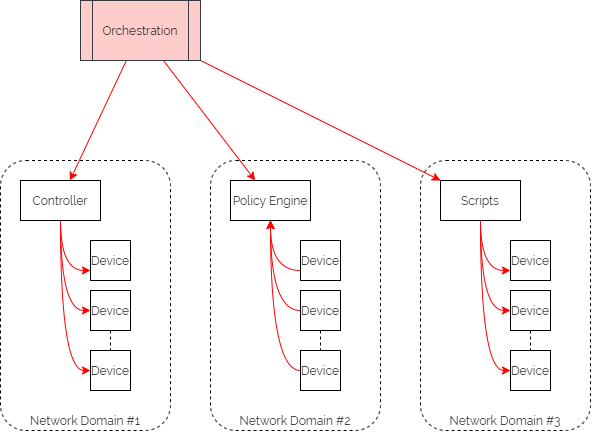
Updating intent in the SoT triggers orchestration workflows to render the configuration in the different network domains. These configurations might include organisational or industry Best Practice templates, security policy data or specific network domain detail to support the intent. And typically the orchestration workflows then kick off automation tasks in controllers or as scripts to interact with different sets of network devices, potentially from different families from different vendors. Subsequently, they might also update policy engines which devices are using to refer to without having to keep local copies of configuration or policy.
Assurance workflows are built first to harvest state information from the network devices and controllers. They then analyse that data to ensure that they are meeting the intent.
And if intent is not being met, the assurance element then triggers a feedback loop into the orchestration platform to update configuration through the automation layer.
There are of course a few words of caution.
And so you can see, the network architect, designer and engineer are still key - they simply demonstrate their knowledge and experience in different ways.
As we mentioned in our earlier post, IP Fabric is not well-positioned as the SSoT for intent, simply because the product focus is on being the informational reference for the actual network state.
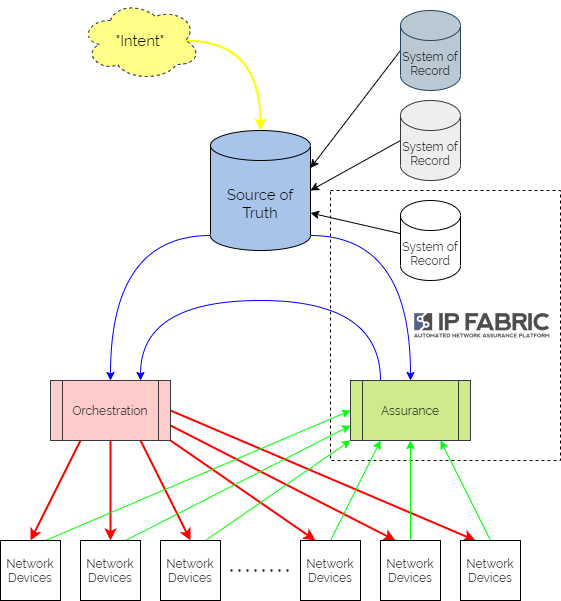
IP Fabric can sit squarely at the heart of your intent-based networking ecosystem however. As it provides full inventory, configuration and state visibility of the entire network, it then becomes well-placed to serve as the System of Record for those elements. It would be used to carry out an initial population of the Source of Truth, and then as a regular source of true-up data to ensure that the SoT genuinely represents the active network.
As IP Fabric is already harvesting all the network data, it is in a great position to begin carrying out the assurance elements of the IBN system. We would define rules in IP Fabric that validate elements of configuration and state, which are checked at every snapshot. Rules are not only created through the UI but also through the API. This means that they can then be pushed to the platform from an agent acting for the Source of Truth. Webhooks can then be fired from IP Fabric at calculation of those intent verification rules, to provide a feedback mechanism to the orchestration platform should intent not be met.
The real beauty of using IP Fabric with its complete network database and open API is that it can then serve as a reference source for whoever else needs that network data. The same system operating as part of the IBN platform could thus be used to keep monitoring platforms up to date, feed data to ITSM tickets at creation time, and later be queried through slash commands in Slack.
And so, the network engineer already has all the detailed configuration and state data they need to maintain, troubleshoot and deploy the networks they run. The network designer has an understanding of inventory, and topology relatinships at all layers. And the network architect can then get a picture very quickly of the current state of the interoperation of the network domains to help plan for transformation.
If you have found this article helpful, please follow our company’s LinkedIn or Blog, where more content will be emerging. If you would like to test our solution to see for yourself how IP Fabric can help you manage your network more effectively, please contact us through www.ipfabric.io.
A lively debate sparked up after Networking Field Day 23, where we presented IP Fabric to a panel of delegates and hundreds of eager online viewers. Could we class our solution as a "Source of Truth" for the network? The conclusion was "Yes". And "No". So why the confusion and what did the question actually mean? I thought I'd try and get to the bottom of it!
Network automation has come a long way. Once, that meant CLI scripts that you created by "mail merge", then rolled into your network over a telnet session. Now we have sophisticated automation platforms that take desired state and through configuration templates, functions, modules, and APIs, can push that state into network devices (and if you're really lucky, roll them back again if they didn't complete.) But where does that desired state come from? You need to decide and record which features and parameters you want to enable and push out to which devices ...
And so you create a database - a bunch of spreadsheets, SQL, DCIM (Data Center Infrastructure Manager), or IPAM (IP Address Management) system - containing those feature definitions and parameters. And your templates are rendered using the data from that system into intended config state. This is typically referred to as the "Source of Truth", SoT (or sometimes "Single Source of Truth", SSoT).
The idea is that there is only one place to store that data - the ultimate reference source of desired configuration. Update that and the implied intention is that the network config is required to be changed. Typically that information would be version-controlled and tracked, often using git or a similar VCS (version control system).
... when it doesn't hold all the information in one place! A Single Source of Truth can simply be a placeholder or proxy for the collection of reference sources for individual pieces of the network data puzzle.
You may use an IPAM system to record the definitive IP addressing schema that you want to use. You may use a CMDB to track your network device inventory details. These would be referred to as Systems of Record. Ultimately your network automation needs to access information from both of these sources in order to render configurations. So an SSoT would zip that information together as required.
Within the accepted conventional definition, not really. As the inventory, configuration, and state data in IP Fabric is harvested from network devices, it doesn't represent intended state. It isn't able to be changed or updated manually. IP Fabric builds vendor-neutral snapshots of the state of the network as a whole. It reflects - in great detail - the state of the network as it is operating at a point in time. It is queried through Web UI or API, visually or in tabulated data. As such, it doesn't store intended state, but the actual state.
But that's not the complete story. Because along with the data from the network, we can build a series of intent verification checks. We use filters and classifications on that data to verify that the active network complies with an intended state. For a simple example, we can ensure that all network devices are configured to a specific set of management parameters. We verify that NTP, SNMP, and syslog match a set of criteria at every snapshot, and present a compliance report.
The 150+ embedded verification checks that ship with the platform range from the simple (eg checking where VLAN 1 is in use) to the complex (eg ensuring Spanning Tree root and FHRP active gateways align) and everything in between (eg checking MTU sizes at either end of a link match).
Whilst there is a mechanism to store intent in IP Fabric, it isn't used to render the intent as configuration. Verification checks are run against every snapshot and provide us with a way of validating intent on an ongoing basis.
We also carry out simulated end-to-end path checks at each snapshot. This allows us to validate that paths are as you expect them, and firewall rules allow connections only as intended.
All of these intent verification checks are built through either Web UI, or IP Fabric's extensive REST API. This provides us with the ability to update the intent verifications in IP Fabric while you render the configurations from the intended state data, thus confirming at each snapshot that the state is matching the original intent from the SoT.
IP Fabric's new webhooks feature which allows us to notify an external platform when verification checks are completed. This can be used to provide a feedback mechanism for when actual state has drifted from intended state.
In IP Fabric we compare the intent with the network state that is discovered at the time of the snapshot. If for some operational reason, a part of the network is down, or if a partial snapshot is run to validate a change in a particular area of the network, then we only have partial data. And that is not useful for expressing intent across the whole network.
It is more optimal to use IP Fabric in tandem with a dedicated SoT like the open-source project Netbox. IP Fabric would then be used to cross-validate that the data in the SoT is correct and up to date. This effectively treats IP Fabric as a System of Record for active network state. An automation platform like Ansible might then be used to render configurations.
Using the API, IP Fabric intent verification rules can be built from the data defined in the SoT to confirm that the network configuration and behaviors matches the intent expressed in the templates. If state doesn't match intent, webhooks can be used to notify the orchestration/automation platform that adjustments need to be made. So not only would we automate the network device configuration from the SoT but also IP Fabric configuration!
Based on current accepted definitions, IP Fabric would not be considered a "Single Source of Truth" for intended state. It would be more accurately considered a System of Record for existing network state. It would be used in conjunction with a SSoT to measure compliance with intent. And if required, it would then trigger activity to rectify any drift.
Look out for the next article, where we'll consider Intent-Based Networking in a little more detail!
If you have found this article helpful, please follow our company’s LinkedIn or Blog, where more content will be emerging. If you would like to test our solution to see for yourself how IP Fabric can help you manage your network more effectively, try our free online demo here: Self-Guided Demo.
The fundamental purpose of a data network is to connect users with applications, data producers and consumers with storage. The most desirable feature of a network is to maximise availability of those services to the endpoints that consume them. In order to achieve that, we need to consider (amongst other things):
To be sure we can deliver availability then, we should design our networks with these tenets in mind.
Sometimes though, organic growth in your IT environment means that the original design principles can't be upheld. You need to change your network to fulfil a new requirement and fast! And so you build a change to your network that compromises the original design principles but provides a solution.
Often, this means connecting a new link to a new device which is not big enough, fast enough or resilient. Or some unseen configuration issue prevents redundant links from being available for use. Then, when an issue occurs later, you and your users suffer because the principles you laid out for maximising availability haven't been upheld and systems fall over. You are then left trying to trace the reason why things have failed.
Where do you start? Your diagrams and design documents were great when you built your network, but no one has kept them updated. And so, you have to start where they end, and:
then you sit down with your network team to analyse where your single points of failure are and what you can do about them. Don't forget that they might not be immediately obvious in the physical topology, but in the logical configuration!
Alternatively you could give the job to IP Fabric.
Each time IP Fabric runs a snapshot, it rediscovers the network topology from the physical layer upwards. Clicking through the Diagram | Site Diagrams menu shows a visualisation of the topology:
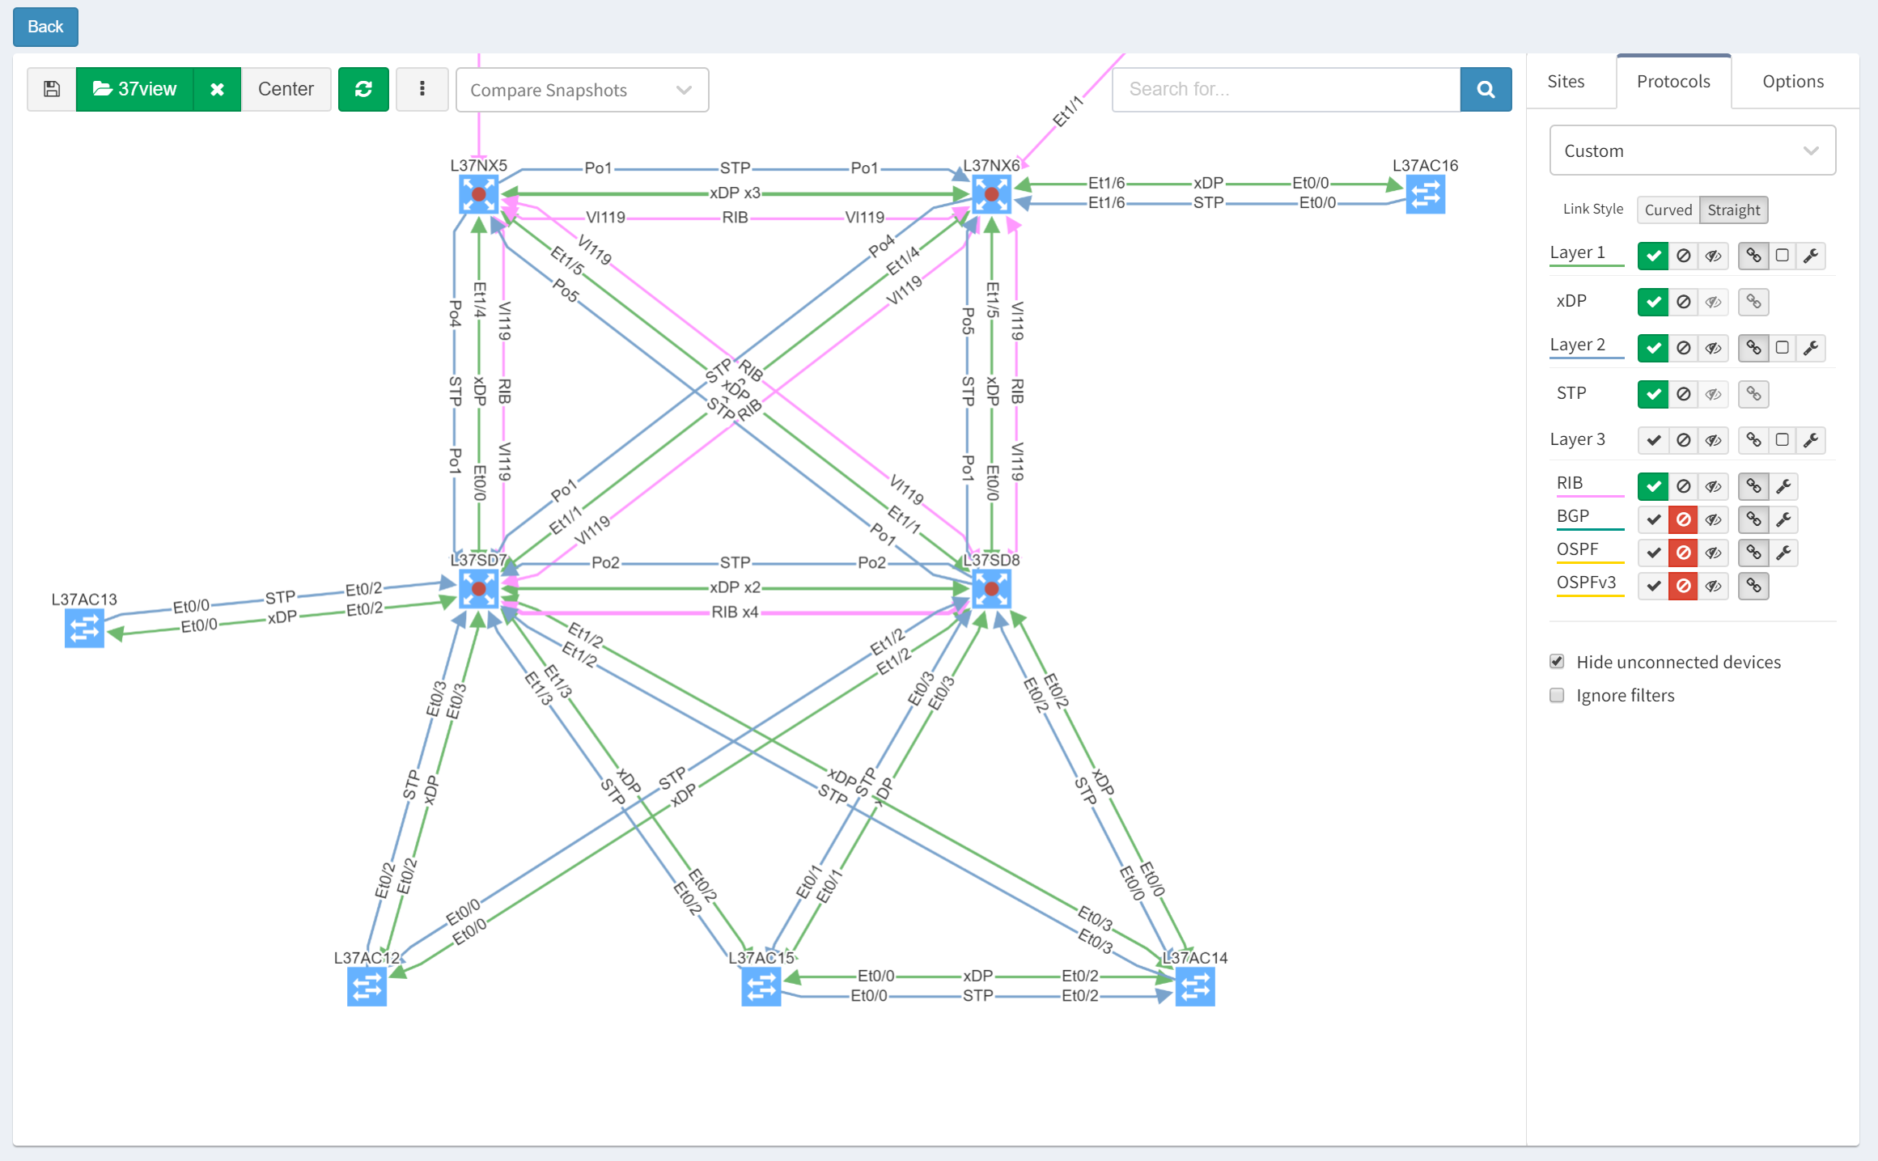
After turning off Layers 1 and 3 for clarity, then selecting the Options tab and clicking "Single Points of Failure", IP Fabric highlights them with red outlines:
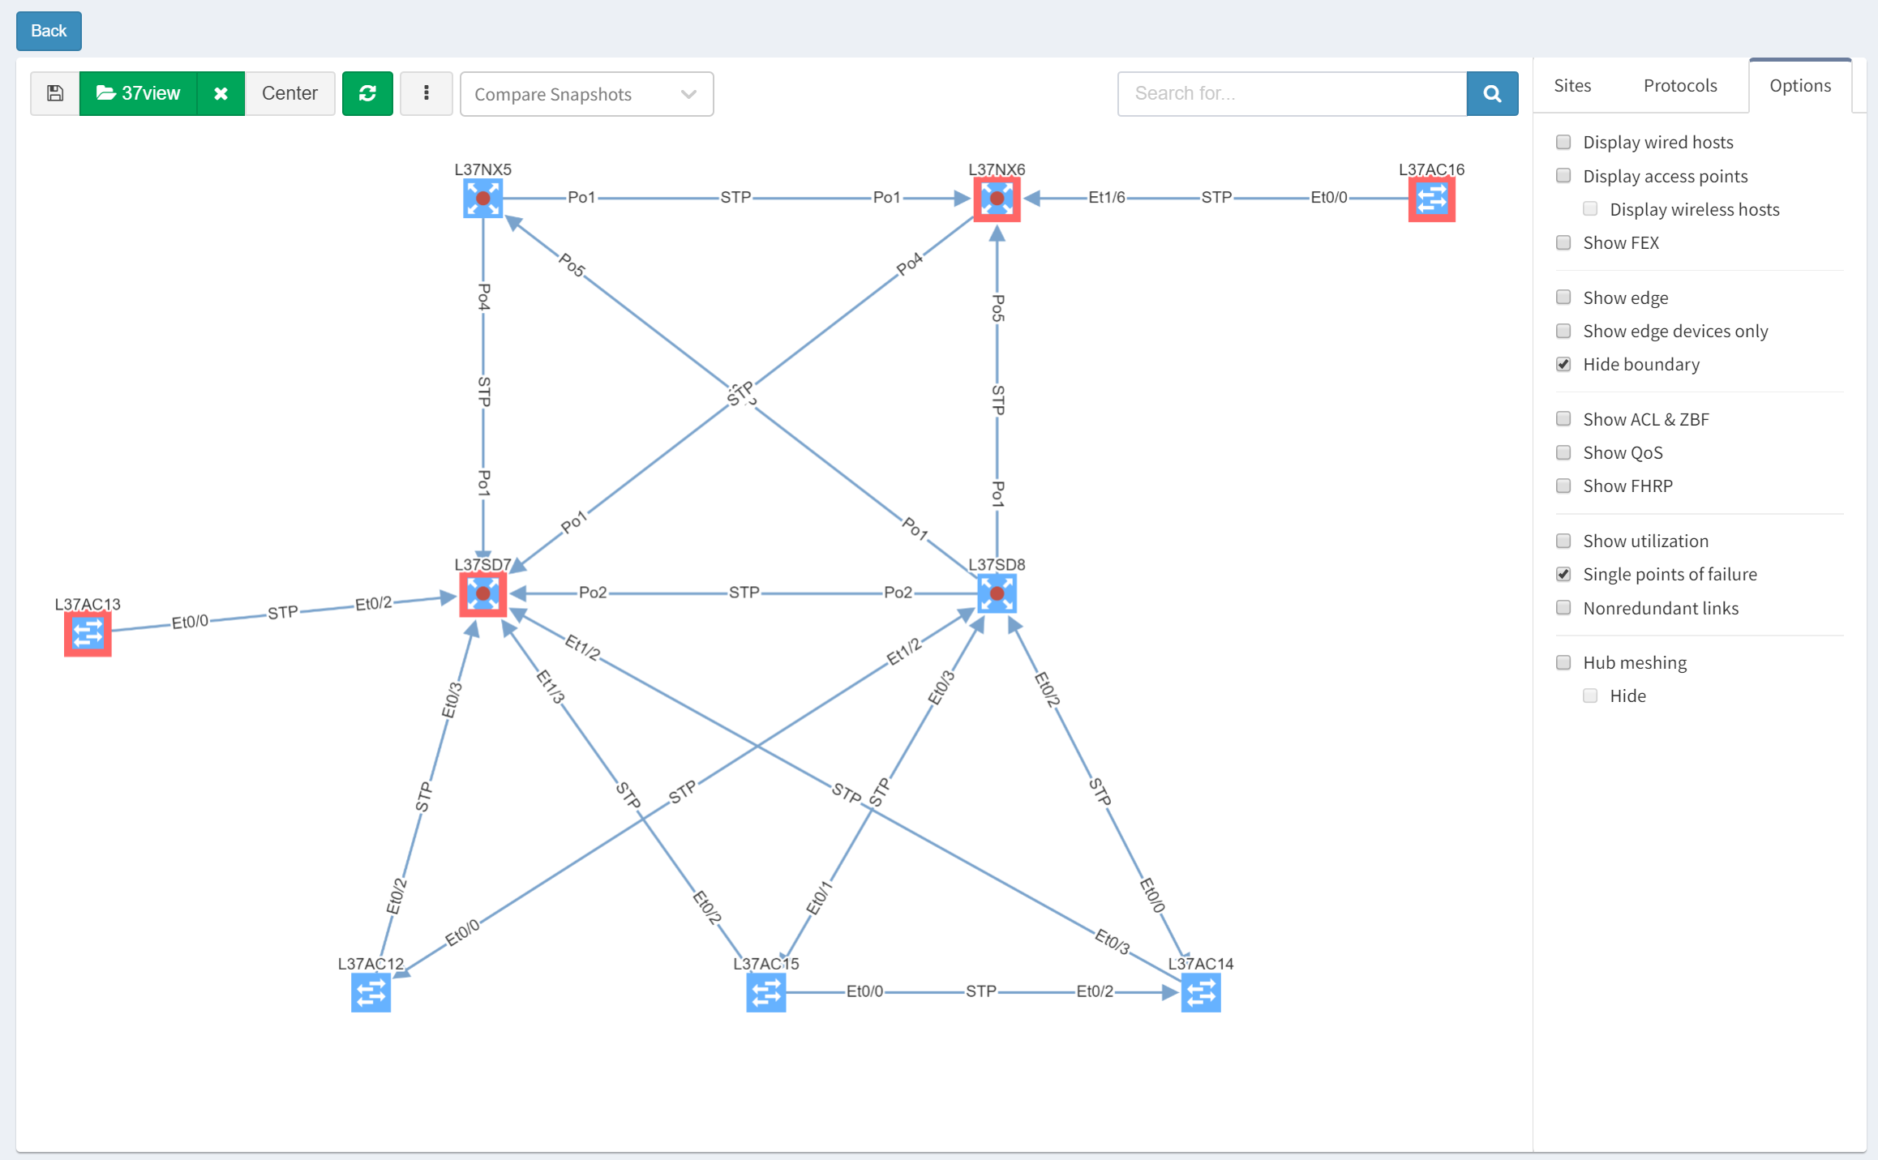
IP Fabric is able to analyse and interpret relationships between devices both upstream and downstream. In this case, switches are shown as SPOFs because they are the sole upstream devices for some access switches.
As we've seen, IP Fabric's powerful visualisation helps us appreciate problems in topologies, but there are alternative and equally powerful views of the network. For example, you can check a simulated path between hosts for single points of failure. Select Diagrams | End-to-end path. After submitting source and destination IPs, non-redundant devices can be highlighted along the path.
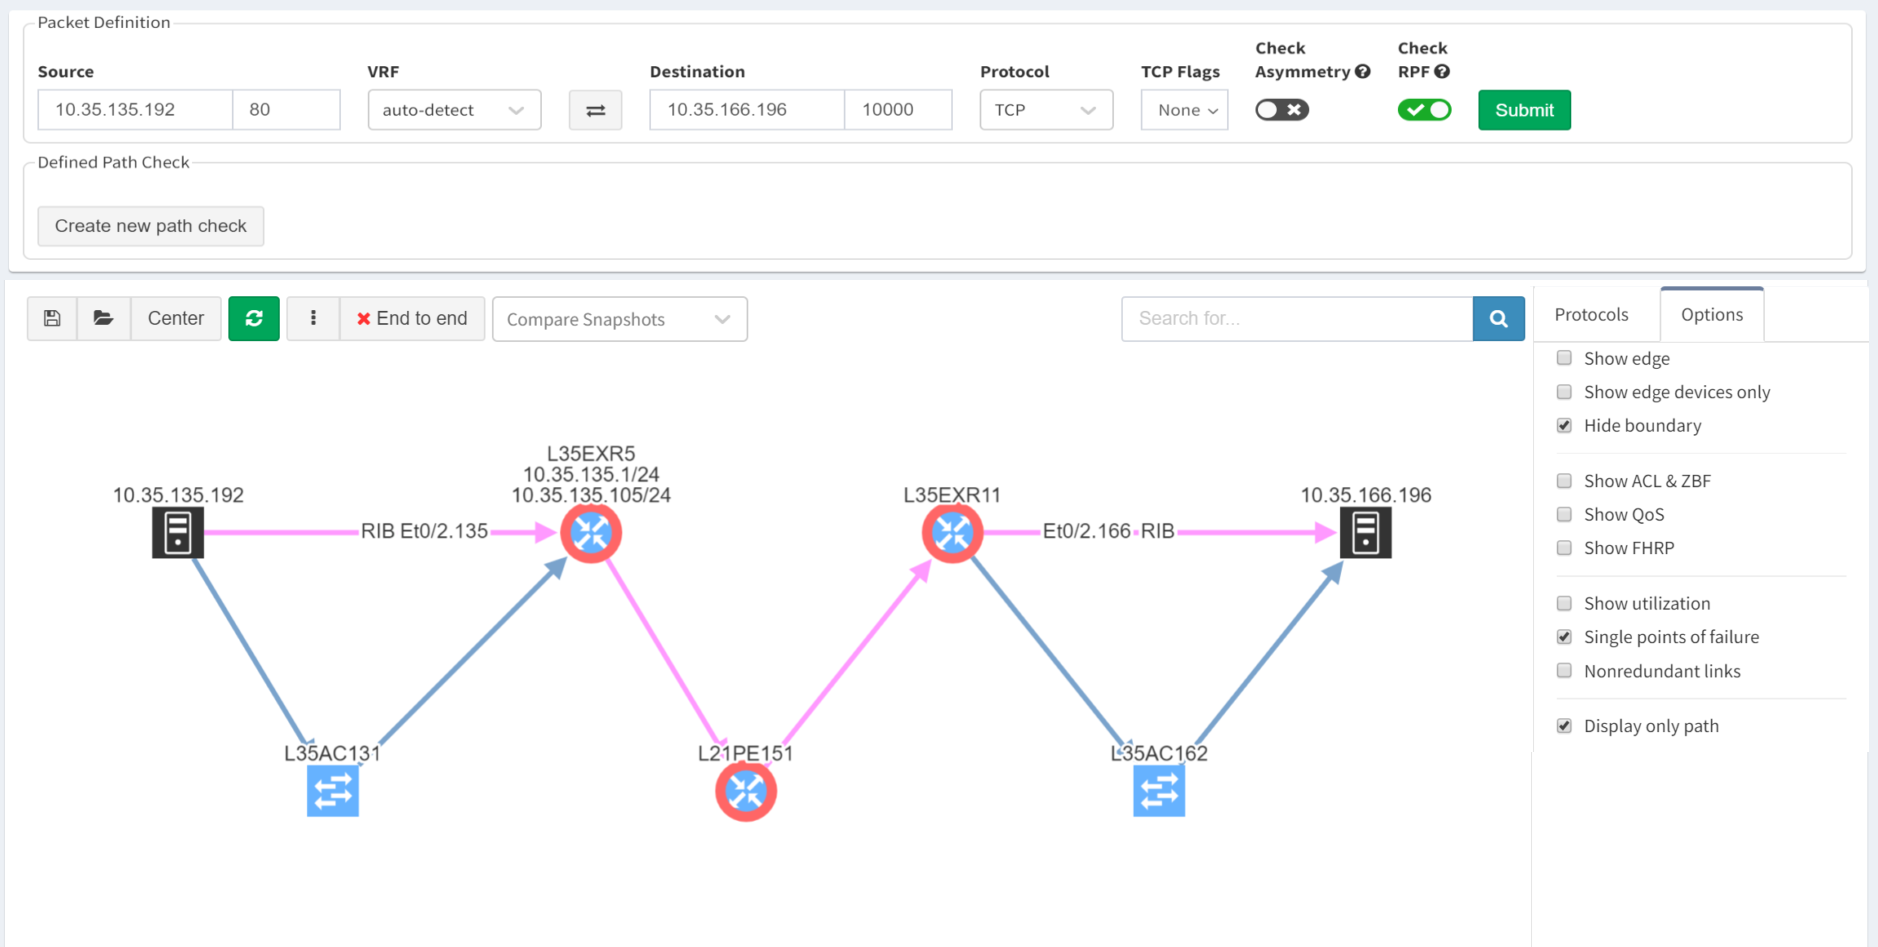
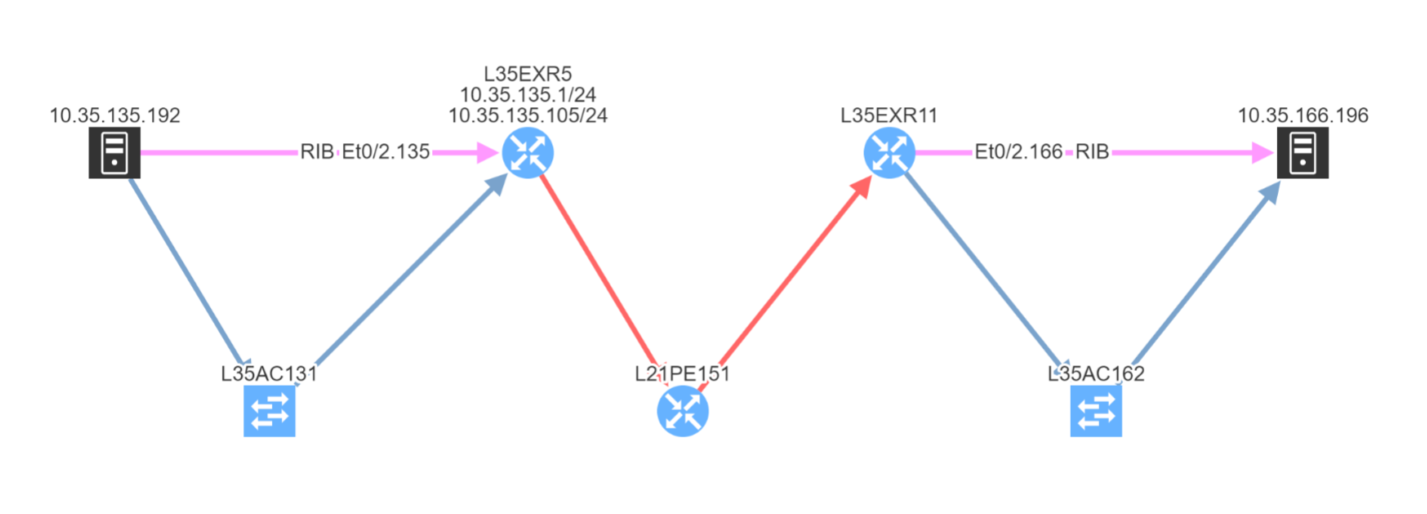
Subtly different, you are also able to highlight non-redundant links, showing where there is a strict dependency on the link to ensure an end-to-end path between the hosts.
So you can see how IP Fabric has saved you huge amounts of time and effort spotting single points of failure in your network topology. And now you are in a position to proactively remediate before this becomes a problem!
If you have found this article helpful, please follow our company’s LinkedIn or Blog, where more content will be emerging. If you would like to test our solution to see for yourself how IP Fabric can help you manage your network more effectively, please contact us through www.ipfabric.io.
There are many elements that contribute to the availability of services delivered across any network. Redundancy in the topology, coupled with resilience in the configuration are key. Routing protocols are used to manage that redundancy and failover to backup traffic paths should a failure occur in the active path. For this to work successfully, it is vital that the environment remains as stable as possible and is not subject to constant change. IP Fabric can help you by analyzing routing protocol stability and pinpointing issues.
As we know, the stability of BGP peering can cause performance problems with large networks. Events such as link failures can trigger sequences of updates along paths in the network - this can cause:
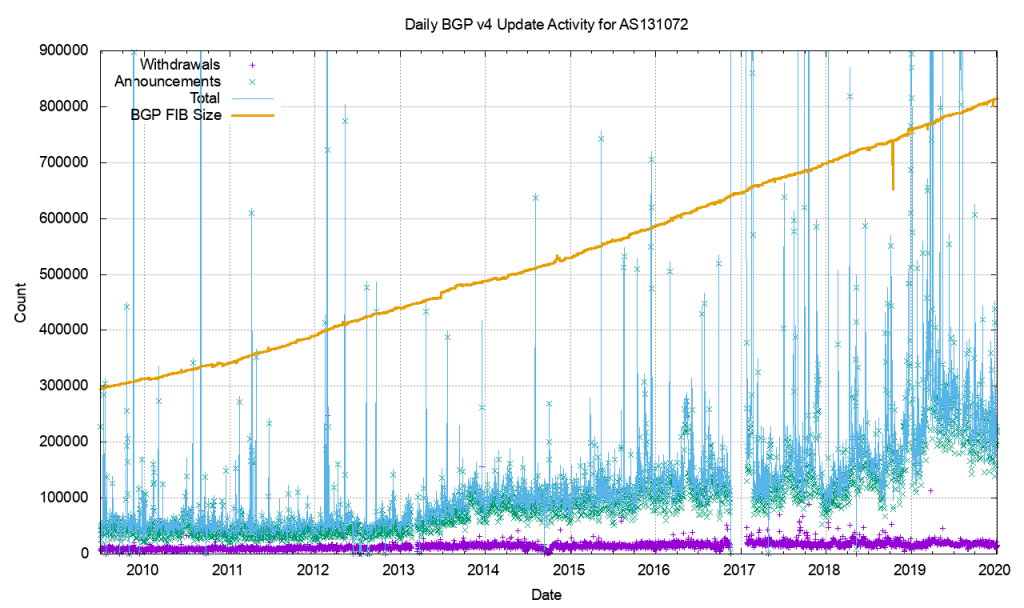
As an example of this, consider that the Internet routing table has reached such a size that it never actually fully converges. This is a symptom of the churn - the number of updates and withdrawals - caused by link events within and between ASs which of course occur around the clock!
BGP is usually used in an enterprise to connect together networks that are managed by different organizations or different parts of the same organization. It follows then that once established, the connections should stay up and remain so. Fluctuations in that connectivity have the potential to have far-reaching consequences and so it pays to keep track of the stability of that peering.
But how do we measure that stability? In particular, we might address this by focussing on two particular elements. For each BGP peering relationship in the network we might look to answer two questions:
In order to check that manually, a network analyst might have to
Or you could spend the time to write the scripts and develop the tooling to automate the process so you can repeat the checks at regular intervals.
Alternatively, you could give the job to IP Fabric.
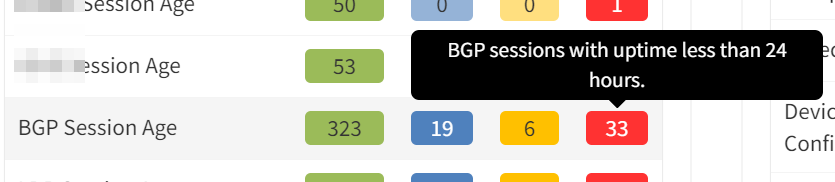
IP Fabric analyses configuration and operational state of the devices in the network records them in a vendor-agnostic form in its database, then runs 120+ standard validation checks and presents the results on the product dashboard. These checks include identifying BGP peering across platforms and vendors and checking the relationships for the length of the establishment of peering:
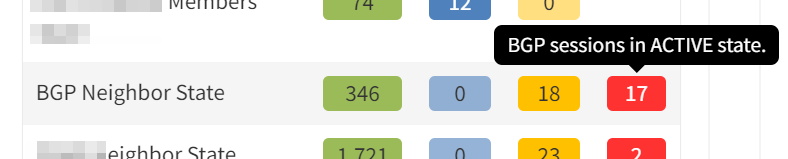
and for current state:
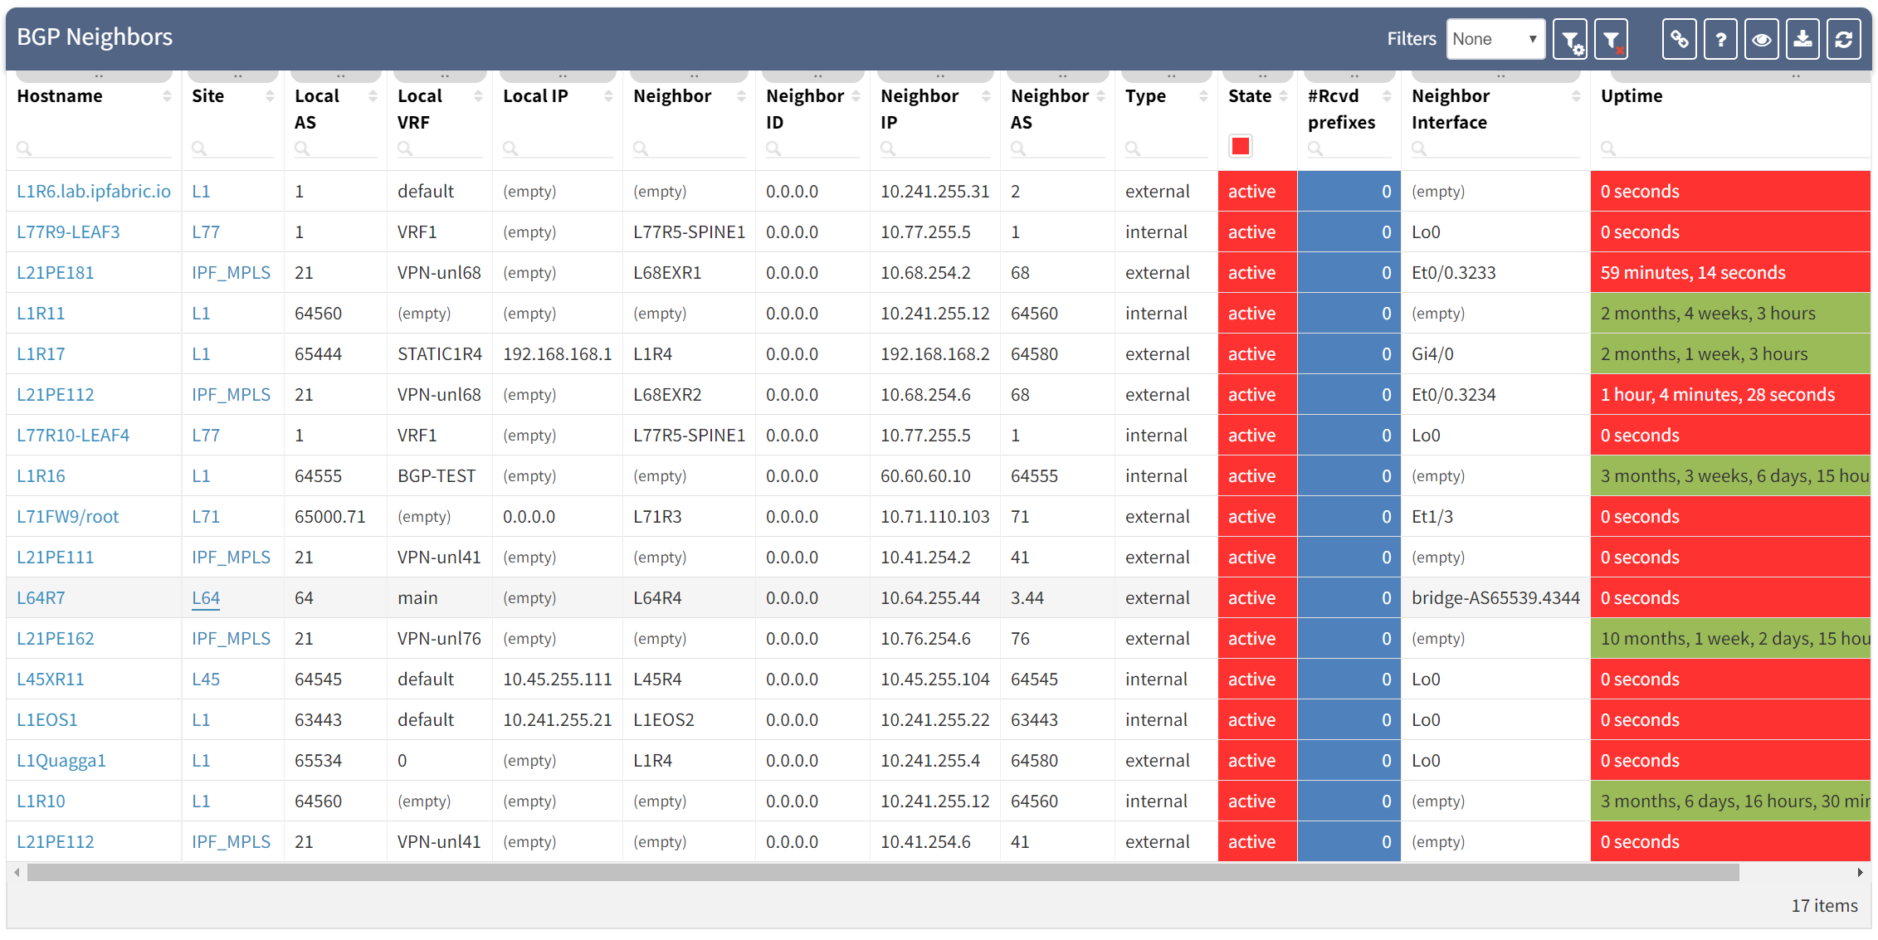
Clicking through the dashboard on peerings in an active state shows a table of the details for those peerings, and you have all the details to hand.
Taking a step further, click through the site location in the table to see the topology with the peering in question from the "live" documentation:
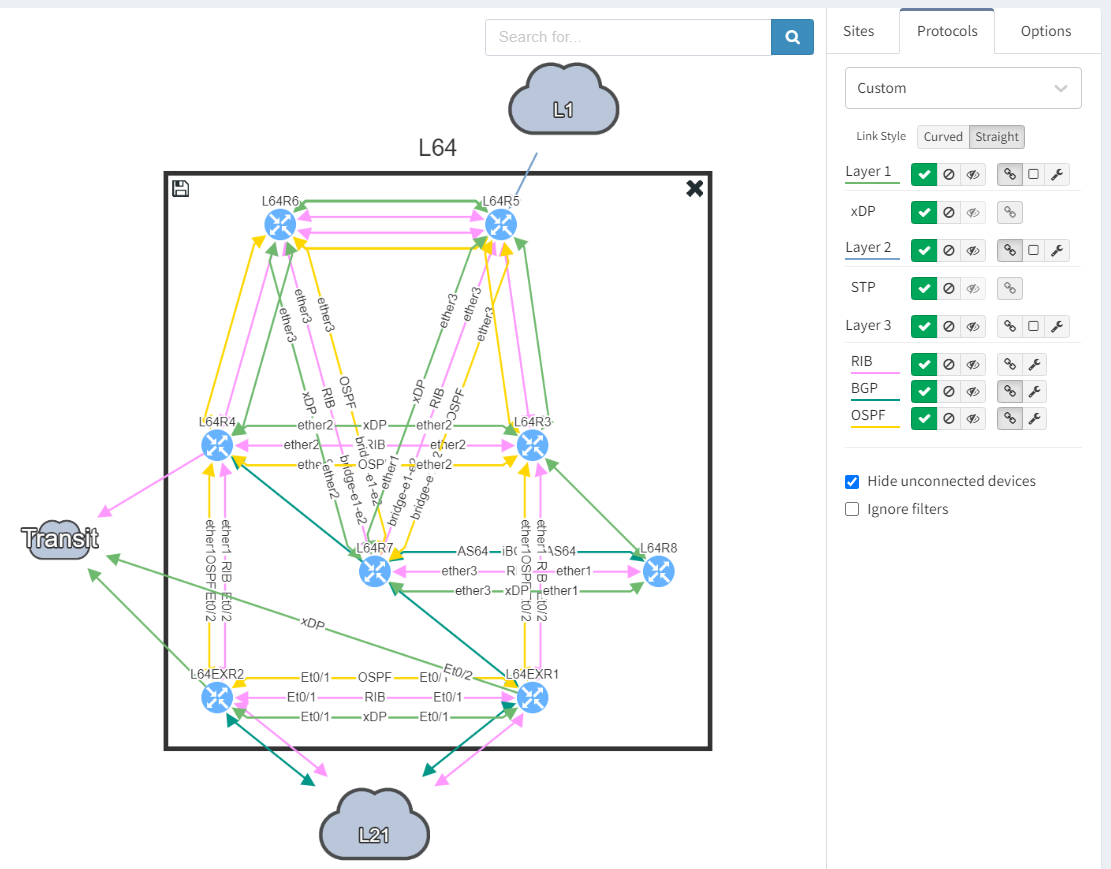
Next, we focus on BGP topology by disabling all other protocols and enable the BGP Compliance intent verification check.
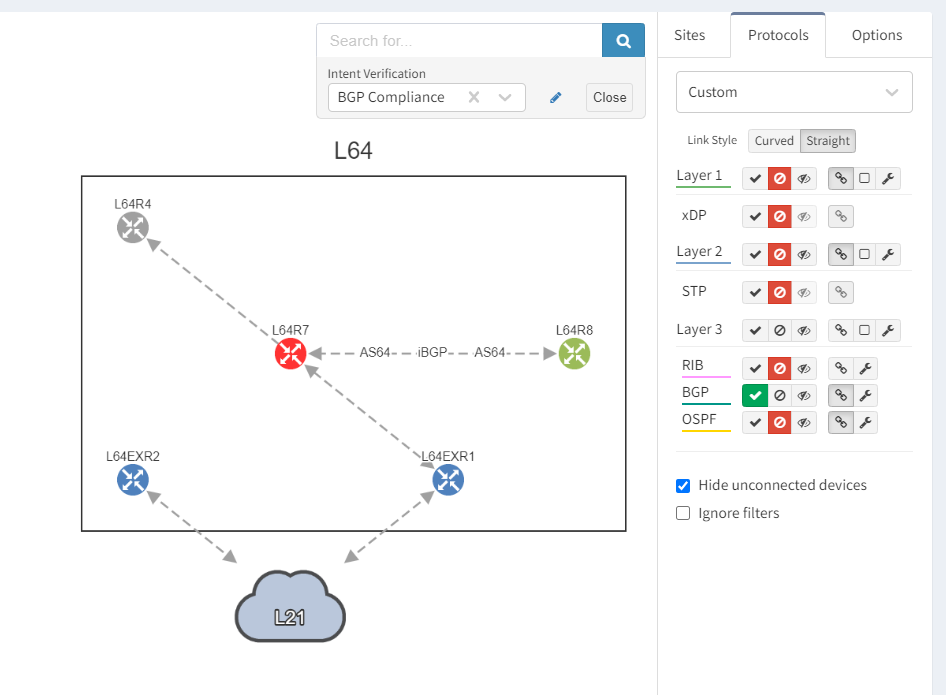
We can see that the platform has highlighted the problem with L64R7. IP Fabric presents information on the problematic peering with L64R4 when we select the router in question. The implication here is that L64R4 is not configured to peer with L64R7.
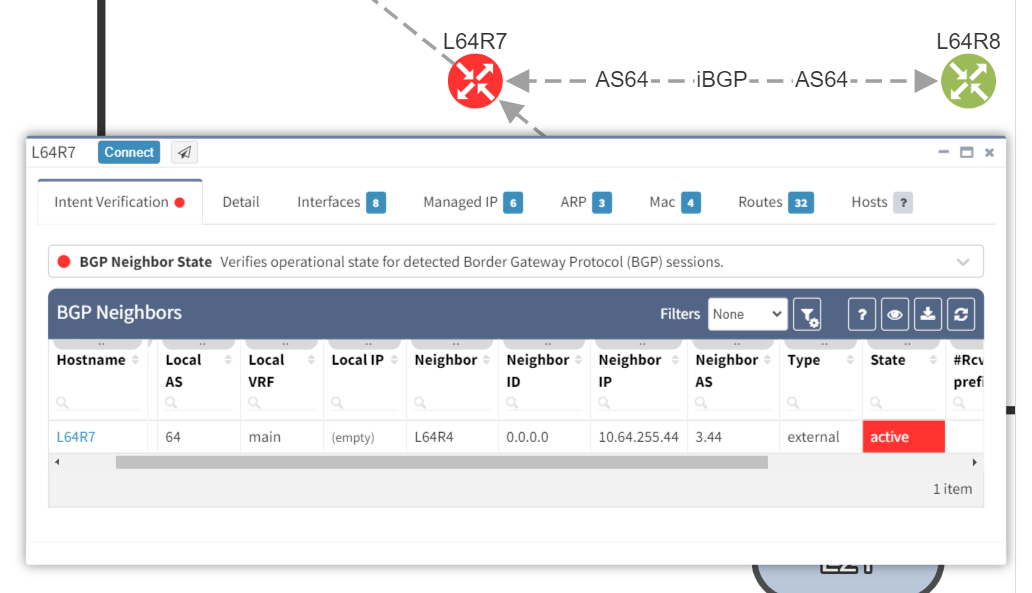
It is apparent that the peering appears to be configured in one direction and not the other from the arrows in the diagram. From the table, it looks like an IP address doesn't appear to be assigned to the peering. On inspecting the routers we can see that L64R7 looks fine:
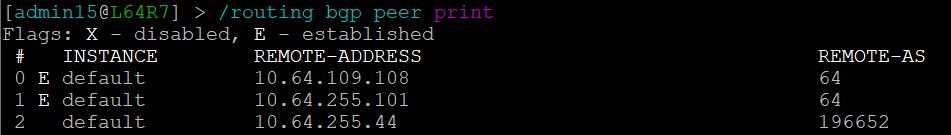
but the peering is disabled on L64R4:

And so IP Fabric has allowed us to drill down and reach the conclusion far quicker than going through a process of having to extract the detail, analyze it and troubleshoot manually.
If you have found this article helpful, please follow our company’s LinkedIn or Blog, where more content will be emerging. If you would like to test our solution to see for yourself how IP Fabric can help you manage your network more effectively, please contact us through www.ipfabric.io.


