IP Fabric's GUI provides you with Excel-like tables for filtering and querying data, but sometimes engineers require data to be extracted for more advanced reporting or Power BI dashboards. In this blog, I will demonstrate how to directly connect IP Fabric to Microsoft Excel or Power BI without using CSV exports. This has been simplified into functions stored in template files allowing you to pull any IP Fabric table in seconds!
Documentation and template files are located in the IP Fabric Integrations GitLab.
You must have web API access to the IP Fabric server (default is port 443). If running these queries from Excel in Office 365 or Power BI in the cloud, your IP Fabric instance must be reachable from the public Internet.
Microsoft Excel and Power BI will only allow you to communicate with websites that have valid and trusted SSL certificates. The easiest solution is to install a trusted certificate on the IP Fabric server that has been signed by a CA in your Trusted Root Certification Authorities. If you are unable to create a signed certificate you are also able to use a self-signed cert and install it on your location machine. This must be done for every user/computer that will be running the Power Query and you will not be allowed to run these queries in the Cloud.
Finally, you will also need to have, or create, an API Token. This token will be saved within the file (or the data source on powerbi.com) so sharing is not recommended. We recommend either removing your personal token before sharing the file (or posting the file to a shared cloud space, i.e. SharePoint) or creating a limited read-only account and API token. If you need more information or assistance with read-only accounts and RBAC please reach out to your Solution Architect.
After opening either the Excel or Power BI template file there are two required configurations that must be done prior to accessing data. You may be required to accept some warning messages about communicating with external content prior to being able to continue.
In Excel open the Data Ribbon and click "Queries & Connections" and right-click the IPF_URL query and select edit. This will bring up the Power Query Editor where you are able to input your information. Example configuration:
12dd8c61-129c-431a-b98b-4c9211571f89If you are using Power BI when you open the template file you will be prompted with a pop-up to enter these variables. To access the Power Query Editor simply click "Transform data" in the Queries section of the Home ribbon.
Finally, you should be asked about data source settings prior to connecting, if not then select the Snapshots connection and in the Home ribbon in the Power Query Editor select select Refresh Preview. For the Credentials select Anonymous and for Privacy level either check the Ignore Privacy Levels box or select any level and press save. Once completed you should now see a table of the loaded Snapshots.
The queryIPF function simplifies the pulling of data with only one required parameter, the API endpoint of the table. This can be located by selecting the Table Description or the ? icon on any of the tables and copying the URL under the API Description. For example, I would like to pull my Inventory > Devices table into Excel.
The reports variable defaults to false, setting to true will include the Intent Checks for the table if any are configured. This will be a new column named colname.severity where severity equals one of the following:
Once configured select Invoke (the epochCols and durationCols can be specified after invoking the function which will be discussed later).
Now we have the Inventory > Devices table loaded. Changing the Properties > Name will change the Excel Worksheet name so it is recommended to update this value. In this example I specified reports=true and we can see the new configReg.severity column.
Finally, click the Home ribbon Close & Load which will update work workbook or to add more tables simply repeat this process for each table you desire! It is really that simple.
Times in IP Fabric are stored in two different formats. When you use the API you will see that an integer is returned unlike when you view it in the GUI. Let's take a look at these formats:
colnameAsDatecolnameAsTimeIn the Device Inventory, the uptime can be converted into a human-readable format in Excel. Simply change the query by adding a list and the column name.
Original:
= queryIPF("https://demo1.us.ipfabric.io/api/v6.1/tables/inventory/devices", true, null, null)
Modified:
= queryIPF("https://demo1.us.ipfabric.io/api/v6.1/tables/inventory/devices", true, null, {"uptime"})
This then converts 3435180 into 39.18:13:00 (39 days, 18 hours, 13 minutes and 0 seconds.)
Epoch example with the End of Life detail table:
= queryIPF("https://demo1.us.ipfabric.io/api/v6.1/tables/reports/eof/detail", true, {"endSale", "endMaintenance", "endSupport"}, null)
As valuable as contextualized network data is for your engineering teams, we know how insightful it can be also for adjacent teams, leadership, or third parties. Using our IP Fabric-developed Excel and Power BI template files, you can communicate directly with IP Fabric without exporting CSVs, seamlessly leveraging this data for high-level and detailed reports and presentations.
If you found this interesting and want to implement this in your environment, please look at the following quick videos for a visual demonstration and more advanced information. This includes how to work with nested objects and/or lists as well as joining tables. Reach out to your IP Fabric Solution Architect for more information or assistance!
Want to try out IP Fabric yourself? Sign up for our self-guided demo and see what automated assurance could do for your network teams.
IP Fabric's GUI provides you with Excel-like tables for filtering and querying data, but sometimes engineers require data to be extracted for more advanced reporting or Power BI dashboards. In this blog, I will demonstrate how to directly connect IP Fabric to Microsoft Excel or Power BI without using CSV exports. This has been simplified into functions stored in template files allowing you to pull any IP Fabric table in seconds!
Documentation and template files are located in the IP Fabric Integrations GitLab.
You must have web API access to the IP Fabric server (default is port 443). If running these queries from Excel in Office 365 or Power BI in the cloud, your IP Fabric instance must be reachable from the public Internet.
Microsoft Excel and Power BI will only allow you to communicate with websites that have valid and trusted SSL certificates. The easiest solution is to install a trusted certificate on the IP Fabric server that has been signed by a CA in your Trusted Root Certification Authorities. If you are unable to create a signed certificate you are also able to use a self-signed cert and install it on your location machine. This must be done for every user/computer that will be running the Power Query and you will not be allowed to run these queries in the Cloud.
Finally, you will also need to have, or create, an API Token. This token will be saved within the file (or the data source on powerbi.com) so sharing is not recommended. We recommend either removing your personal token before sharing the file (or posting the file to a shared cloud space, i.e. SharePoint) or creating a limited read-only account and API token. If you need more information or assistance with read-only accounts and RBAC please reach out to your Solution Architect.
After opening either the Excel or Power BI template file there are two required configurations that must be done prior to accessing data. You may be required to accept some warning messages about communicating with external content prior to being able to continue.
In Excel open the Data Ribbon and click "Queries & Connections" and right-click the IPF_URL query and select edit. This will bring up the Power Query Editor where you are able to input your information. Example configuration:
12dd8c61-129c-431a-b98b-4c9211571f89If you are using Power BI when you open the template file you will be prompted with a pop-up to enter these variables. To access the Power Query Editor simply click "Transform data" in the Queries section of the Home ribbon.
Finally, you should be asked about data source settings prior to connecting, if not then select the Snapshots connection and in the Home ribbon in the Power Query Editor select select Refresh Preview. For the Credentials select Anonymous and for Privacy level either check the Ignore Privacy Levels box or select any level and press save. Once completed you should now see a table of the loaded Snapshots.
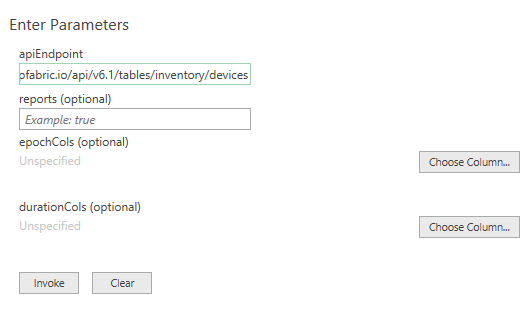
The queryIPF function simplifies the pulling of data with only one required parameter, the API endpoint of the table. This can be located by selecting the Table Description or the ? icon on any of the tables and copying the URL under the API Description. For example, I would like to pull my Inventory > Devices table into Excel.
The reports variable defaults to false, setting to true will include the Intent Checks for the table if any are configured. This will be a new column named colname.severity where severity equals one of the following:
Once configured select Invoke (the epochCols and durationCols can be specified after invoking the function which will be discussed later).
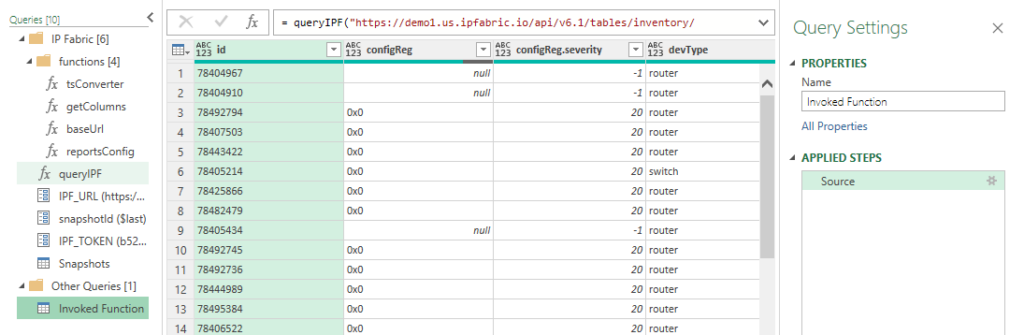
Now we have the Inventory > Devices table loaded. Changing the Properties > Name will change the Excel Worksheet name so it is recommended to update this value. In this example I specified reports=true and we can see the new configReg.severity column.
Finally, click the Home ribbon Close & Load which will update work workbook or to add more tables simply repeat this process for each table you desire! It is really that simple.
Times in IP Fabric are stored in two different formats. When you use the API you will see that an integer is returned unlike when you view it in the GUI. Let's take a look at these formats:
colnameAsDatecolnameAsTimeIn the Device Inventory, the uptime can be converted into a human-readable format in Excel. Simply change the query by adding a list and the column name.
Original:
= queryIPF("https://demo1.us.ipfabric.io/api/v6.1/tables/inventory/devices", true, null, null)
Modified:
= queryIPF("https://demo1.us.ipfabric.io/api/v6.1/tables/inventory/devices", true, null, {"uptime"})
This then converts 3435180 into 39.18:13:00 (39 days, 18 hours, 13 minutes and 0 seconds.)
Epoch example with the End of Life detail table:
= queryIPF("https://demo1.us.ipfabric.io/api/v6.1/tables/reports/eof/detail", true, {"endSale", "endMaintenance", "endSupport"}, null)
As valuable as contextualized network data is for your engineering teams, we know how insightful it can be also for adjacent teams, leadership, or third parties. Using our IP Fabric-developed Excel and Power BI template files, you can communicate directly with IP Fabric without exporting CSVs, seamlessly leveraging this data for high-level and detailed reports and presentations.
If you found this interesting and want to implement this in your environment, please look at the following quick videos for a visual demonstration and more advanced information. This includes how to work with nested objects and/or lists as well as joining tables. Reach out to your IP Fabric Solution Architect for more information or assistance!
Want to try out IP Fabric yourself? Sign up for our self-guided demo and see what automated assurance could do for your network teams.