BGP is famously known for being the routing protocol of the internet, but not only. A lot of companies are using BGP in their internal network. One of the main reasons for that: it allows great control and flexibility with routing exchange.
As with any routing protocol and critical connectivity, we want to ensure we are resilient to failure and that the resiliency is operational. With BGP, to do so, we need to have a closer look at the received prefixes.
Let's take a classic example, where you would have two devices connected to an external party. This could be your ISP, MPLS provider…
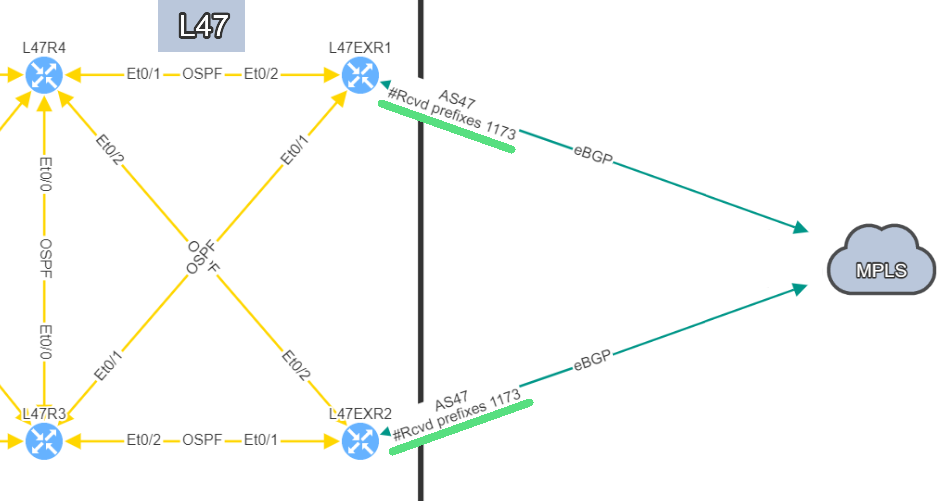
In this example, site L47, on the left, is connected to site L21 which is your MPLS cloud.
You have your two eBGP sessions established with the MPLS cloud, that's great! Now you want to ensure that you are resilient by checking the receive routes from the provider on both links. This is how you will be able to reach any of your sites connected to the MPLS cloud.
In this situation, if one link fails, you have full resiliency. You will not lose connectivity to your MPLS network and all the services hosted outside site L47.
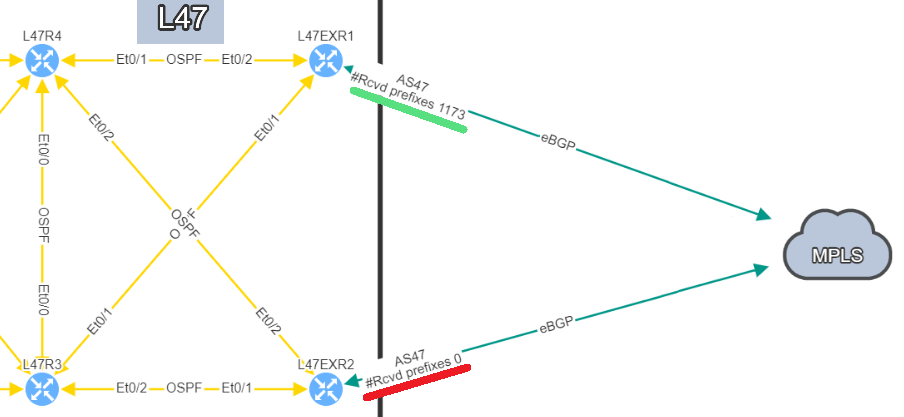
In this situation, if you lose L47EXR1 or the link between this router and site L21, your secondary link will not be able to forward any traffic. L47EXR2 is not receiving any routes.
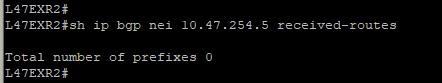
This is what you would see on your device:
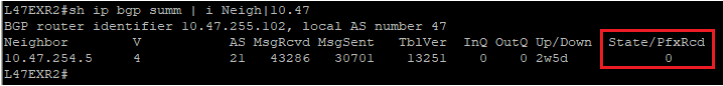
The fact that you can see State/PfxRcd showing "0" tells you the BGP session is established, otherwise, you would see the current state (Idle, Active...). Any other number would be good, unfortunately in this scenario, you are not receiving any route.
You are now in a situation where you do not have any resiliency, and your monitoring system is not alerting us on the issue.
That’s a very good question! In a situation like this one, the BGP session is not affected, which means there is no error generated by the router. The device will not send Syslog messages or SNMP traps to inform your monitoring system that you are not receiving any routes.
That's where IP Fabric can play a crucial role to identify the issue quickly before it causes any damages. There are several ways to see the problem:
The IP Fabric dashboard provides an overview of the network analysis results, including issues and links to the detailed reports.
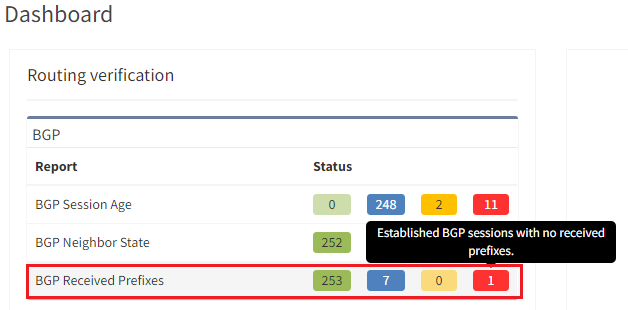
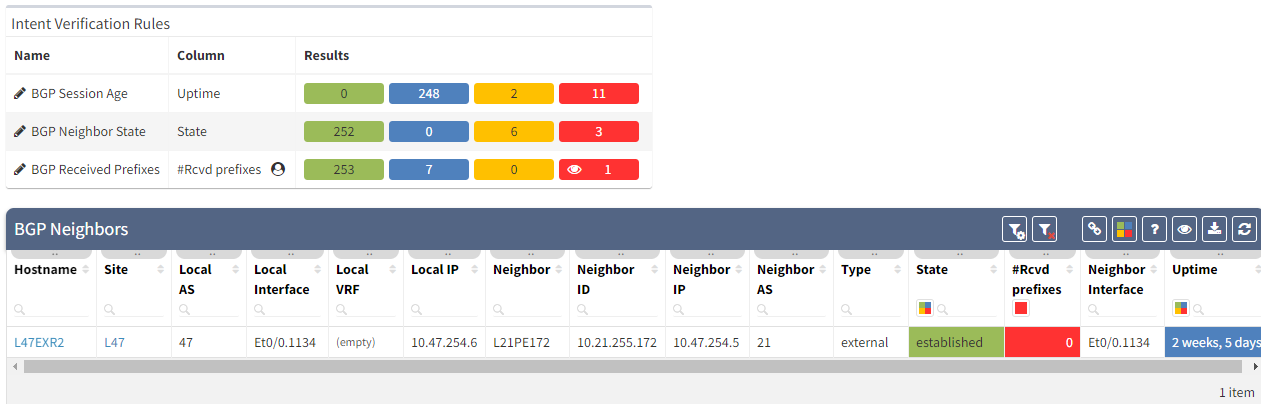
After seeing this table, you will want to check further details regarding the issue. Just click on the interesting number, and you will be redirected to the appropriate technology page and the intent verifications.
As we have seen at the beginning, you will be able to check directly on the diagram the number of received prefixes for a specific neighbor.
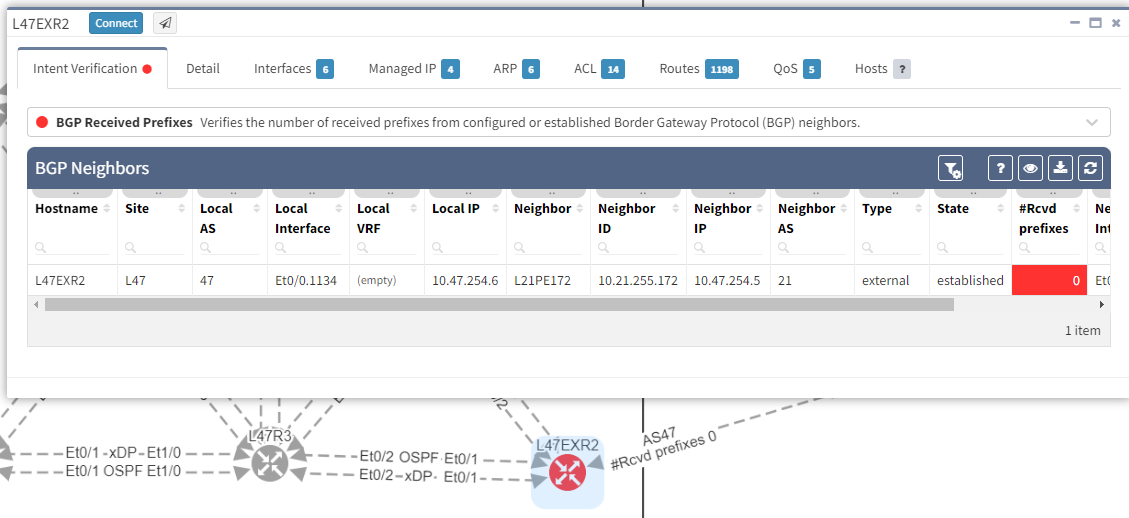
It's also possible to display on the diagram the verification information from all the supported technologies. In this example, we will add the BGP information on the diagram for site 47:
The moment we select the verification to add to the diagram, we can see L47EXR2 becomes red. If we click on the device, we will see the explanation on why it's showing red:
In addition, we can spot this issue by looking at the end-to-end path. Let's take an example where we are looking at the path from a source in site L47 to a destination in site L66, which is connected to the MPLS cloud.
In a normal situation, we would expect to see the traffic being able to use both links to reach the MPLS cloud:
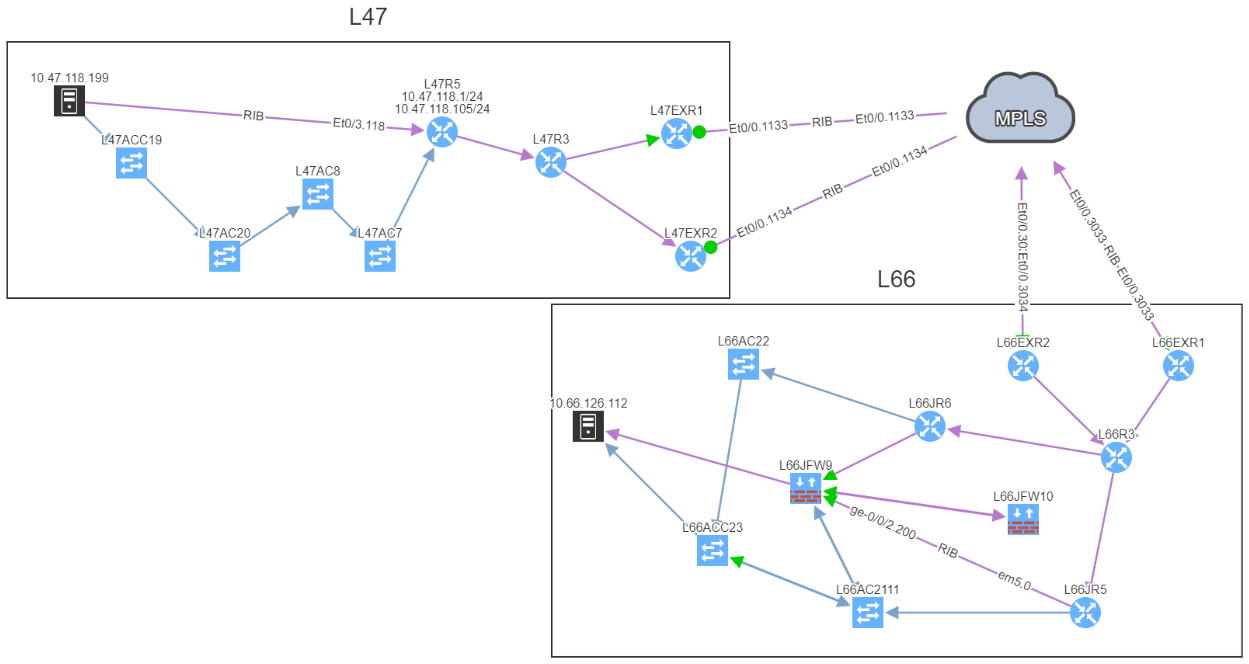
If we now compare with the snapshot where we have the issue, we can clearly see that we have lost our resiliency:
You can't ensure BGP resiliency if you do not look at the received prefixes. The main issue with this situation is the fact that your monitoring system will not be able to inform you of the loss of received prefixes. The last thing you want is to face a massive outage because of one link failure and your secondary link was not operational.
I have been in that exact situation previously, and let's just say I did not enjoy writing the postmortem explaining why we did not know our redundant path wasn't working. It's not a situation you want to be in...
If you would like to find out more about IP Fabric and how it can help improve your existing infrastructure by detecting issues you are not aware of, please contact us through www.ipfabric.io! You can also follow our company’s LinkedIn or Blog, where more content will be emerging.
There are many elements that contribute to the availability of services delivered across any network. Redundancy in the topology, coupled with resilience in the configuration are key. Routing protocols are used to manage that redundancy and failover to backup traffic paths should a failure occur in the active path. For this to work successfully, it is vital that the environment remains as stable as possible and is not subject to constant change. IP Fabric can help you by analyzing routing protocol stability and pinpointing issues.
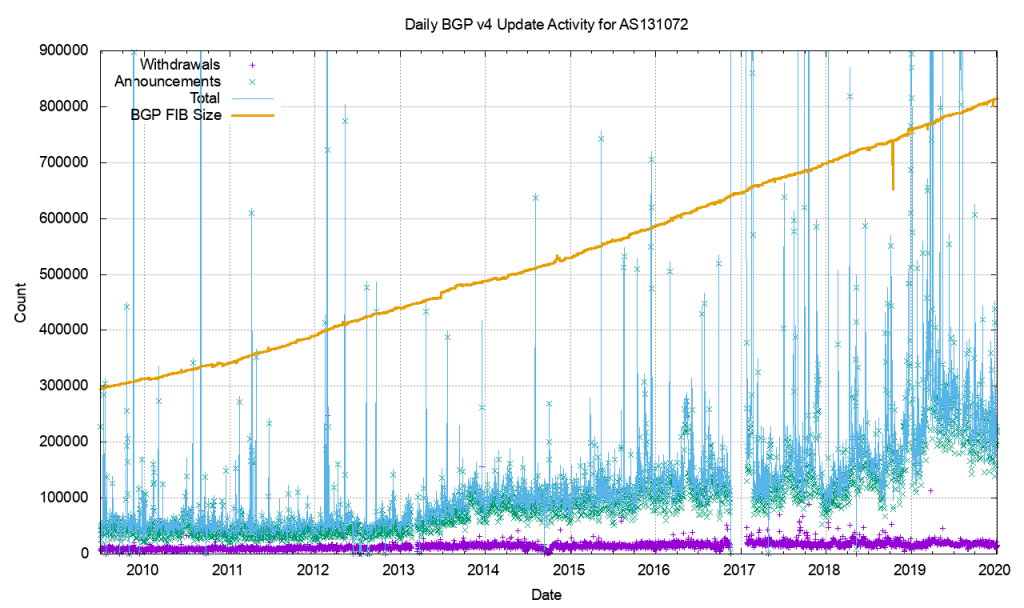
As we know, the stability of BGP peering can cause performance problems with large networks. Events such as link failures can trigger sequences of updates along paths in the network - this can cause:
As an example of this, consider that the Internet routing table has reached such a size that it never actually fully converges. This is a symptom of the churn - the number of updates and withdrawals - caused by link events within and between ASs which of course occur around the clock!
BGP is usually used in an enterprise to connect together networks that are managed by different organizations or different parts of the same organization. It follows then that once established, the connections should stay up and remain so. Fluctuations in that connectivity have the potential to have far-reaching consequences and so it pays to keep track of the stability of that peering.
But how do we measure that stability? In particular, we might address this by focussing on two particular elements. For each BGP peering relationship in the network we might look to answer two questions:
In order to check that manually, a network analyst might have to
Or you could spend the time to write the scripts and develop the tooling to automate the process so you can repeat the checks at regular intervals.
Alternatively, you could give the job to IP Fabric.
IP Fabric analyses configuration and operational state of the devices in the network records them in a vendor-agnostic form in its database, then runs 120+ standard validation checks and presents the results on the product dashboard. These checks include identifying BGP peering across platforms and vendors and checking the relationships for the length of the establishment of peering:
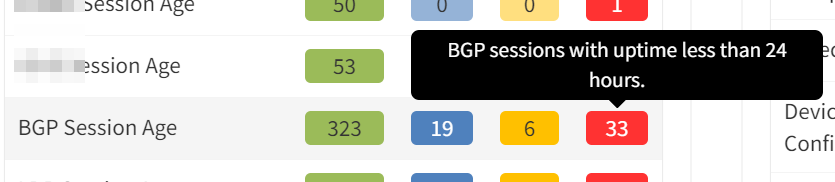
and for current state:
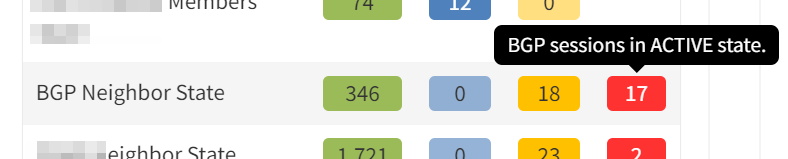
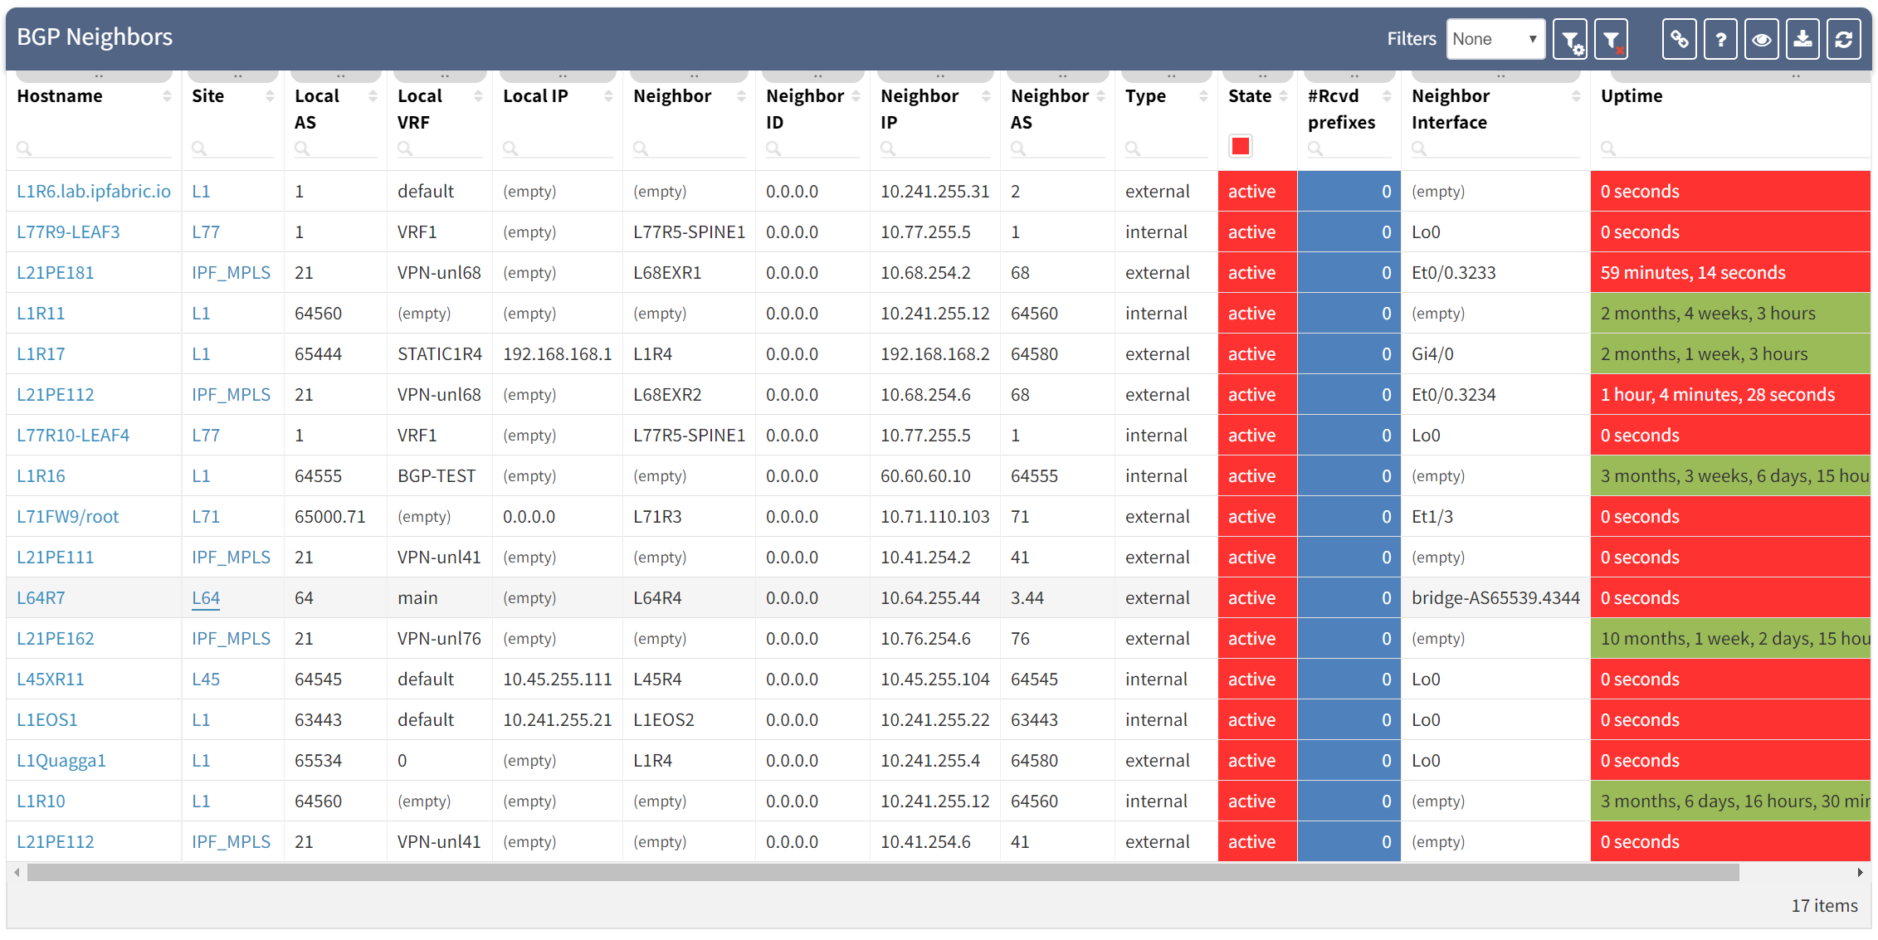
Clicking through the dashboard on peerings in an active state shows a table of the details for those peerings, and you have all the details to hand.
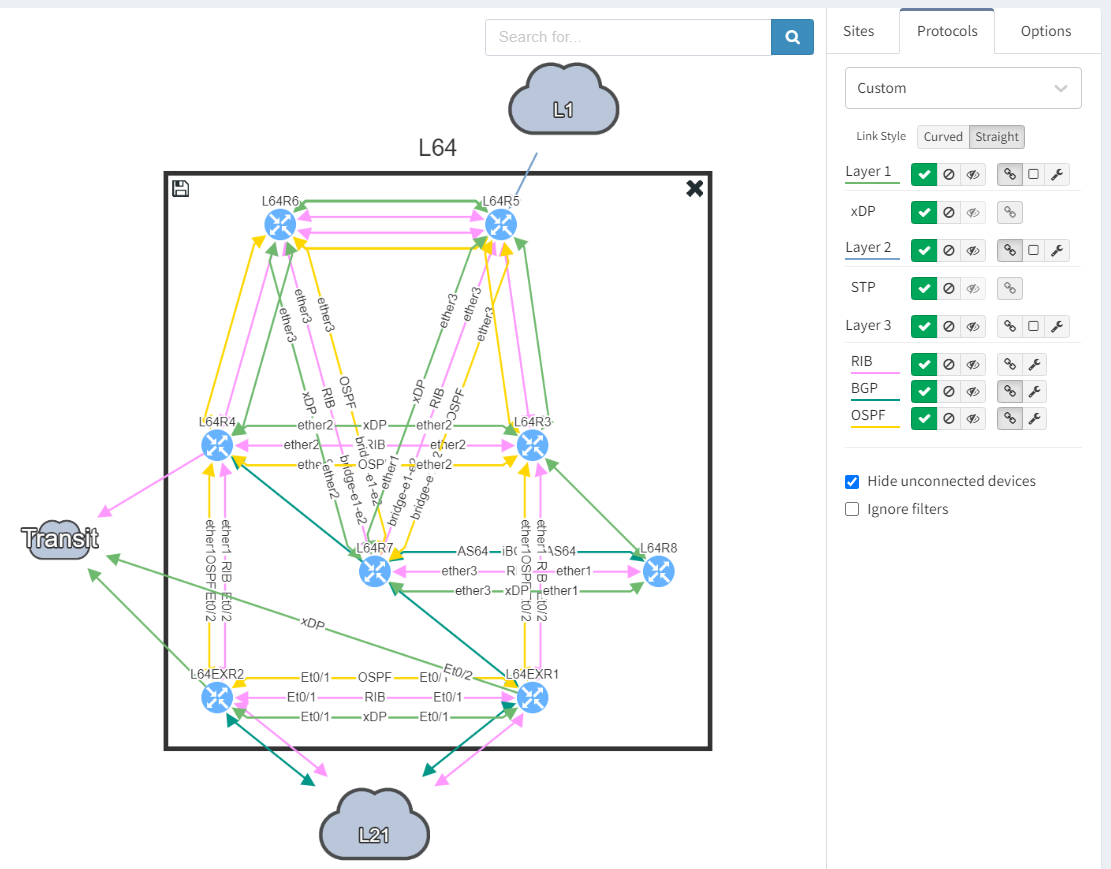
Taking a step further, click through the site location in the table to see the topology with the peering in question from the "live" documentation:
Next, we focus on BGP topology by disabling all other protocols and enable the BGP Compliance intent verification check.
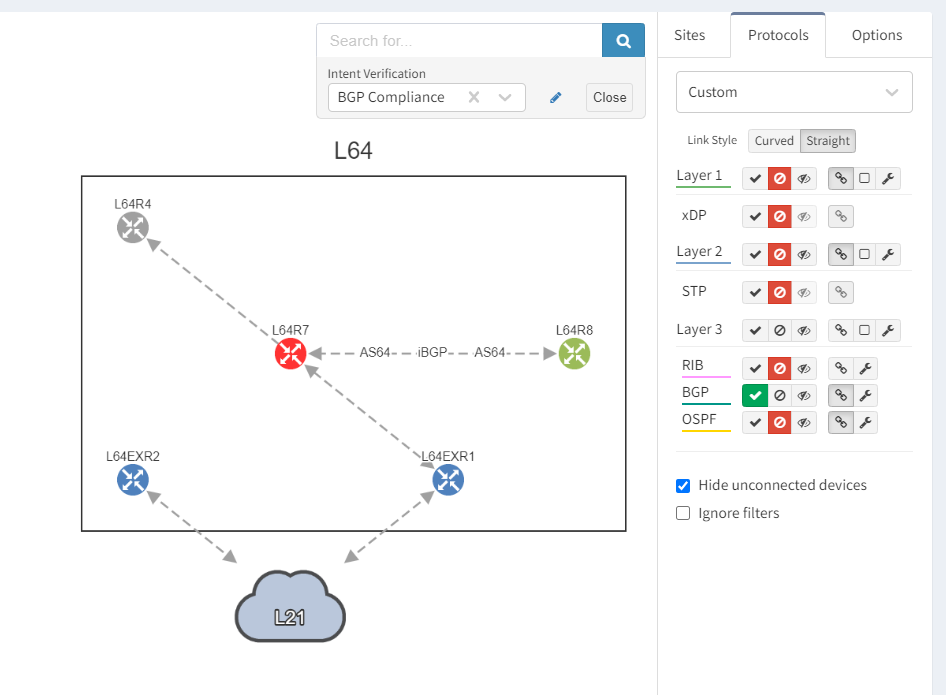
We can see that the platform has highlighted the problem with L64R7. IP Fabric presents information on the problematic peering with L64R4 when we select the router in question. The implication here is that L64R4 is not configured to peer with L64R7.
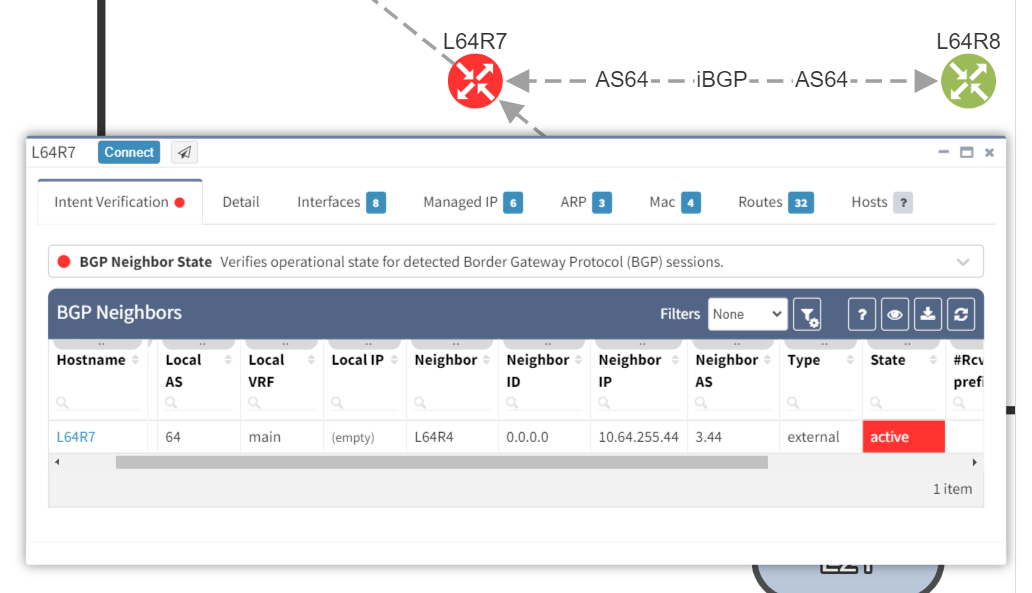
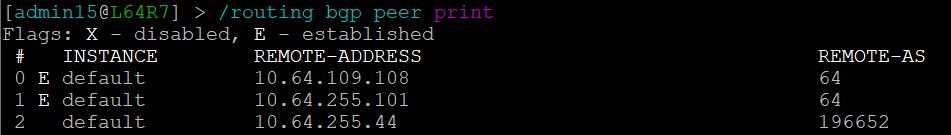
It is apparent that the peering appears to be configured in one direction and not the other from the arrows in the diagram. From the table, it looks like an IP address doesn't appear to be assigned to the peering. On inspecting the routers we can see that L64R7 looks fine:
but the peering is disabled on L64R4:

And so IP Fabric has allowed us to drill down and reach the conclusion far quicker than going through a process of having to extract the detail, analyze it and troubleshoot manually.
If you have found this article helpful, please follow our company’s LinkedIn or Blog, where more content will be emerging. If you would like to test our solution to see for yourself how IP Fabric can help you manage your network more effectively, please contact us through www.ipfabric.io.


