Back in 2017, a report by Gartner stated that the trends in network evolution were being outstripped by developments in the rest of the infrastructure, with a view to delivering business services in an agile, scalable, and resilient manner. 4 years on and with developments in pockets of the network via SDN deployment, it seems the rest of the network is beginning to catch up, however only in concentrated pockets.
IP Fabric recently held our inaugural #CommunityFabric webinar with delegates from the EMEA network automation community representing architectural leadership, automation gurus, and renowned certification instructors throwing their hat in the ring for a discussion on all things network automation. The discussion highlighted the disconnect between technical teams and leadership on the importance of network automation and some clear takeaways for Technical and Business Leadership.
Resources – Engineers need to invest their time in adding network programmability to their arsenal of skills, but more so, businesses need to invest in their teams by aiding this transition however possible.
Top-down Strategy – A business hoping to reap the benefit of automation without a top-down strategy will end up with islands of automation, siloed teams and added complexity or worse, disenfranchised team members.
It's a Marathon, not a Sprint - Adopting network automation is not a silver bullet. Like any well actioned strategy it requires clear measurable goals, consistent and repeated communication and time to succeed, both financially and operationally.
Future trends and what is Network Assurance?
The introduction of automation into your strategy and technology stack represents an immense opportunity to deliver higher-value services to the business at greater speed and with improved security. Want to get the most of your hallmark investments in AWS or get the promised security improvements from your new policy and firewalls investment? Automation is the glue to piece together areas of specialised technology in a scalable and repeatable manner.
Manual processes are rife in network operations and whilst they dominate the time schedule of many of your engineering resources, deliver very little value back to the business. Automation promises to draw down these painstaking process steps, along with their associated cost and risk, allowing highly skilled and certified engineers to focus on what they were trained to do, architectural design, cybersecurity, and execution against your organisation's well-designed compliance framework.
Unfortunately, automation doesn’t represent a flick-of-a-switch investment and a clear path to value. It is a mantra and an ongoing investment particularly targeted at your engineering team members, their certification, skills, and mindset. Both mantra (read company mindset) and ongoing investment resonate with one thing, Top-down strategy. If you wait for automation to naturally flourish from individual engineers’ interests you’ll find yourself stuck in the laggard position in the market, not a good place to be from either an innovation or recruitment standpoint. If however, you build an organisation that not only praises engineers adding network programmability skills to their traditional network engineering knowledge and certification base, but creates an environment where automation-first is the prevailing mindset, you will be on the right path to reap the benefits.
Investing in an organisation’s technical Resources must be prioritised within the company’s strategy. IP Fabric’s lead partners either side of ‘the pond’ Axians in Europe and Myriad360 in the US, understand the value of automation both to their internal service delivery functions and externally to their customer-facing services and as such invest heavily in network programmability skills to help their customers along the journey to automation. This investment by your service provider partners will represent cost-saving on both sides of the fence, not necessarily in the overall invoice value but in how much of that invoice is being needlessly spent on low-value repetitive tasks as opposed to high-value transformational engagements.
As for Future Trends, well unfortunately the #CommunityFabric RoundTable discussion ran out of time before we got into the clouds of future possibility, however, do not fret, on May 27th the 2nd #CommunityFabric Roundtable will focus on exactly this, Next Generation Network Management (registration link below). What was clear from our delegates, however, was that automation isn’t a straight path with predictable trends, but a fluid community-based investment in greater networking practices and increasing returns from advanced technology, which requires fortitude from senior management to fully realise its true value to an organisation.
Some elements of the perfect automated network will be scripted from the ground up by the in-house resources and network programmability skills you’ve invested in. Some crucial functionalities will have already been built by commercial vendors of a different ilk. New-world vendors who’ll fit your Automation strategy will be interchangeable, subscription-based services with simple integration and rapid time-to-value, meaning that as the world of automation evolves the technology can flex to your needs and you can choose your vendors, partners, and crucial building blocks for innovation based on service quality, trust, and value-add.
So, closing thoughts. Network Automation is a crucial building block to your network strategy. Whether you buy it from IP Fabric, have your team build an equivalent in-house, Network Automation is the mechanism through which you can give speed and flexibility to your teams. With a centralised, compliant view on your production network made accessible to all those who need it, written in the language in which they can consume it, you deliver a unifying dataset for clarity, reporting, and future-proofing your technology investments.
To find out more, check out IP Fabric’s YouTube channel for demos of our PRTG integrations. Look at our other blog posts on the website to learn how our partners and customers are integrating IP Fabric with their wider operational ecosystem, and to join the #communityfabric webinar click here - https://ipfabric.io/webinars/webinar-ask-communityfabric-anything-2/#register
Every network is growing, every network is becoming more complex due to all the requirements coming from the technology evolution or customer needs, e.g. building the more reliable network connections, application-based routing, etc. And all these facts are the triggers for all the changes we are facing almost every day. Of course, there are small (not so important changes) but there are also complex network changes including core devices replacement, design changes impacting the business, and emergency changes that are caused by a failure …
I was managing small networks of units of devices, larger networks consisted of tens or hundreds of network devices but also the enterprise networks with thousands of routers, switches, firewalls and many other different network appliances and devices. I want to share some of my best practices from experience with all the changes I had prepared and executed.
There should be a reason for every network change, but let’s exclude the emergency changes as it’s mostly about “how to fix the network so that the business can go on ASAP”. I want to focus on the planned changes for which we can prepare for properly — the best way is to have the change management process in place, including the CAB (Change Approval Board) that consists of technical reviewers and these are able to check the whole change preparation with the proper description, commands and devices to be implemented or installed, and also check the testing sequence that is needed to prove that the change is successful.
Ideal way is to follow these point to ensure we know what to do before we touch the network.
In case of the complex change it is better to divide the whole activity into the smaller pieces and prepare the tests for all these sub-tasks. It should avoid the complex troubleshooting during the maintenance window and review the commands we applied from the very beginning of the change …
Let’s imagine we need to implement small change caused by the change of the ISP’s PtP network on our MPLS connection. It means the only commands we need to implement is to modify the IP address on the WAN interface and modify the next-hop within our static route. So what to check? What kind of testing method should we choose?
I recommend to create a set of verification commands so they’re not based on a specific change. Just to have a possibility to check the health of the device, do a snapshot of the different tables to have a chance to prove there is some issue right before we start the change — e.g. we don’t have a connection to the corporate FTP server, the external connectivity is not working, the log shows some issue not related to our change etc. Based on the device type we should gather the information about the uptime, last reload reason, the logs from the device, NTP status, routing table, mac-address table, interface stats, ARP table, multicast table(s), etc. Then start with the verification the subject of the change — using ping and traceroute is the most usual way to check the routing — ping the ISP IP, ping any other off-site resource, ping some Internet IP (personally, I’m using the public DNS IPs — e.g. 8.8.8.8, 4.4.2.2 …) and also trace to these IPs. Then, check the specific command related to this change — interface configuration and default route information.
And most important fact is the reason why we are configuring the network services — it’s not just for fun, just to have the router/switch/firewall with the Internet connection, but mostly because it’s serving the customer to have a set of services they need for the business (except the lab environment). Therefore the most critical testing is the application testing procedure from the customer side and it should be executed directly by the customer or onsite user to confirm it’s working as expected. For basic pre-check see below
!
show clock
show version
show run
!
show ip int brie
show int description
show int e0/0
show int e0/0.3733
show ip route
show ip route 0.0.0.0
sh ip proto sum
sh ip ospf
sh ip ospf neighbors
sh ip ospf data
sh ip nat translation
sh ntp status
show log
!
!!! ping the ISP interface (old and new)
!
ping 10.73.254.1 rep 100 size 1024
ping 10.73.200.1 rep 100 size 1024
!
!!! ping the off-site resource
!
ping 10.0.20.20
!
!!! traceroute to the off-site resource
!
traceroute 10.0.20.20 prob 1 time 1 num
!
!!! ping the Internet IP
!
ping 8.8.8.8
!
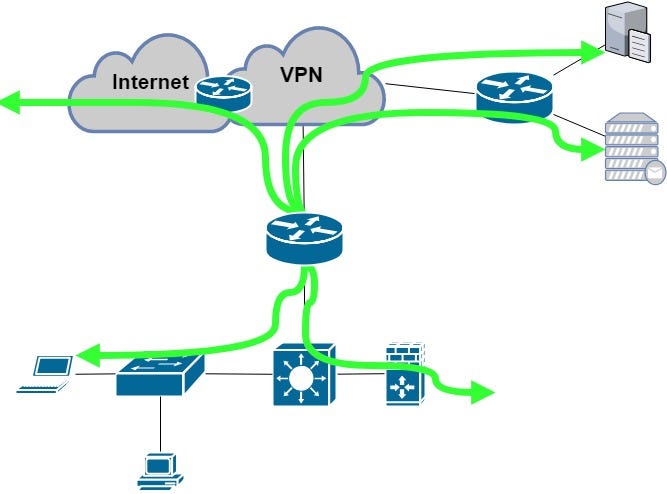
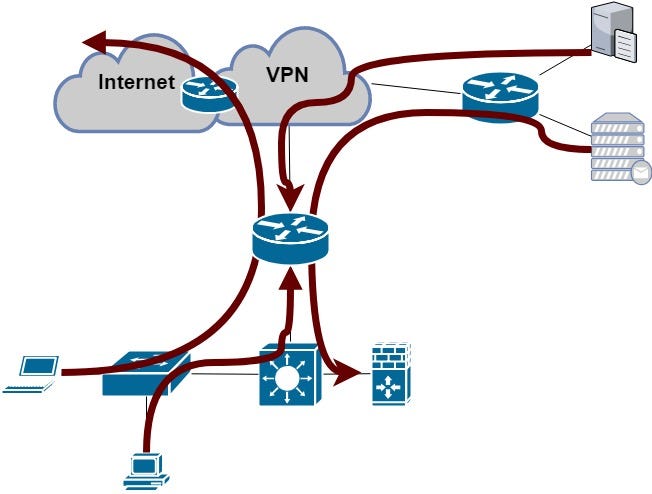
The change activity should start with running the verification commands, then change the IP and default route in this case and running the same verification command set. I’m asking customer to run their own verification after I’m done with my portion of verification to avoid some high traffic load etc. Then, using some comparison tool to review the PRE and POST states:
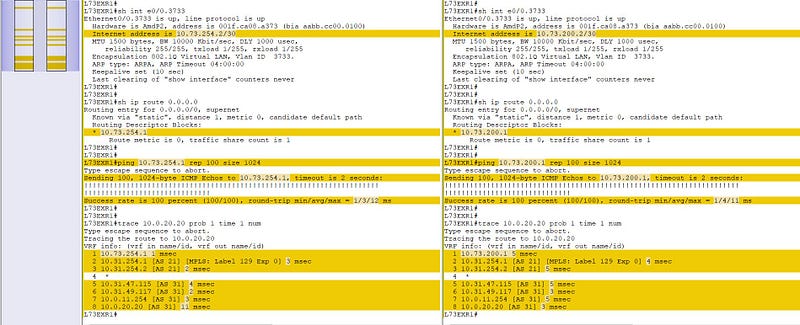
From the network perspective — the change has been implemented successfully, all the checks are as expected, the routing is working fine and we should ask the customer to do their tests — their own pings, traceroutes, application testing — e.g. working with the emails, VoIP services, core apps like SAP, web services, FTP services, etc.
Let’s review all the steps required to proceed with this simple change — change one IP address. Analyze the risk and impact of that change, prepare the verification procedure, prepare the commands needed to implement the change, run all the checks, apply all the commands, run all the checks once again and compare the results. And now, add the some complexity to the trivial network change.
What about if the replacement of the core network device is needed? It means more preparation work and also more attention to the whole process … what about if the site-local dynamic routing protocol is planned to be replaced, e.g. replace the old RIP with the newer OSPF. It’s not about one step, about one or two commands and one or two ping/traceroute verification. I will go through the previously described process more deeply and will bring some additional details to each step.
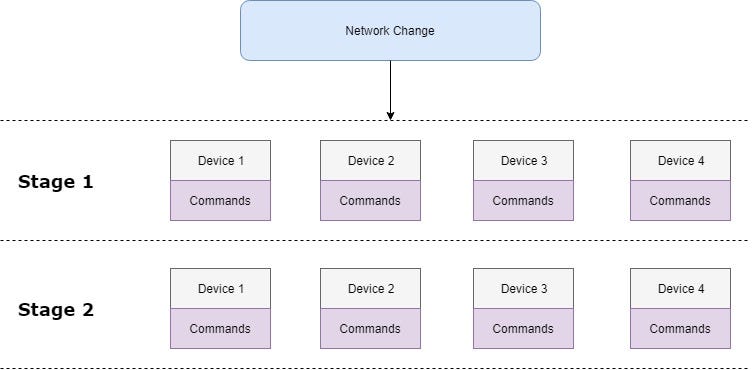
1. Prepare all the commands
We should be prepared as much as possible and should have all the commands we will apply on all various devices to save the time during the change window. Many complex changes have to be planned very carefully and it is better to split the whole change to several stages with the specific command set to be applied
We should be prepared as much as possible and should have all the commands we will apply on all various devices to save the time during the change window. Many complex changes have to be planned very carefully and it is better to split the whole change to several stages with the specific command set to be applied
These “big actions” are mostly coordinated with the customer therefore it is good to define some milestones within the implementation plan and discuss the progress among the whole team. I will cover the rollback plan later in this chapter.
It is a definitely most critical part of that change process. Not from the functional point of view but from the change management process perspective. It must be proven the network is working at 100% and all the types of communications have to be tested and all the parameters verified.
It is still very important to have all the information we might need in one place — IP addressing of all devices, access credentials incl. local user access, topology diagrams, etc. It is also important to double check the order of the commands we will apply line by line — we must be very careful not to apply any command it will cut the device off. Personally, I caused it many times in the past — I applied the wrong access-list, I didn’t allow the correct VLAN on the uplink trunk, I configured the wrong IP address on the WAN interface, and did many other things… so if it is possible, it is good to use scheduled rollback or reload of the device to revert back the last known configuration (e.g. Cisco’s command reload in) …
2. Prepare all the verifications
It is a definitely most critical part of that change process. Not from the functional point of view but from the change management process perspective. It must be proven the network is working at 100% and all the types of communications have to be tested and all the parameters verified.
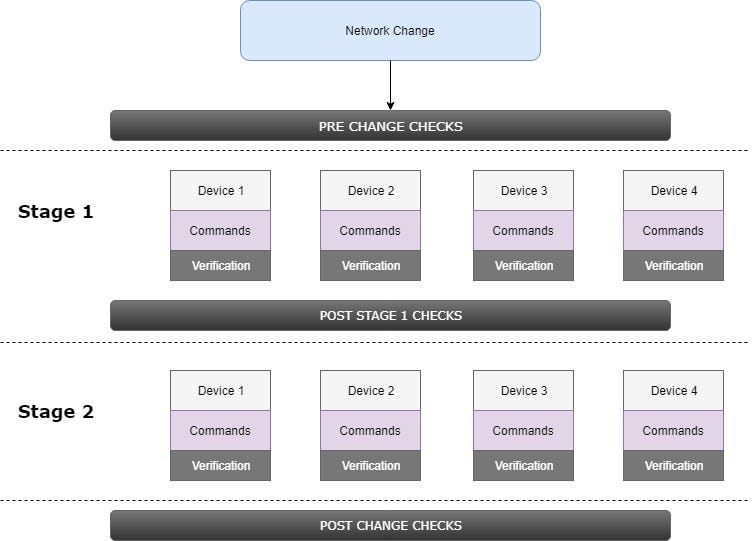
The big checks (PRE/POST and after the specific stage) should include the global verification — availability, path parameters and should be automated (will be covered later in text) and the small verification boxes represent just “local” testing after the specific commands are executed (e.g. verify the routing protocol is up and running, the ACL matches the trafrfic, the QoS marking is working etc.).
Most of the network devices we are configuring have two sides — the firewall is using inside and outside interfaces, the router is using WAN and LAN interfaces, the switch is connecting the hosts or other switches towards the core etc. Based on this fact, I recommend to use three different types of testing method:
a) checking connectivity TO THE DEVICE
It means we should check the availability of the configured device from the core or from the downstream direction. We can check the online/offline state with the ping tool and we can check the incoming direction with the traceroute command. The IP address can be the management loopback, WAN IP address or any other IP important for the communication with this device.
b) checking connectivity FROM THE DEVICE
It is very important to have a list of corporate resources that should be available throughout the whole network — FTP server, NTP server, VPN hub, … and the best way how to check this part is to ping all these resources (IPs) and trace the path to them to ensure it’s working as expected.
c) checking connectivity THROUGH THE DEVICE
It may happen that the network is not working even the previous two checks are OK. Why? Because the traffic shouldn’t pass the device correctly — there could be a problem with the advertisement of the local prefixes, the issue with the redistribution, the L2 switch VLAN ACL or mismatched filtering within the FW ACL. So pinging the core or corporate resources from the LAN (or inside) AND pinging the LAN/inside IPs from the core is a must in this case to ensure both directions are OK.
3. Prepare the rollback plan
As mentioned before, milestones or check points should be defined to have a possibility to decide whether to continue or not with the network change (go-no-go decision). They are usually after verification at every stage:
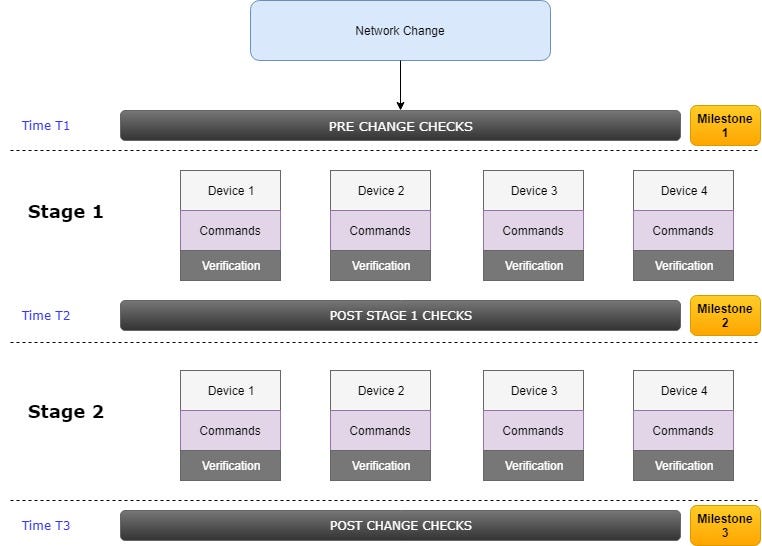
These three milestones from our example can be described as follows:
The rollback plan should contain the steps for all the devices that are being touched during the change window — re-cabling instructions and command set for each milestone and its own verification procedure. The global post-check verification is executed after the rollback is completed and comparison with the pre-check output is mandatory.
The amount of the verification is growing with the complexity of the change and therefore we should try to save the energy by using some automation tools. I omit the commercial tools for monitoring the network resources and want to describe some various possibilities I’ve encountered during my work.
I will use just three verification commands they’re implemented on all OS I have met — ping to check if the destination IP is available or not, traceroute to check the exact path between the source and the destination IP and telnet to check various L4 ports. If I use the same differentiation of the verification directons as described above, I will talk about only two directions from that list only — verification executed on the device that is being changed and from any other location towards this device.
1. Verification from the impacted device
It’s easier to execute the verification procedure from the impacted device as we are still at one prompt and only challenge is to process the command by command.
Cisco’s easiest way is to use the TCL script to run the verification commands by using native commands mentioned above. It can be stored as a function and called any time during the change window or it can be processed just once as we need it.
Let’s demonstrate how it works and the difference between the various possibilities. Let’s have three IP addresses we will use for our verification from one device — 10.0.20.1, 10.0.20.20 and 10.0.20.21. I have prepared the set of verification commands:
!
ping 10.0.20.1 rep 2
ping 10.0.20.20 rep 2
ping 10.0.20.21 rep 2
!
traceroute 10.0.20.1 prob 1 time 1 num
traceroute 10.0.20.20 prob 1 time 1 num
traceroute 10.0.20.21 prob 1 time 1 num
!
Of course I can use standard copy&paste function but the problem is processing the input via the TTY session. Next exhibit shows the result when using copy&paste — it can be seen one ping command is missing (even it was within the pasted text) and two traceroute commands are also missing …
L73EXR1#ping 10.0.20.1 rep 2
Type escape sequence to abort.
Sending 2, 100-byte ICMP Echos to 10.0.20.1, timeout is 2 seconds:
!!
Success rate is 100 percent (2/2), round-trip min/avg/max = 4/4/5 ms
L73EXR1#ping 10.0.20.20 rep 2
Type escape sequence to abort.
Sending 2, 100-byte ICMP Echos to 10.0.20.20, timeout is 2 seconds:
!!
Success rate is 100 percent (2/2), round-trip min/avg/max = 5/11/18 ms
L73EXR1#traceroute 10.0.20.21 prob 1 time 1 num
Type escape sequence to abort.
Tracing the route to 10.0.20.21
VRF info: (vrf in name/id, vrf out name/id)
  1 10.73.254.1 1 msec
  2 10.31.254.1 [AS 21] [MPLS: Label 129 Exp 0] 1 msec
  3 10.31.254.2 [AS 21] 3 msec
  4  *
  5 10.31.47.115 [AS 31] 2 msec
  6 10.31.49.117 [AS 31] 1 msec
  7 10.0.11.254 [AS 31] 4 msec
  8 10.0.20.21 [AS 31] 5 msec
We need ensure that every command is pasted/processed once the prompt is ready. With Cisco TCL script we can modify the verification set as follows:
foreach address {
 10.0.20.1
 10.0.20.20
 10.0.20.21} { ping $address rep 3
}
It means we can enter the TCL mode by typing tclsh command and paste the text above. It will process command by command as needed. Then, we can expand the TCL script and add the traceroute or any other Cisco command with the IP address as an argument. To make it simpler, it’s possible to create the procedure called any name, put all the verification into the brackets and then, it can be called any time from the tclsh prompt. The example of our verification set:
proc CheckFROMonce {args} {
 foreach address {
  10.0.20.1
  10.0.20.20
  10.0.20.21} { ping $address rep 3
 }
 foreach address {
  10.0.20.1
  10.0.20.20
  10.0.20.21} { trace $address prob 1 time 1 num
 }
}
Then, let’s call the procedure once:
L73EXR1(tcl)#CheckFROMonce
Type escape sequence to abort.
Sending 3, 100-byte ICMP Echos to 10.0.20.1, timeout is 2 seconds:
!!!
Success rate is 100 percent (3/3), round-trip min/avg/max = 4/6/8 ms
Type escape sequence to abort.
Sending 3, 100-byte ICMP Echos to 10.0.20.20, timeout is 2 seconds:
!!!
Success rate is 100 percent (3/3), round-trip min/avg/max = 2/8/14 ms
Type escape sequence to abort.
Sending 3, 100-byte ICMP Echos to 10.0.20.21, timeout is 2 seconds:
!!!
Success rate is 100 percent (3/3), round-trip min/avg/max = 2/5/10 ms
Type escape sequence to abort.
Tracing the route to 10.0.20.1
VRF info: (vrf in name/id, vrf out name/id)
  1 10.73.254.1 1 msec
  2 10.31.254.1 [AS 21] [MPLS: Label 129 Exp 0] 3 msec
  3 10.31.254.2 [AS 21] 3 msec
  4  *
  5 10.31.47.115 [AS 31] 7 msec
  6 10.31.49.117 [AS 31] 5 msec
  7 10.0.11.254 [AS 31] 5 msec
  8 10.0.20.1 [AS 31] 4 msec
Type escape sequence to abort.
Tracing the route to 10.0.20.20
VRF info: (vrf in name/id, vrf out name/id)
  1 10.73.254.1 1 msec
  2 10.31.254.1 [AS 21] [MPLS: Label 129 Exp 0] 1 msec
  3 10.31.254.2 [AS 21] 7 msec
  4  *
  5 10.31.47.115 [AS 31] 7 msec
  6 10.31.49.117 [AS 31] 6 msec
  7 10.0.11.254 [AS 31] 9 msec
  8 10.0.20.20 [AS 31] 3 msec
Type escape sequence to abort.
Tracing the route to 10.0.20.21
VRF info: (vrf in name/id, vrf out name/id)
  1 10.73.254.1 1 msec
  2 10.31.254.1 [AS 21] [MPLS: Label 129 Exp 0] 2 msec
  3 10.31.254.2 [AS 21] 5 msec
  4  *
  5 10.31.47.115 [AS 31] 2 msec
  6 10.31.49.117 [AS 31] 2 msec
  7 10.0.11.254 [AS 31] 3 msec
  8 10.0.20.21 [AS 31] 3 msec
L73EXR1(tcl)#
In case we cannot use the TCL or we don’t want to use it for any kind of reason, we can use own script based on the tool or scripting language we are using — it can be PERL or PYTHON script with direct SSH/Telnet module or it can be served by VBScript within the SecureCRT client. The easiest VBScript without loading external files (e.g. device list or command set) is as follows:
#$language = "VBScript"
#$interface = "1.0"
crt.Screen.Synchronous = True
sub Main
  crt.Session.Log False
  crt.Session.LogFileName = "logs\CheckFROMonce.log"
  crt.Session.Log True
crt.Screen.Synchronous = True
  crt.Screen.Send "ping 10.0.20.1 rep 2" & vbcr
  crt.Screen.WaitForString "# "
  crt.Screen.Send "ping 10.0.20.20 rep 2" & vbcr
  crt.Screen.WaitForString "# "
  crt.Screen.Send "ping 10.0.20.21 rep 2" & vbcr
  crt.Screen.WaitForString "# "
  crt.Screen.Send "trace 10.0.20.1 prob 1 time 1 num" & vbcr
  crt.Screen.WaitForString "# "
  crt.Screen.Send "trace 10.0.20.20 prob 1 time 1 num" & vbcr
  crt.Screen.WaitForString "# "
  crt.Screen.Send "trace 10.0.20.21 prob 1 time 1 num" & vbcr
  crt.Screen.WaitForString "# "
  If crt.Session.Logging Then
    crt.Session.Log False
  End If
  crt.Sleep 500
  MsgBox "DONE: Generic Scripting"
end Sub
There is a lot of options how to proceed with this type of task but the aim is the same for all methods — save the time by pasting the commands, avoid the human error by using one verification procedure in all the verification steps and to have the same-formatted log to be able to compare the results any time during or after the change.
2. Verification to or through the impacted device
A little bit different scenario is the second part of verification and it’s testing the function of the impacted device for the traffic that is destined to the device or is passing through the device.
To fulfill this task we should login to the various devices and execute some specific set of command. The command set can be equal to check the same connectivity check from various network sources or additionally, it can be different and test different services or destinations.
I recommend to include these verification:
The automation of these verification steps can be done by using some scripting language and preparing the specific device-list as an input file and executing the verification command set from these devices step by step.
The simple BASH script that should be located and executed somewhere in the network far from the change location could be used to monitor the local resources incl. the management IP, local prefixes etc.
#!/bin/bash
HOSTS="10.0.20.73 10.73.255.1"
C=2
while true
do
  for conHost in $HOSTS
  do
    result=$(ping -c $C $conHost | grep 'received' | awk -F',' '{ print $2 }' | awk '{ print $1 }')
      if [ $result -eq 0 ]; then
        echo "Host $conHost is down! at $(date)"
      fi
  done
done
We can specify as many hosts as needed and check the connection state — if the ping result is OK (the IP is reachable), it’s showing no output and if there is an issue with the reachability, it will display the information the host is down and the date/time detail:
trehor@labremote:~$ ./monitor.sh
Host 10.73.255.1 is down at Thu Jul 26 06:39:41 CEST 2018
Host 10.73.255.1 is down at Thu Jul 26 06:39:53 CEST 2018
Host 10.73.255.1 is down at Thu Jul 26 06:40:05 CEST 2018
^C
trehor@labremote:~$
Because of the infinite loop within the BASH script, you must terminate the monitoring script by pressing CTRL+C.
In my opinion, the verification is very important part of the network changes regardless it’s a simple network change (changing the next-hop of the static route) or very complex change (core router replacement, local dynamic routing protocol replacement, adding the second router with the secondary connection etc.) or impacting one device or including 10+ devices. It must be prepared and reviewed in advance to avoid missing tests and mostly, we should collect as much as possible from the testing logs and be able to compare the PRE/POST outputs to prove the network behavior is the same after we finish the network change as it was before we started. And sometimes — these logs can help us with the troubleshooting several days after the change …
If you’re interested in learning more about how IP Fabric’s platform can help you with analytics or intended network behavior reporting, contact us through our website, request a demo, follow this blog or sign up for our webinars.
The feature I’ve been waiting for since the beginning of my Network Engineering career is finally here: Dynamic Change Monitoring. It’s finally possible to know the answer to the age-old question “What has changed in the network since yesterday?” and actually get a definitive response instead of the usual “Nothing has changed”. And not just the configuration change management, but I’m happy that we’re the first in the market to offer the overall network state change management — whenever a network path changes, if somebody plugs in a new SFP, if a network port goes up or down, or if IP address is starts being served by a new gateway due to a convergence event, the IP Fabric platform will report the change. It’s great for performing the changes as well because I can now perform a pre-change scan, in-flight scan, and post-change scan, and verify that pre-change and post-change do not differ or that they contain only the desired differences, validating change goal.

Dynamic change monitoring is not the only big improvement in version 2.0. Having had a number of large scale production deployments we’ve had a chance to listen to insightful feedback and significantly improve usability, add highly desired features, all the while simplifying product architecture to be able to deliver features more quickly. So here are some of the highlights from the big 2.0 release:
Now a single action discovers, analyzes, and calculates changes in the network. Based on a schedule or on demand, network insight is as current as you need it to be. The single combined action greatly simplifies usability, as it eliminates guesswork if a new discovery is necessary or not. From experience, we’ve found out that networks are so dynamic, that they need rediscovering every single time the network state is collected.
We strive to support all enterprise network infrastructure managed devices, model years from 1997 or 2017 and made by Cisco or anyone else. For version 2.0 we’ve added a driver system, where each vendor family only has to have a family driver for the IP Fabric platform to be able to talk to the whole family. We’ve also added support for HPE Comware v5 and v7 based switches such as 55xx and 59xx, Riverbed WAN accelerators running RiOS, and Cisco SG300-series SMB switches. Paradoxically, the Cisco SG300 had the most complex driver, because a number of key pieces of information are missing from the basic outputs, and multiple detailed outputs have to be painstakingly combined for a meaningful result.
While we started with Routers and Switches, our ultimate goal is to cover the end-to-end transmission path from the source to destination, which includes additional types of forwarding equipment. Wireless is omnipresent, so we’ve added WLC and AP support, so now wireless users connected to lightweight APs can be traced just as easily as wired users. We’ve also added firewalls and WAN accelerators. And because many users are connected through IP Phones, and IP phones are an important part of network infrastructure, we’ve added those as well.
We strive to support all major Enterprise networking technologies and protocols, and although we have some road ahead of us, we’ve expanded VDC, vPC, and FEX support with StackWise, PoE, and Optical Attenuation, added support for QoS classes and applied service policies, improved ACL workflows, and added many smaller improvements, like support for DMVPN tunnels.
Networks follow graph theory, and graphs are naturally visual, so it is not a surprise that diagramming and visualization capabilities are a big draw, for both the customers and internal teams alike. In version 2.0 we’ve moved from simple diagrams to a fully-fledged diagramming UI, which enables to display protocols or features on demand and show network topology from highest overview to the deepest. One of the great additions is persistent diagram saving feature, which stores the diagram layout even across multiple discoveries runs.
This one is my favorite. Network protocols create topological neighborship to form a forwarding domain and networks paths. Changes in protocol neighborships signify changes in the network topology. Changes in network topology connectivity may inadvertently affect network behavior and can affect a number of users. Tracking connection changes enables to quickly pinpoint non-administrative and administrative changes affecting topology and network paths, user connectivity, and performance, redundancy, resiliency and service availability. Along with configuration management changes, four types of changes are currently tracked: devices, network neighborships (CEF, ARP, RIB, STP, CDP/LLDP), modules and part numbers, and IP addresses. Changes can be displayed for any time interval for which the platform has collected network state information. Changes between last month and last week can be displayed just as easily for last week vs today.
Many other improvements have made it into the big 2.0 release, and although not all are polished, they are functional and can provide value out of the box. User interface now has integrated search, Live Support VPN option, and a status page. Users can now change their password, and we’ve added the enterprise-grade user management system with roles. We’ve added more granularity for CLI interaction, such as a hard limit on a maximum number of parallel sessions. There are also Jumphost, and REST API, and actually much more than can be covered in one post. We’ll be coming back introducing each major feature in more detail, but if you can’t wait, you can always contact us or requests a trial.
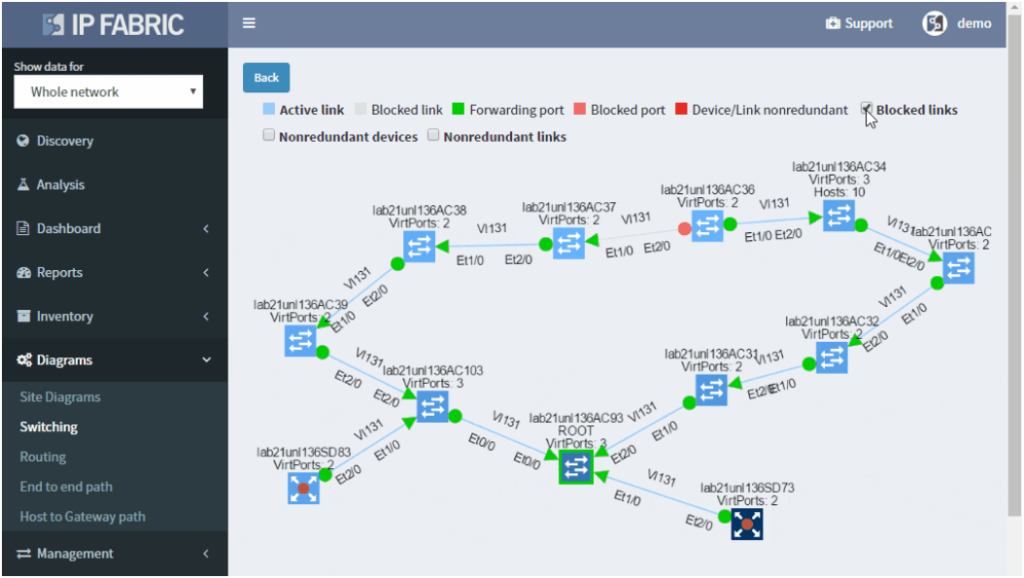
There should be minimal changes in the layer 2 switching operations — the switching topology should be constant and the number of MAC address moves minimally.
How do you know that the switching domain is not re-converging every minute or two due to STP issues?
Many problems in the current Ethernet layer 2 switched networks can come as a result of the behavior of the Spanning Tree Protocol and its derivatives. Its fail-open nature can render large parts of the network belonging to the same switching domain unusable. There are hints in STP operation before the major disruption happens which could be used as early warnings.
A number of topology changes, number of MAC address moves, STP diameter size, per VLAN root switch assignment, virtual port numbers and other operational values — if those will find a way to network engineer, they can mitigate the issue before the switching domain goes down completely. However, it is not exactly easy to routinely gather and process detailed Spanning Tree Protocol outputs to see if something out of ordinary is starting to happen.
The IP Fabric platform collects STP data and processes those into various statistics which provide immediate guidance to network engineers, such as that the network is re-converging too frequently, or that the root bridge uses default priority value, or that the STP topology includes more switches than recommended by best practices.
Detailed Spanning Tree analytics in the IP Fabric platform help engineers to investigate what could be wrong with the L2 switching domain, what could be fixed or changed, and help with the change procedure, such as switching to a newer derivative of the Spanning Tree protocol.
If you’re interested to see how the IP Fabric platform can help you to keep L2 switching domain stable, contact us for an online demo or a trial in your network. Also, we’re hiring!


