BGP is famously known for being the routing protocol of the internet, but not only. A lot of companies are using BGP in their internal network. One of the main reasons for that: it allows great control and flexibility with routing exchange.
As with any routing protocol and critical connectivity, we want to ensure we are resilient to failure and that the resiliency is operational. With BGP, to do so, we need to have a closer look at the received prefixes.
Let's take a classic example, where you would have two devices connected to an external party. This could be your ISP, MPLS provider…
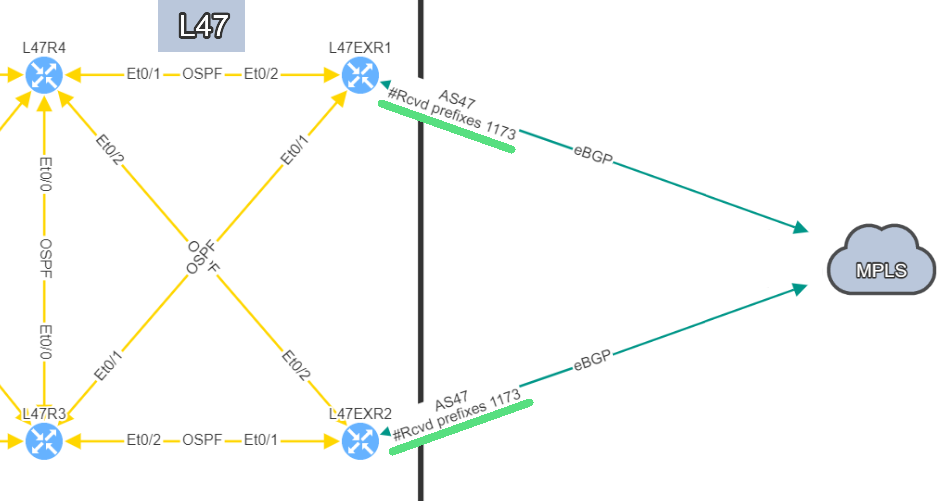
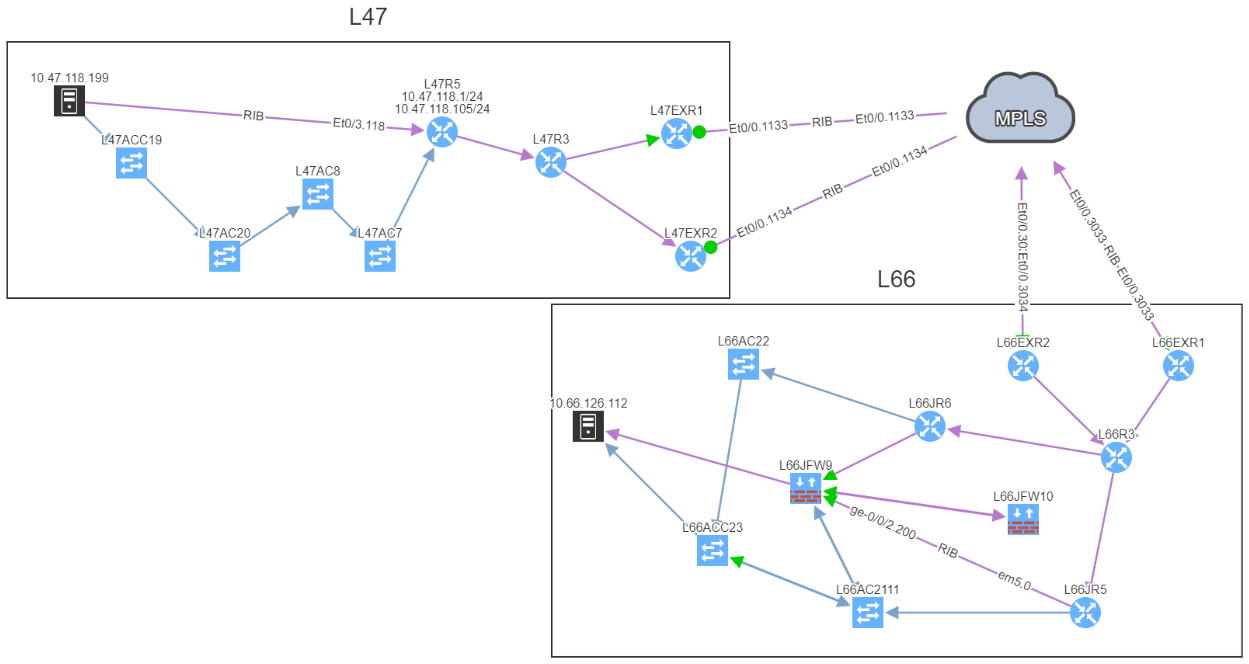
In this example, site L47, on the left, is connected to site L21 which is your MPLS cloud.
You have your two eBGP sessions established with the MPLS cloud, that's great! Now you want to ensure that you are resilient by checking the receive routes from the provider on both links. This is how you will be able to reach any of your sites connected to the MPLS cloud.
In this situation, if one link fails, you have full resiliency. You will not lose connectivity to your MPLS network and all the services hosted outside site L47.
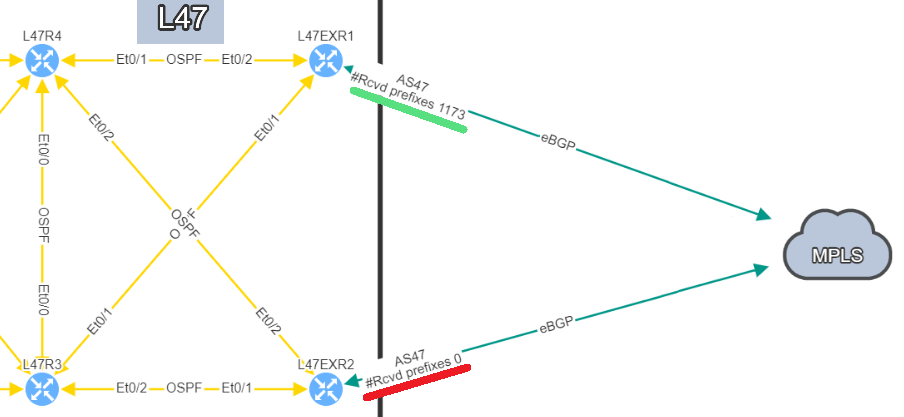
In this situation, if you lose L47EXR1 or the link between this router and site L21, your secondary link will not be able to forward any traffic. L47EXR2 is not receiving any routes.
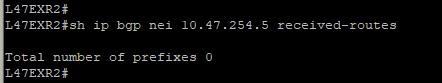
This is what you would see on your device:
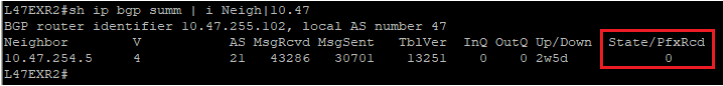
The fact that you can see State/PfxRcd showing "0" tells you the BGP session is established, otherwise, you would see the current state (Idle, Active...). Any other number would be good, unfortunately in this scenario, you are not receiving any route.
You are now in a situation where you do not have any resiliency, and your monitoring system is not alerting us on the issue.
That’s a very good question! In a situation like this one, the BGP session is not affected, which means there is no error generated by the router. The device will not send Syslog messages or SNMP traps to inform your monitoring system that you are not receiving any routes.
That's where IP Fabric can play a crucial role to identify the issue quickly before it causes any damages. There are several ways to see the problem:
The IP Fabric dashboard provides an overview of the network analysis results, including issues and links to the detailed reports.
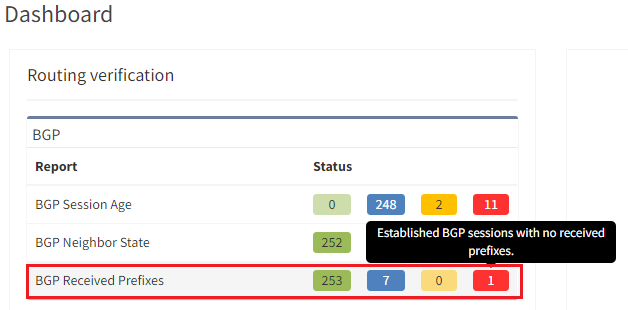
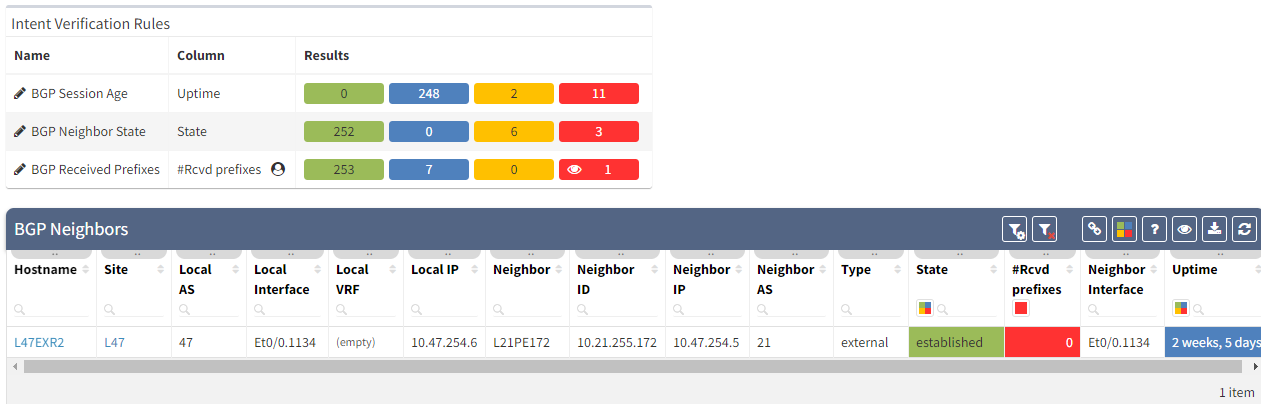
After seeing this table, you will want to check further details regarding the issue. Just click on the interesting number, and you will be redirected to the appropriate technology page and the intent verifications.
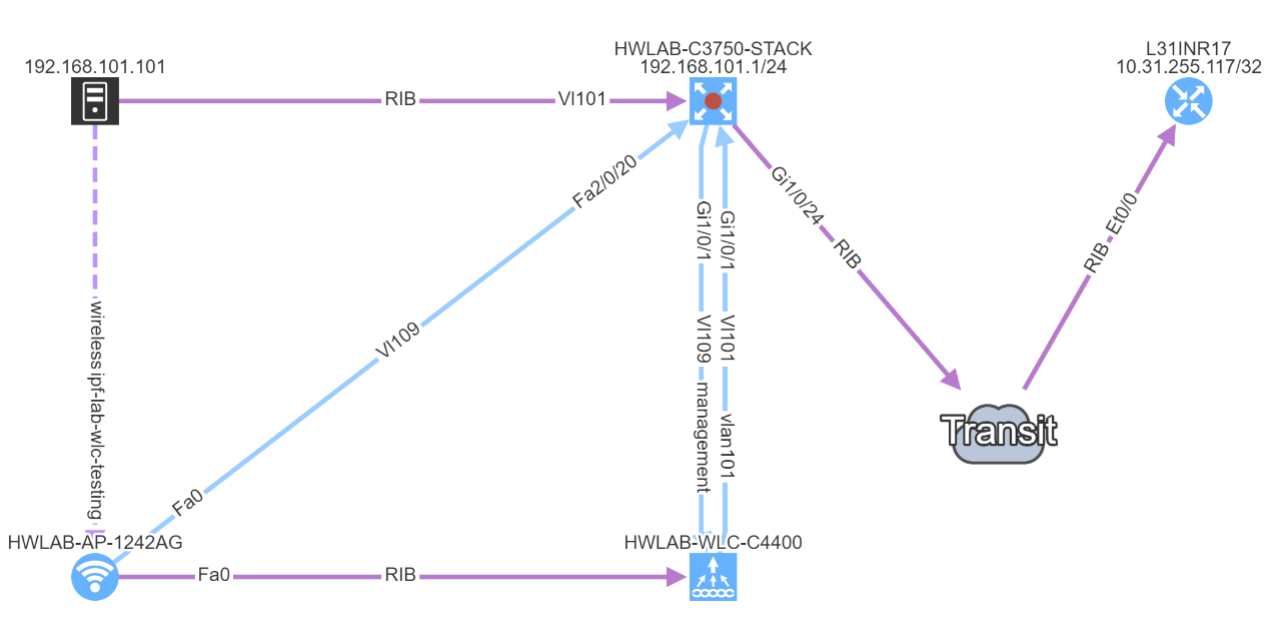
As we have seen at the beginning, you will be able to check directly on the diagram the number of received prefixes for a specific neighbor.
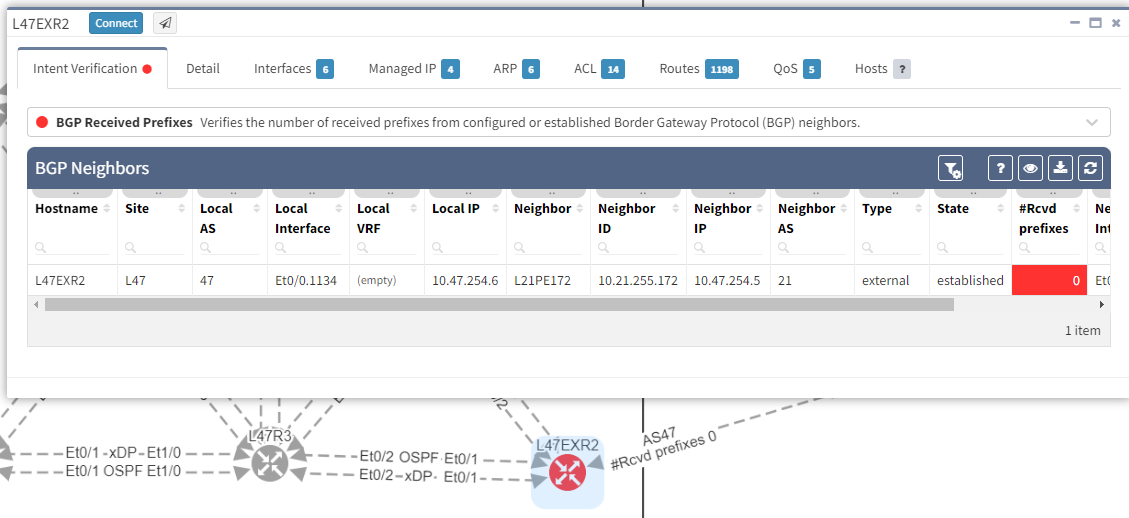
It's also possible to display on the diagram the verification information from all the supported technologies. In this example, we will add the BGP information on the diagram for site 47:
The moment we select the verification to add to the diagram, we can see L47EXR2 becomes red. If we click on the device, we will see the explanation on why it's showing red:
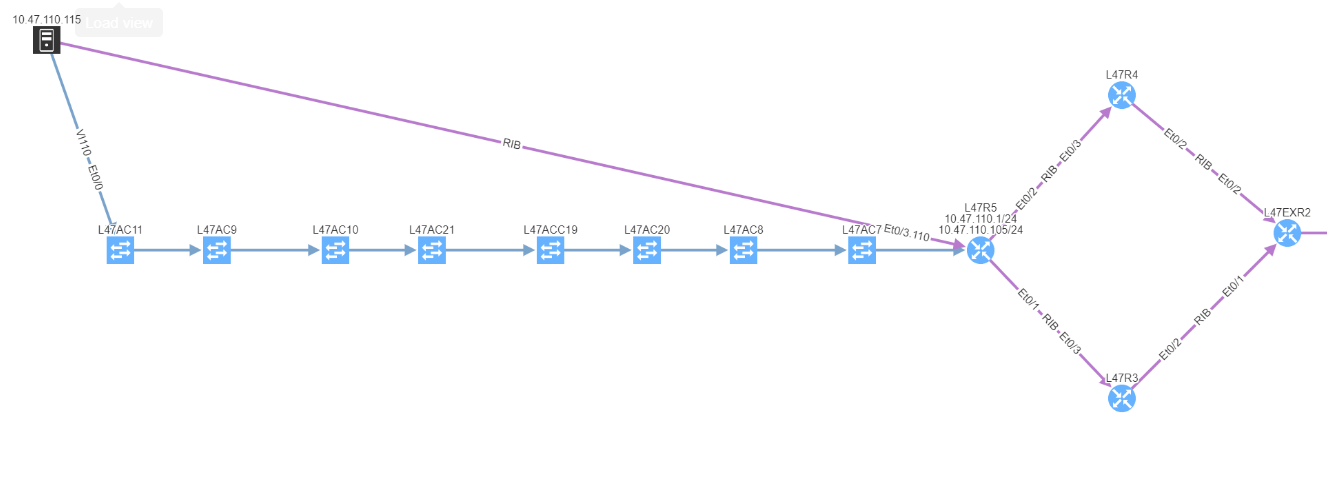
In addition, we can spot this issue by looking at the end-to-end path. Let's take an example where we are looking at the path from a source in site L47 to a destination in site L66, which is connected to the MPLS cloud.
In a normal situation, we would expect to see the traffic being able to use both links to reach the MPLS cloud:
If we now compare with the snapshot where we have the issue, we can clearly see that we have lost our resiliency:
You can't ensure BGP resiliency if you do not look at the received prefixes. The main issue with this situation is the fact that your monitoring system will not be able to inform you of the loss of received prefixes. The last thing you want is to face a massive outage because of one link failure and your secondary link was not operational.
I have been in that exact situation previously, and let's just say I did not enjoy writing the postmortem explaining why we did not know our redundant path wasn't working. It's not a situation you want to be in...
If you would like to find out more about IP Fabric and how it can help improve your existing infrastructure by detecting issues you are not aware of, please contact us through www.ipfabric.io! You can also follow our company’s LinkedIn or Blog, where more content will be emerging.
There are many elements that contribute to the availability of services delivered across any network. Redundancy in the topology, coupled with resilience in the configuration are key. Routing protocols are used to manage that redundancy and failover to backup traffic paths should a failure occur in the active path. For this to work successfully, it is vital that the environment remains as stable as possible and is not subject to constant change. IP Fabric can help you by analyzing routing protocol stability and pinpointing issues.
As we know, the stability of BGP peering can cause performance problems with large networks. Events such as link failures can trigger sequences of updates along paths in the network - this can cause:
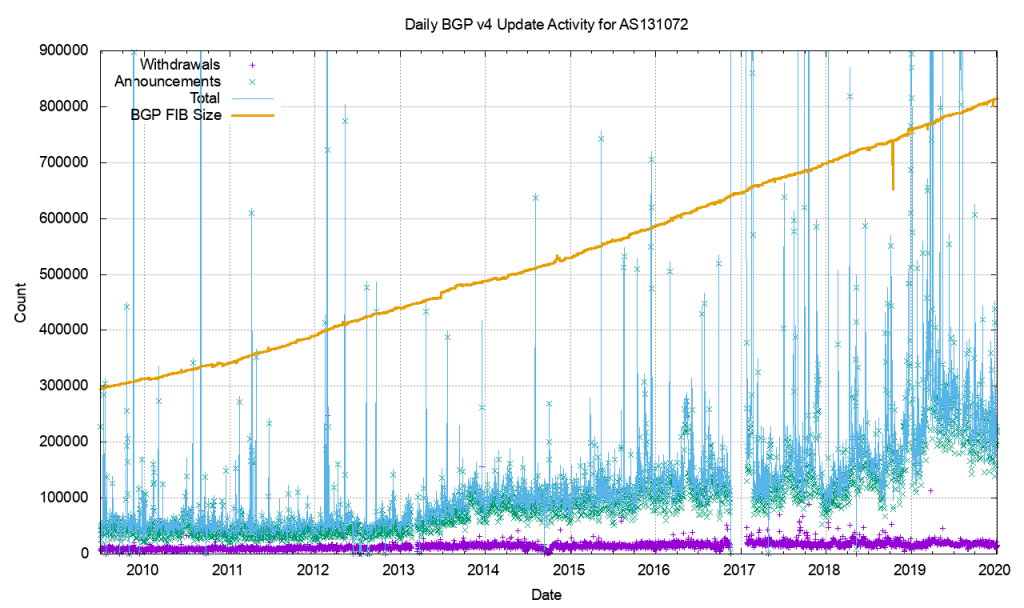
As an example of this, consider that the Internet routing table has reached such a size that it never actually fully converges. This is a symptom of the churn - the number of updates and withdrawals - caused by link events within and between ASs which of course occur around the clock!
BGP is usually used in an enterprise to connect together networks that are managed by different organizations or different parts of the same organization. It follows then that once established, the connections should stay up and remain so. Fluctuations in that connectivity have the potential to have far-reaching consequences and so it pays to keep track of the stability of that peering.
But how do we measure that stability? In particular, we might address this by focussing on two particular elements. For each BGP peering relationship in the network we might look to answer two questions:
In order to check that manually, a network analyst might have to
Or you could spend the time to write the scripts and develop the tooling to automate the process so you can repeat the checks at regular intervals.
Alternatively, you could give the job to IP Fabric.
IP Fabric analyses configuration and operational state of the devices in the network records them in a vendor-agnostic form in its database, then runs 120+ standard validation checks and presents the results on the product dashboard. These checks include identifying BGP peering across platforms and vendors and checking the relationships for the length of the establishment of peering:
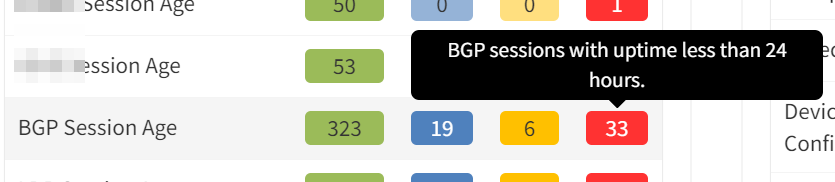
and for current state:
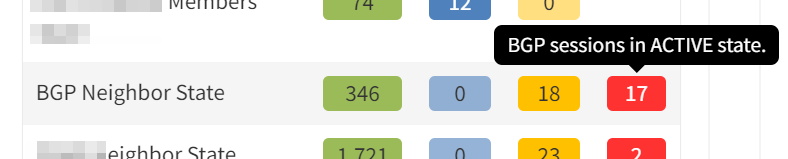
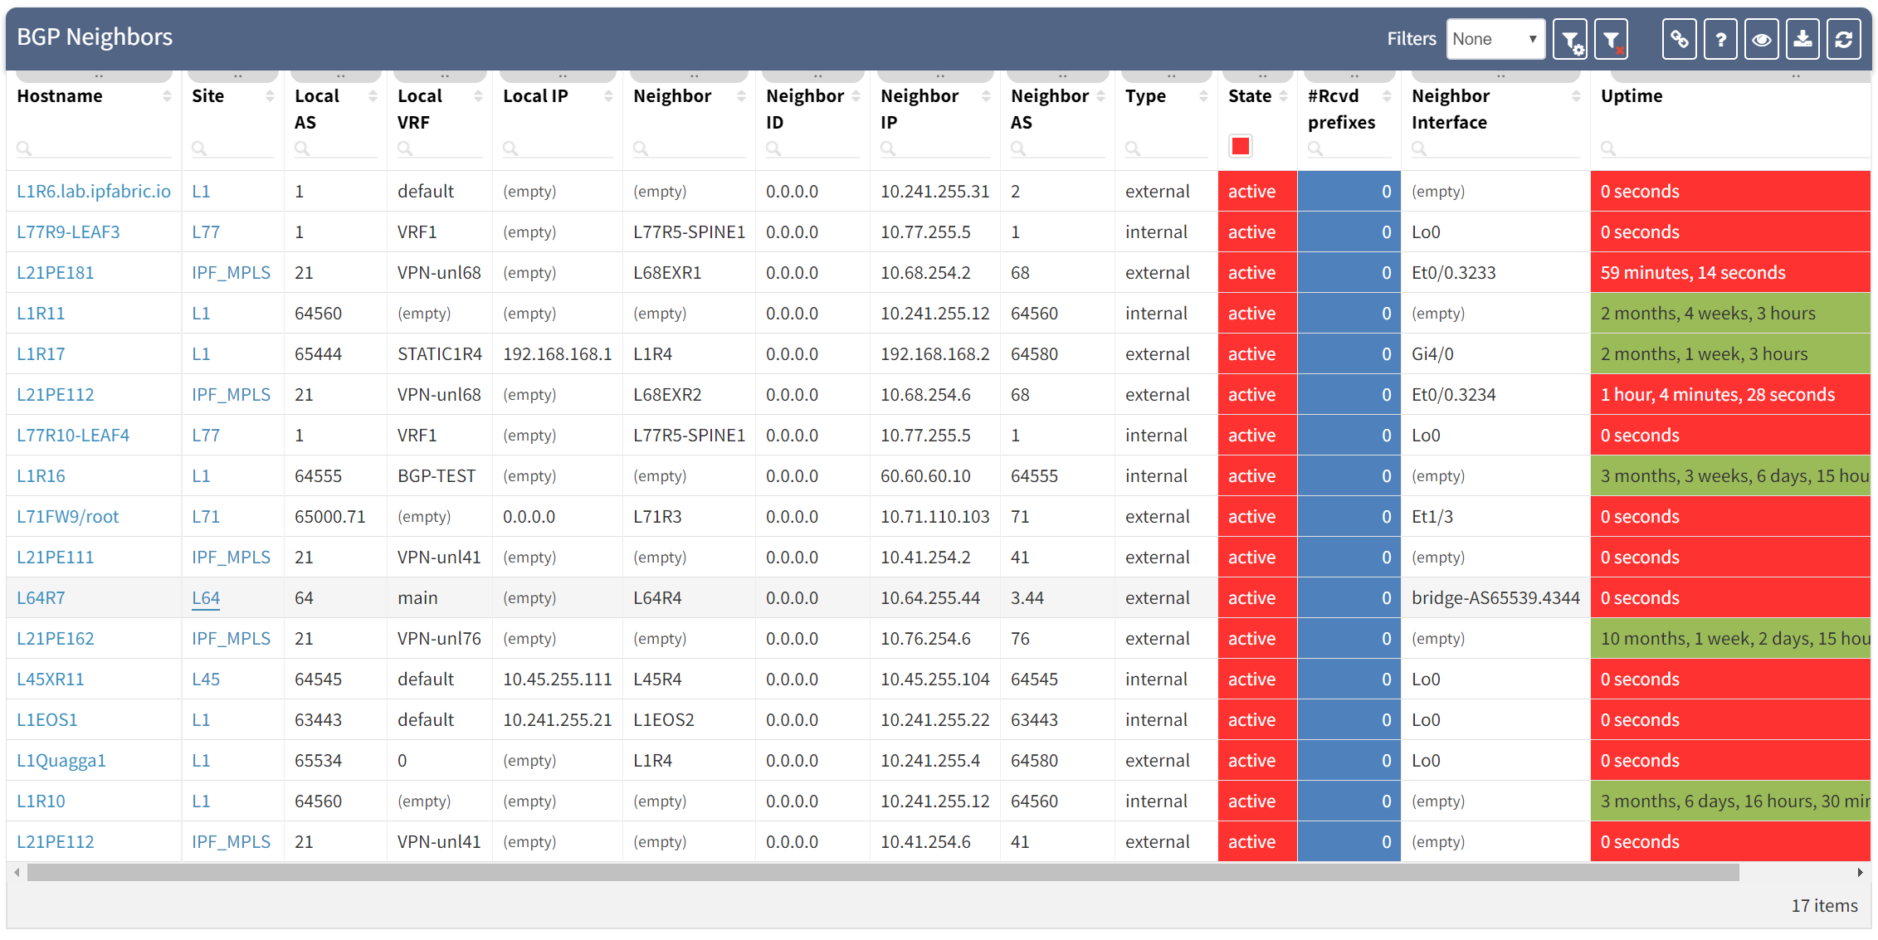
Clicking through the dashboard on peerings in an active state shows a table of the details for those peerings, and you have all the details to hand.
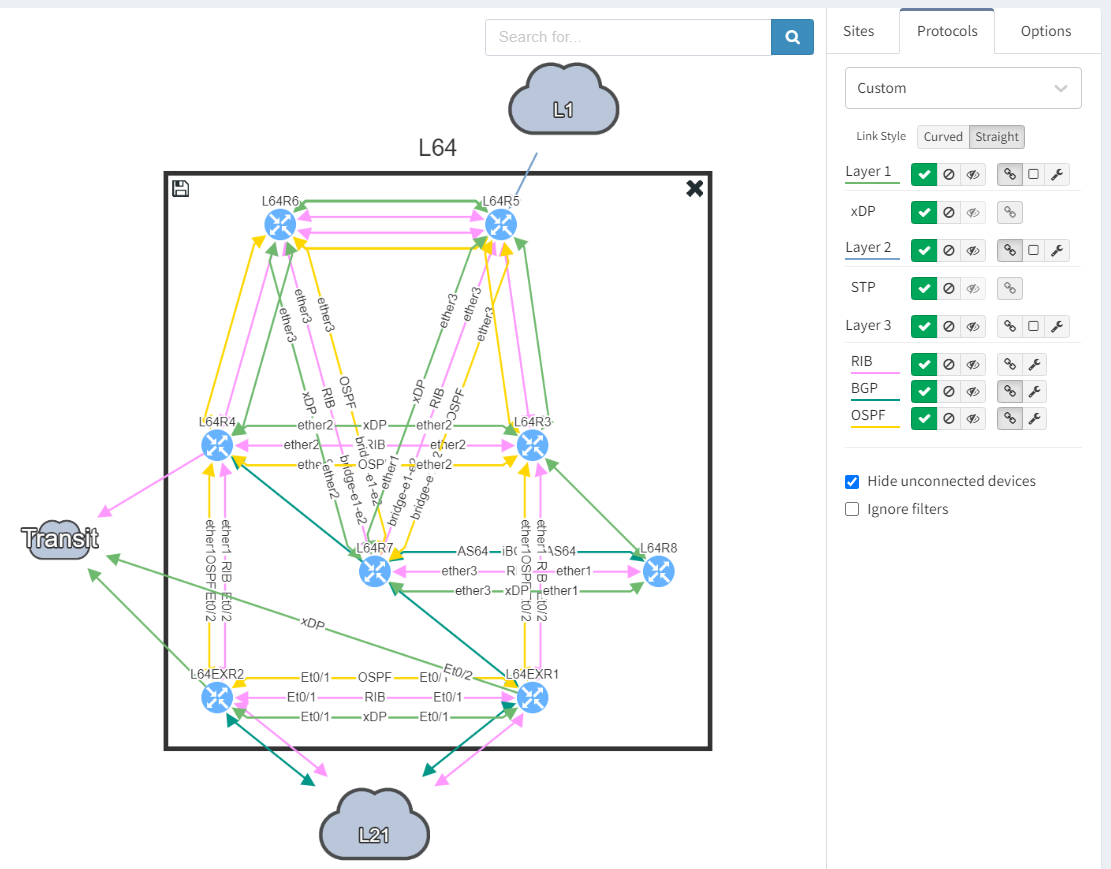
Taking a step further, click through the site location in the table to see the topology with the peering in question from the "live" documentation:
Next, we focus on BGP topology by disabling all other protocols and enable the BGP Compliance intent verification check.
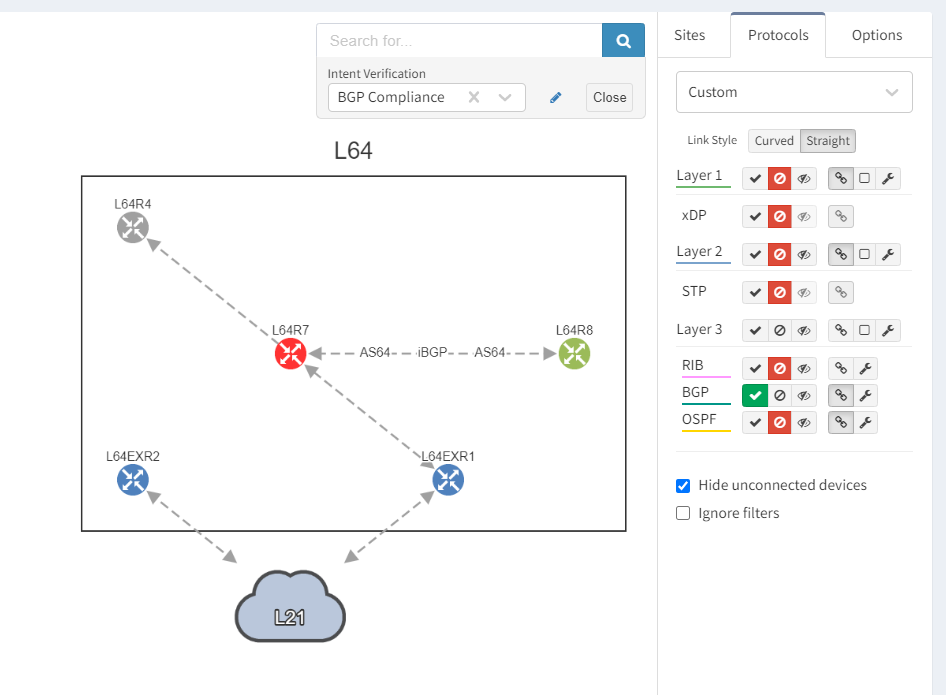
We can see that the platform has highlighted the problem with L64R7. IP Fabric presents information on the problematic peering with L64R4 when we select the router in question. The implication here is that L64R4 is not configured to peer with L64R7.
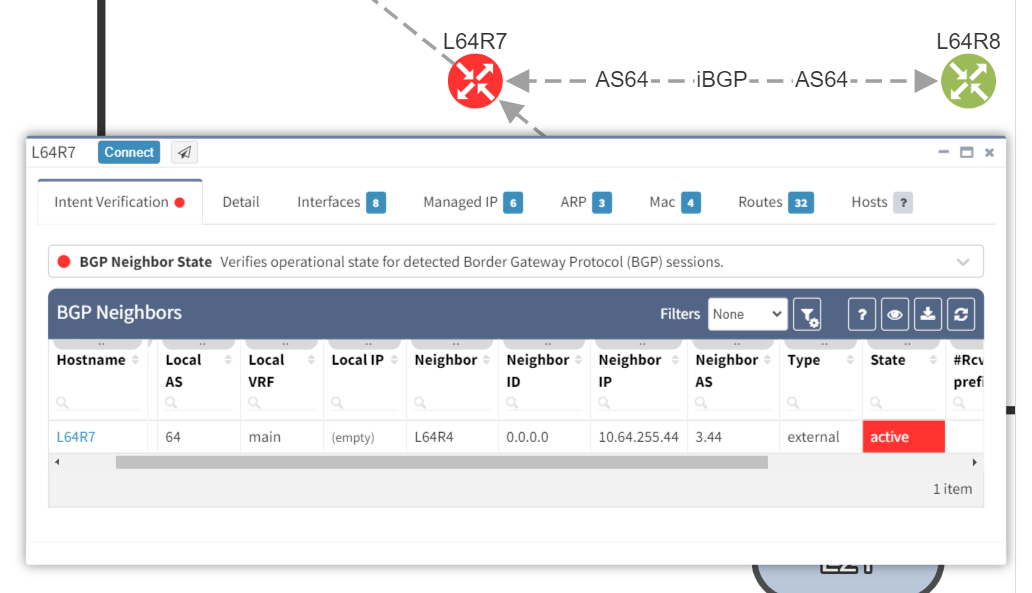
It is apparent that the peering appears to be configured in one direction and not the other from the arrows in the diagram. From the table, it looks like an IP address doesn't appear to be assigned to the peering. On inspecting the routers we can see that L64R7 looks fine:
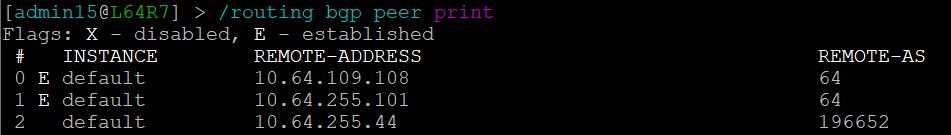
but the peering is disabled on L64R4:

And so IP Fabric has allowed us to drill down and reach the conclusion far quicker than going through a process of having to extract the detail, analyze it and troubleshoot manually.
If you have found this article helpful, please follow our company’s LinkedIn or Blog, where more content will be emerging. If you would like to test our solution to see for yourself how IP Fabric can help you manage your network more effectively, please contact us through www.ipfabric.io.
With a growing number of customers and requests, the initial plans for minor bugfix release have been expanded into a major release which improves upon nearly all aspects of the product. Here we'll cover the biggest changes in the major release of IP Fabric 3.1.0. Customers can upgrade the installation via the administrative interface by following the procedure in the documentation.
Before we'll go into detail of the changes, let me point out a few of them in the beginning. For visualization, the new View Builder provides the option to create a fully custom diagram views, new manual site separation enables to refine automatic site detection, and improved object manipulation helps to deal with complex diagrams. For vendor and technology support, we've added basic support for Cisco Firepower Thread Defense, added vDOM and Zone Firewall support for Fortinet Fortigate family, and added OSPFv3 support for multiple families. Additionally, we've added customization options for Network Analysis Report, revamped snapshot management, re-engineered backup and restore system and much more, so let's dive straight in!
Based on numerous requests and thanks to our network automation architects, the Cisco Firepower Threat Defense devices are now being supported to complement our ever-expanding portfolio of supported network technologies and vendors. For now, only the basic support has been added as we're exploring use cases with this innovative platform.
The support for the Fortinet FortiGate family was expanded from basic discovery to support Virtual-Domains (VDOM), Zone Firewalls, and Port-Channels. This support has also made into network simulations expanding End-to-End path mapping capabilities with the security layer for this platform.
As more customers are working with IPv6, we've also added support for OSPFv3 for both IPv4 and IPv6 address families. Both technology tables and diagrams now have distinct OPSFv3 options, which include both IPv4 and IPv6 families.
With new released version 3.1.0, we introduce the View Builder. The ultimate feature that allows users to create any customized view of their own topologies and break the boundaries in diagrams. With its intuitive interface, the network devices can form logical groups regardless of any protocol relationship among them. If there is any protocol session between devices, the builder enables to crawl topology further expanding the view. If there is not any relation, the device still can be added manually by clicking the add device + button. The view builder is available through the tools menu in any of the diagrams (three dots).
From now on, it is not possible to save the backup data on the same file system where the platform resides. New partition has to be created to save the backup locally. If there's no secondary partition detected, the platform will not let the user save the backup. More information related to new options is available in our online documentation.
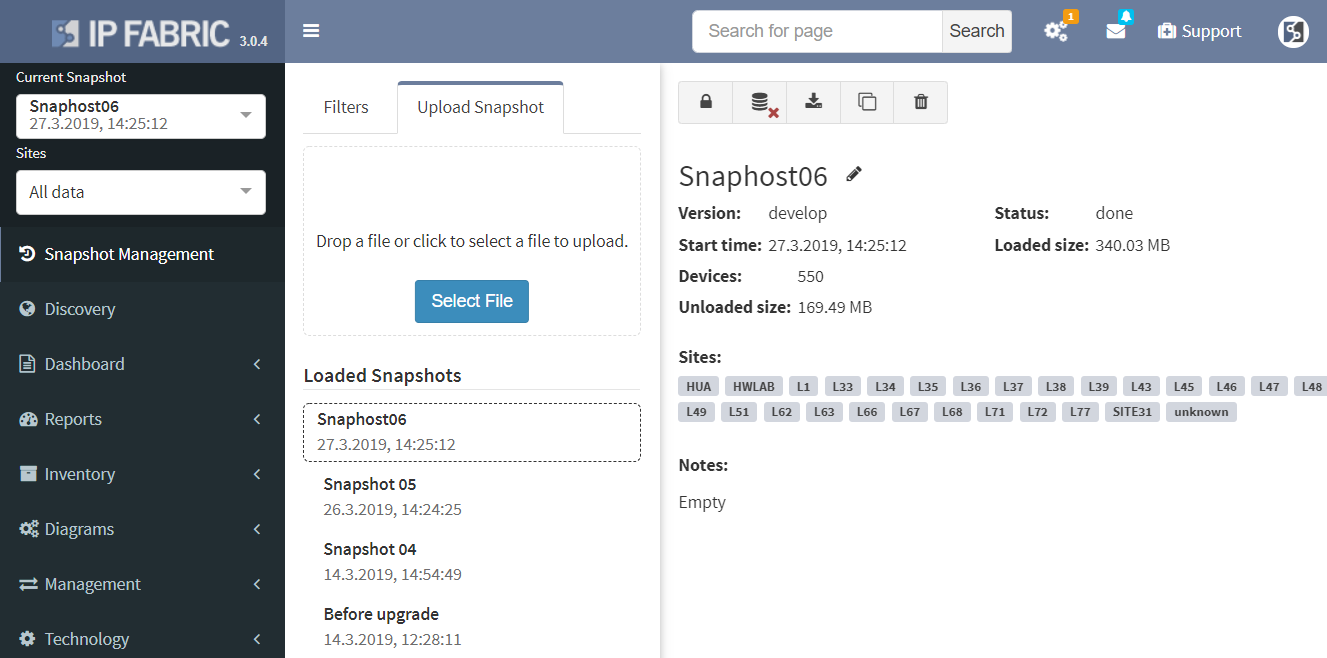
Notably, the Discovery and Snapshot Management pages were merged together. This was a logical step for the platform. We had the Discovery and the Snapshot Management on separated pages, however, every new discovery creates a new snapshot. Now it is much easier to navigate and manipulate with snapshots.
Another great news is for API documentation! From now on it's not only available online in the official documentation, but it is also included in the platform itself. At every one of the technology tables, we can now view related API details. This should make it easier to integrate the IP Fabric platform with any other management system.
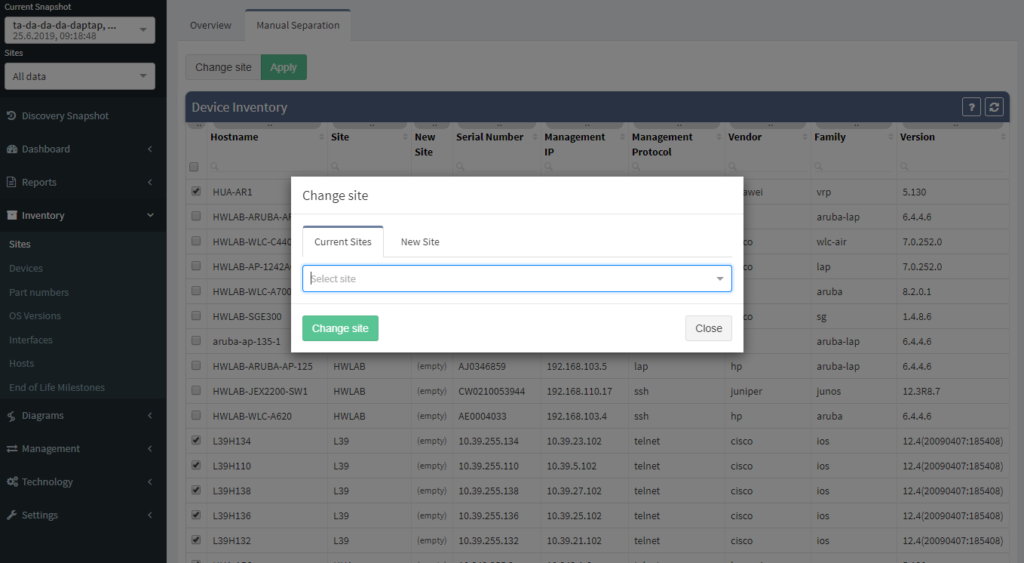
One of the most awaited features is undeniably the Site Separation update. It's only the first step, but the Manual Separation is available in the Inventory - Sites technological table. The logic is that the user would let the system separate the sites automatically and would then use the manual site separation option for fine-tuning and minor corrections through the inventory.
The network verifications are a pivotal part of the IP Fabric platform which enables a proactive approach to network management by uncovering hidden issues that might result in the outage or issue in the future. All network verifications within the IP Fabric platform have been refined to better serve their purpose and we've added descriptions to all of them.
All network verifications that are in the platform by default are still fully customizable and users can create their own of any type and include them in the main Dashboard.
In addition to this update, we've enabled customization of the Network Analysis Report document to reflect the changes and any customizations in the Dashboard, so that the report now includes the result of all verifications, including detailed descriptions of the issues.
This big change also meant any previous dashboard customizations are removed due to the difficulty of migration of old checks without descriptions to new checks with descriptions. Underlying verification definitions have remained in place, so it should be a matter of a few clicks to re-add them, and we'll be happy to help you in case you've lost track of the dashboard customizations.
End to End path simulation continues to be one of the key components in Intent-Based Network Analytics and an important use case of our platform. End-to-End path simulations verify the forwarding and security of any communication pair for every snapshot through our network model in mere milliseconds.
Since we've added support for Fortinet security policies, from now it's possible to verify both forwarding and security policies of Fortinet Fortigate equipment through vDOMs within the End-to-End path forwarding check.
There were a number of refinements to forwarding decision calculations in the network model and updates to the visual representation of the path. For example, MPLS links are now displayed based on the presence of the label stack to help to differentiate where the label is popped through PHP and where it is added.
To read more about individual changes that did not make it into the announcement, you can take a look into release notes.
If you have found this useful, follow our company’s LinkedIn or Blog, sign up for one of the Webinars, or request demo or trial to see how the platform can help you to manage your network infrastructure more effectively. For more information or to contact us please visit www.ipfabric.io.
Would you appreciate much faster end-to-end path lookup simulation on big networks, prettier diagram layout or more extensive routing protocol support? We thought so and that’s why we decided to create even more seamless experience through recent updates. Let’s summarize all the effort.

Special thanks to our Network Automation Architects, the routing protocol support has improved for Border Gateway Protocol (BGP) support, that is now available for majority of the platforms. And the same for IS-IS protocol support, which is now available for more hardware manufacturers than before as well. Apart from that we have also completed Spanning-Tree support for Extreme XOS.
Our core development team pushed their best to create better end-user experience when working with end-to-end path in diagrams. The overall layout of network devices on the path is improved and the user has the option to see isolated path only or include surrounding devices in visualization. Not to mention that query algorithm has been revamped as well, which improved its already satisfying performance.
Discovered end points connected to Access-points are now included in end-to-end path simulation besides.
Notably the discovery for some of the HP Aruba switches has been corrected. Another major improvement is with Network history feature. The Network history is available via what we call the Snapshots or Digital footprint of your network. It has started from version 3.0.0. A Snapshot is created with each new discovery and they are often used to view the historical correlation between past and present state.
To be able to use any snapshot, it needs to be available in Random Access Memory (RAM) where the most recent snapshots are being kept. If there’s any historical one that has already moved from RAM to HDD of the virtual machine, it needs to be loaded first. We can currently load up to 5 snapshots at a time. With version 3.0.5, thanks to updated algorithm, the load time is up to four times faster than with previous version.
If you have found this article resourceful, please follow our company’s LinkedIn or Blog. There you can find more content emerging. You would like to test our platform and observe how it can assist you in more efficiently managing your network? feel free to contact us through our web page www.ipfabric.io.
The latest 2.2.8 version released very recently again brought new powerful features and updates to our customers. IP Fabric is continuously gathering feedback and request from customers and one of them was to be able to work with more network devices and vendors, specifically devices from Arista Networks.
I have been in the networking field for almost 10 years now. I started with Cisco (as majority of network techs), then shifted to Juniper and played with other switches and routers along the way (not mentioning firewalls or other equipment) like HPs, Netgear, VyOS, MRV and more, but I have honestly never ever tested equipment made by Arista before. So I am feeling a bit excited by stepping into unknown.

I am not about to let you dive through our process in detail, there are technical parts in the IP Fabric process that should be kept under the hood for special reasons. However it logically involves studying provided materials related to new technologies in detail, testing classic routing and switching topologies from start and devices’ interaction capabilities with our systems. We also work with subject matter experts and domain experts to guide us through the process.
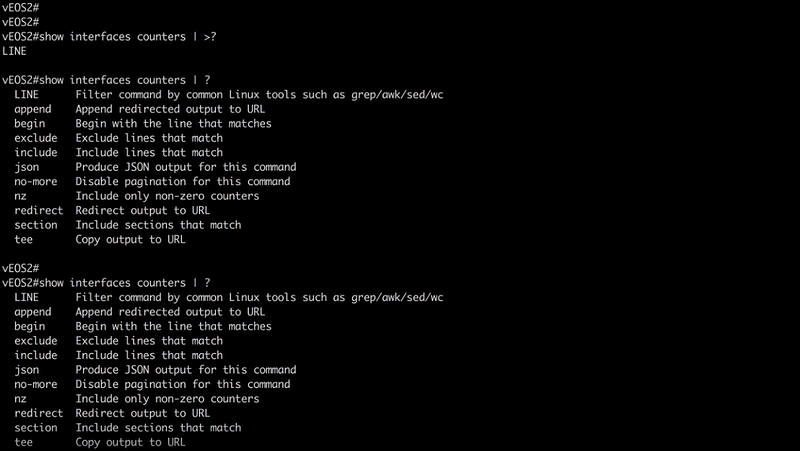
Luckily for me I may say there may be undeniable resemblance when it comes to command line interface to other vendor that we already support. I am not gonna mention which one it is, but you can test on your own. And that is saving us some time, so we don’t have to reinvent the whole wheel in regards to device discovery. Arista Networks was founded in 2004 by former Cisco engineers, their boxes run on linux based Extensible Operating System (EOS). And I praise it a lot, it has python library included, you can jump to bash and play along as you like as in any linux environment. I haven’t tested their Json-RPC yet, but I am probably about to. I’d say the whole EOS concept is very clean and open and of course you can run your own scripts. There’s also vEOS on the market for cloud environment.
All good for now, I am very happy to announce this little teaser for next release and stay with us!
If you’re interested in learning more about how IP Fabric’s platform can help you with analytics or intended network behavior reporting, contact us through our website, request a demo, follow this blog or sign up for our webinars.
Routing, one of the most important features in network world. It’s been at least a two decades since most of ISPs rely on Border Gateway Protocol (BGP) in their core, supported by Interior Gateway Protocols (IGP). Local area networks are running and routing with use of IGPs on their own and it’s already being utilized as an underlying protocol for other features like Virtual Extensible LANs and more. There’s no question that routing as a feature is holding technological world together, but as networks grow, it’s more and more obvious that administrator are more likely to miss an issue.
Command line interface is fast but when we try to see a bigger picture, we can easily miss the point while interacting with ten routers at once. That’s why routing protocol visualization itself become one of the most wanted features in IP Fabric since its start.
Routing table discovery has been implemented for a long time now and it’s not what will be discussed. Very recently we have been working on various parameters discovery for routing protocols, it started with OSPF support, while RIP support is in progress (and yes it’s still out there), Cisco native EIGRP and of course BGP. All have full Virtual Routing and Forwarding (VRF) instances support, which makes it a much more powerful as a feature for larger networks. The very next in line may be IS-IS, but I don’t want to speculate for now.
Open Shortest Path First (OSPF) may be one of the most used IGP protocol at this time. Again, I haven’t seen all networks in the world but my guess is, it would be so. It’s very wide-spread within vendors, easy to implement. IP Fabric currently supports OSPF on Cisco, Juniper and HP/Comware all with VRF support. Let’s have a quick tour in our lab.
In our virtual lab environment we ran discovery from IP Fabric and if in search of OSPF data, the best is to visit Technology > Routing > OSPF from the left-side menu.
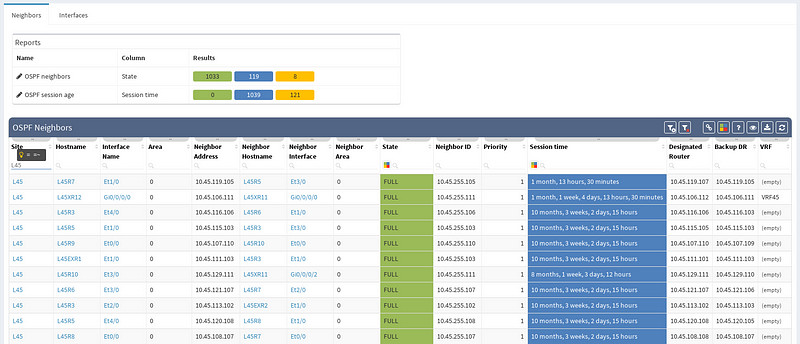
It’s very neat set of information, clear to all techs and the view is vendor neutral. For example the ‘Area’ information is formatted/translated to single integer, also for Juniper boxes where it’s standardly represented in IP/CIDR format. Again you can manipulate the view, remove or add columns or even change their order as you like, it’s all very flexible. Let’s switch to visual interpretation.
While in diagrams, all parameters pop-up as we need, those are the same as provided in OSPF neighbors table, but it’s filtered per diagram content. Same we can explore in BGP, we can even see Autonomous System numbers on connecting links. IP Fabric currently supports also site-to-site OSPF neighbourship when using tunnel interfaces of other technologies.
If you’re interested in learning more about how IP Fabric’s platform can help you with analytics or intended network behavior reporting, contact us through our website, request a demo, follow this blog or sign up for our webinars.
To begin with, IP network gateway redundancy has become a very standard high availability solution. In IP Fabric's platform it’s described as First Hop Redundancy Protocol (FHRP) feature that currently umbrellas HSRP, VRRP and GLBP protocol.
I have prepared a little scenario in our virtual lab with a LAN switched network protected by a firewall that is forwarding all traffic out with a default static route towards virtual VRRP gateway. The virtual gateway is created with the help of two Juniper boxes, vMX and vSRX in packet mode with no security policies defined (functions as a router).
After successful discovery with IP Fabric version 2.2.5 we will confirm correct VRRP setup by using diagrams and by slightly modifying our view.
There’s a simple ring topology consisting of 6 routers total (3 of them are SRX, that are considered correctly as device with firewall capabilities, specifically static1r16, static1r17 and static1r18, but all act as routers). Other three routers in the ring are vMX routers.
First, I would like to verify that VRRP is operational and correct virtual gateway is active. In IP Fabric in diagram Options panel we check ‘Show FHRP’ and if configured properly, both gateways would pop-up on the diagram. Afterwards, by simply navigating to FHRP yellow button in diagram, we would discover further VRRP setup, which seems to be correct. Router static1r18 is supposed to be the primary gateway. It’s closer towards exit points and it has greater link capacity with LACP interface compared to router static1r17.
We are currently seeing only IP related connections between routers, there’s single area OSPF as primary IGP protocol, with static routing already mentioned above (originating from static1fw56–1, pointing towards VRRP gateway). Well, let’s verify that.
There’re more options about how to obtain routing information in IP Fabric, but we can go directly from our current diagram. We simply click the firewall node on screen and all information are there. In the routes panel we only filtered all routes for ‘S’ (static routes). We verified next hop IP and interface, route metric and it seems we are good to go!
If you’re interested in learning more about how IP Fabric’s platform can help you with analytics or intended network behavior reporting, contact us through our website, request a demo, follow this blog or sign up for our webinars.
Have you ever tried to find out why the dynamic routing protocol in your network is not passing specific prefix as expected? And the situation had not improved even though ad-hoc static routes were created here and there? Networking protocols are designed to be simple in general. However, they can create very complex state machine systems that may be very hard to diagnose router by router.
What to do when the destination router is positively redistributing the route to the network but the source router does not have a clue about it? Each router should be analyzed one by one and assessed with following topics:
This involves checking the configuration and state information from all routers on all possible paths over the network. Outputs from neighbors must be compared to locate where the route blackhole has been erroneously created. It usually involves lot of administrative sessions to the router and manual work as the scripts for this task would be too complex to create.
IP Fabric offers a very convenient way to see where the problem may be. Do you have a suspicion that your route is a part of a routing loop? One of the links is constantly going up and down? The outer address of a tunnel is advertised inside the same tunnel? You simply put your troubled route as a filter to Routing stability table.
You can quickly look up any route on any router in the network by the following criteria:
All lookups are VRF-aware and return the results in seconds. You will see how many times is the route present in the network and if it recently converged which would indicate instability.
If the route is not flapping, it still may be incorrectly distributed. You simply put your troubled route as a filter to Cumulative network table and you can immediately see which routers know about it and which routers don’t.
You can quickly check the protocols that are used to transport the route (or if the subnet is directly connected or statically routed). Moreover, you can quickly assess all next-hops and trace the path on one screen instead of logging to each router and looking for details manually.
Furthermore, you can have an overall view of all the routing methods (directly connected, static or dynamic) used in your network. Those should match the network design — not desired protocols should be turned off and the desired ones should be up. Even the misconfigured exotic routing protocol left behind from testing can be a source of suboptimal or faulty routing.
IP Fabric can help you approach possible routing problems proactively. It is pointless to have half-open routing peerings or misconfigured neighbors even though it does not affect any network traffic so far. Those should be either repaired or removed from the network. For example table of OSPF, neighborships will quickly show routers where the peerings should be revised because it did not reach the FULL state.
Are you eager to see all of IP Fabric’s powerful features? Schedule a time for a free video call with our expert team who will help create a solution to fit your needs.
Network loss is one of the key performance indicators and is used throughout the networking industry for performance evaluations. But how do you evaluate loss network-wide?
Monitoring loss in a specific flow or service is precise but has a number of inherent disadvantages, such as that it must be explicitly provisioned, that the resulting measurement only tells information about a single service path, and that there is no specific information of where the loss occurred or what caused it.
Interface packet counters can provide this information, as they already record every single packet loss, including the specific reason for the loss. However, counters report a loss for a specific element, and high dropping element might be a mirroring port or a port connecting a misbehaving printer, with little impact to production. Surely you’ll want to know about those issues as well, but a significant loss on an uplink interface serving thousands of users is going to have much higher business productivity impact.
The IP Fabric platform combines these approaches, providing loss impact visibility at every point in the network from deltas of the packet counters, and then determining the significance of each issue by calculating the number of affected users.
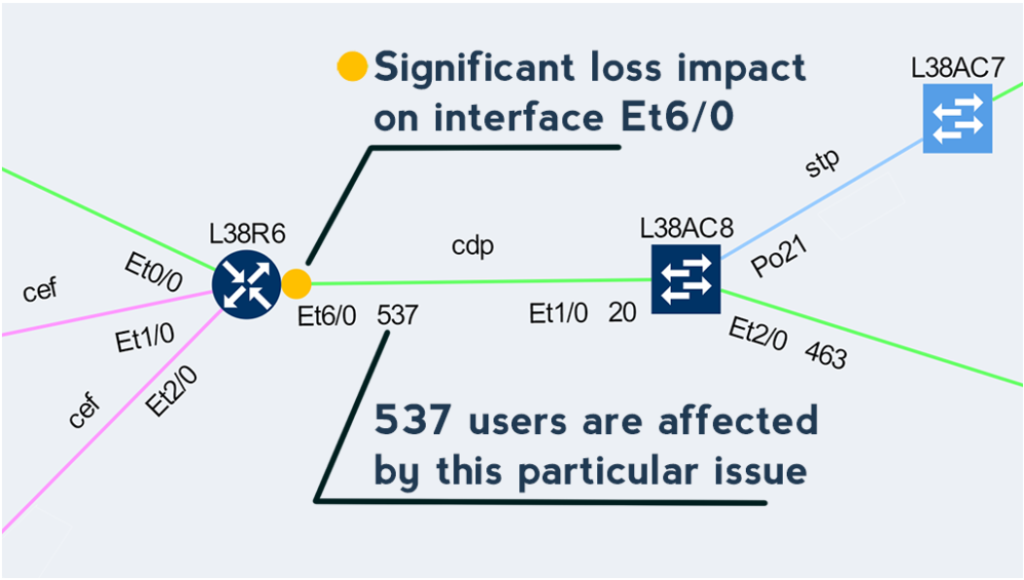
This approach enables to quickly prioritize issues affecting business productivity the most, and at the same time pinpoint the exact location and cause of the issue, providing a clear path to remediation.
If you have found this article resourceful, please follow our company’s LinkedIn or Blog. There will be more content emerging. Furthermore, if you would like to test our platform to observe how it can assist you in more efficiently managing your network, please write us through our web page www.ipfabric.io


