PRTG integration with IP Fabric's API is another beautiful example of functional synthesis. Network monitoring tools are and have always been the key part of network management. For some, it may be just testing availability with ICMP or collect interface and CPU stats with SNMP. But for many network engineers, this is simply not enough.
To be able to build monitoring ecosystems correctly, one needs to have a full and very detailed understanding of implemented technologies and vendors or understand services that run on top of everything.
Any performance or telemetry stat is dependant on the data source and the more data we have to work with, the more options and insight we can provide.
In this article, we will describe the basic concept of sharing data between IP Fabric platform's data and PRTG Network Monitor (Paessler Router Traffic Grapher until version 7). The beauty of IP Fabric is that all data are available via API (yes, even the application end-to-end path simulation). And the beauty of PRTG is that it's not just a basic monitoring tool, it can read many different kinds of data, including API JSON responses. And that's exactly what we will try to achieve.
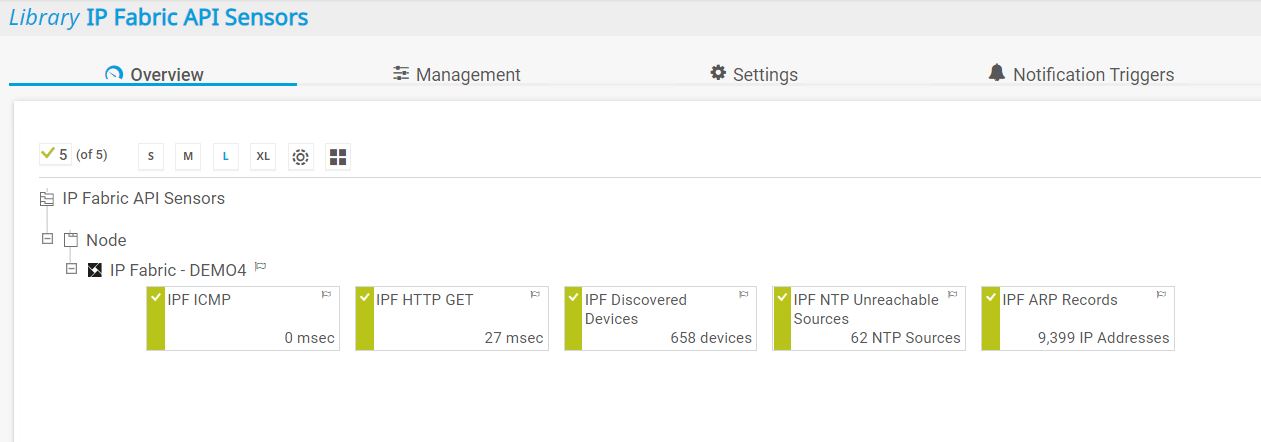
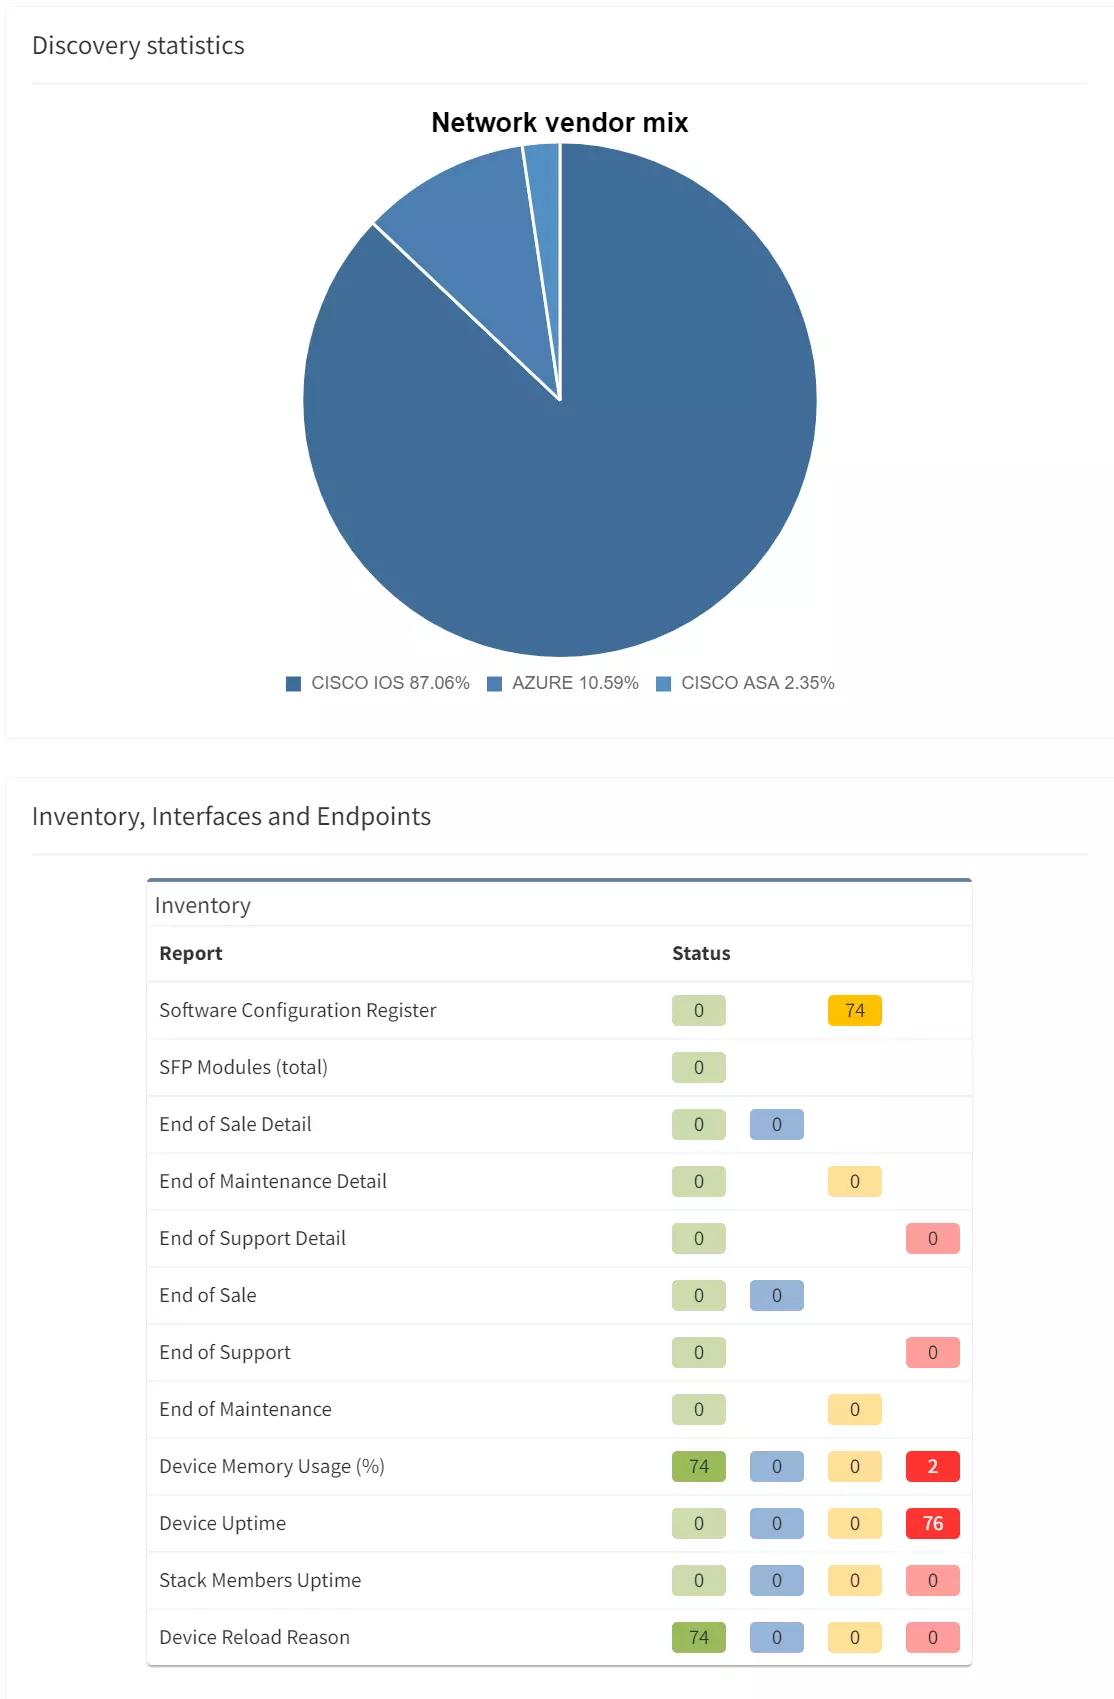
In PRTG, we will create a variety of new REST sensors, that will read data from IP Fabric's API. The sensors will include the number of discovered devices, the number of detected IP addresses via ARP protocol, or unreachable NTP sources detected by IP Fabric. All from the latest snapshot.
Before we start creating any new sensors in PRTG, we need to make sure we have following prerequisites ready:
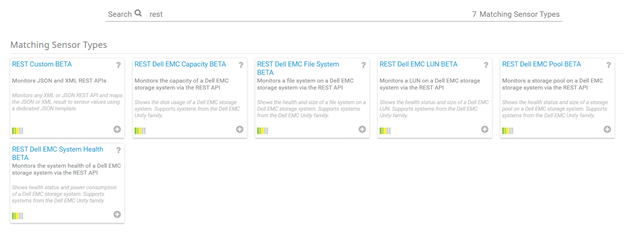
The full documentation of PRTG Custom REST sensors is covering all we need for successful implementation. But first, let's discuss what we are going to achieve.
With the first REST sensor, we will monitor the number of discovered devices from the latest snapshot. It will help us to see the trend after every new discovery is completed. The reading frequency for the sensor should depend on the frequency of your snapshots. If you are running 1 full snapshot every 12 hours, the sensor could read the data let's say every hour (to possibly cover manual snapshots in between).
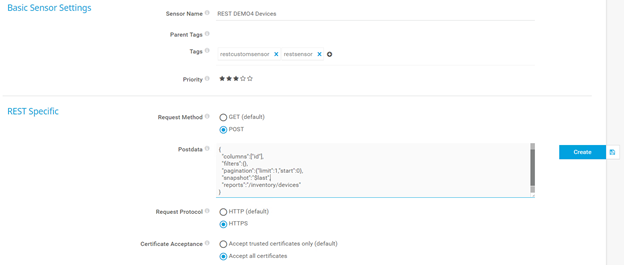
Let's see what parameters we need to include in the sensor to collect our data.
{
   "columns":["id"],
   "filters":{},
   "pagination":{"limit":1,"start":0},
   "snapshot":"$last",
   "reports":"/inventory/devices"
 }
Content-Type:application/json
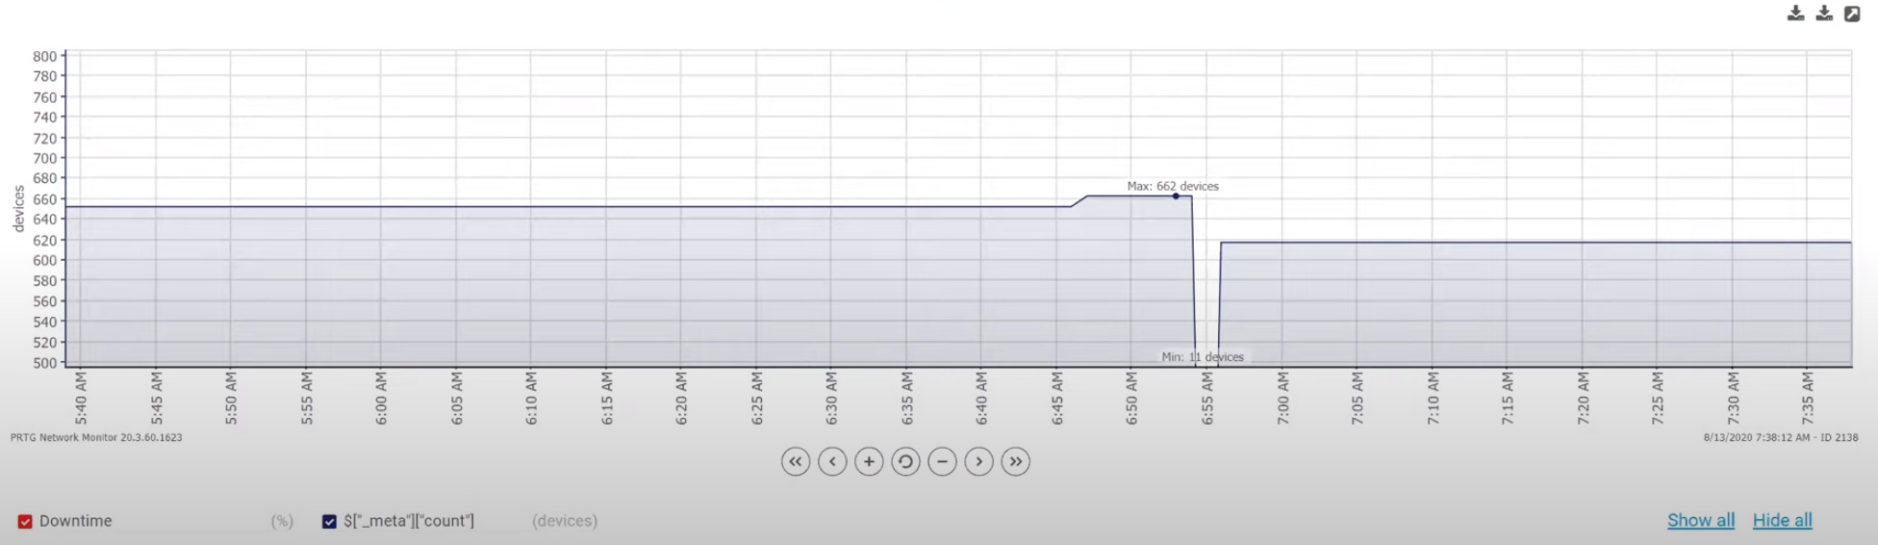
The result is a trend monitoring for the number of discovered devices in time with each new snapshot.
This one is just an example of a random collection. PRTG integration with IP Fabric's API can accomplish anything that comes to our mind, the options are endless. It can be a number of detected MAC addresses per selected device and interface or amount of BGP routes on the route reflectors.
The IP Fabric's purpose, in this case, is to collect data and represent the output in a standardized fashion. The engineers' job is to use the data in any way they need.
Let's see what parameters we need to include in the sensor to collect the ARP data.
{
   "columns":["id"],
   "filters":{},
   "pagination":{"limit":1,"start":0},
   "snapshot":"$last",
   "reports":"/technology/addressing/arp-table"
 }
Content-Type:application/json
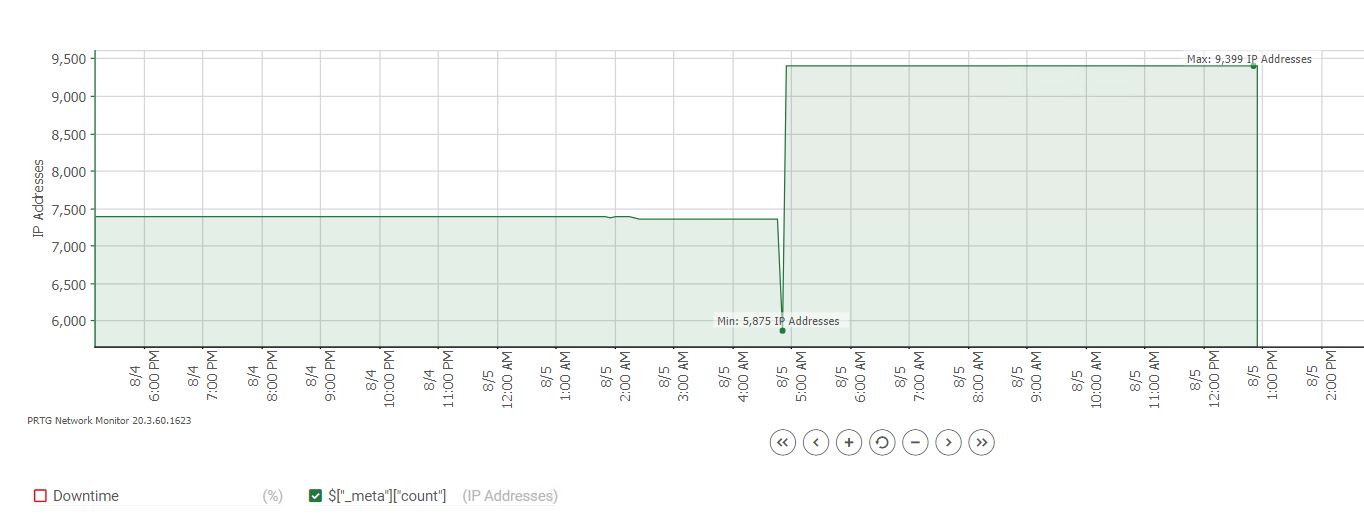
The following live data chart is showing a trend between two snapshots in time (from about 7500 to 9399 detected IP addresses from all ARP tables in the network).
For this particular sensor, we will use the intent verification rules in IP Fabric. The platform is loaded with about 100 best practice rules, that are immediately available after the very first discovery. They can be customized and more can be designed and created in GUI or over API.
One of the examples is the 'NTP Stratum Level', that represents the hierarchy of time servers. The Stratum value 16 means that the device is completely unsynced and it's easy to detect this issue in IP Fabric.
Let's see what parameters we need to include in the sensor to collect the NTP Stratum intent verification results (the filter part is very important).
{
   "columns":["id"],
   "filters":{"stratum":["color","eq","30"]},
   "pagination":{"limit":1,"start":0},
   "snapshot":"$last",
   "reports":"/technology/management/ntp/sources"
 }
Content-Type:application/json
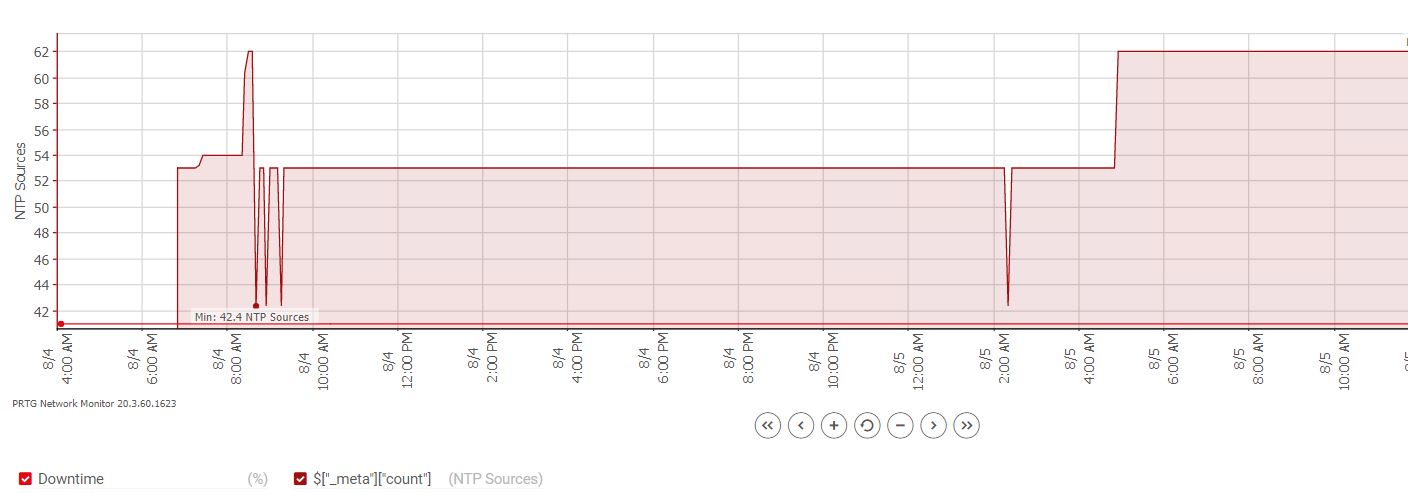
The following live data chart is showing a trend between two snapshots in time (from 53 to 62 detected unsynced NTP sources).
There are some BIG updates coming over the next couple of major versions in the platform, due over the coming months. Keep coming back to wordpress-625423-2416527.cloudwaysapps.com and follow IP Fabric on LinkedIn for more information as it drops!
PRTG integration with IP Fabric's API is another beautiful example of functional synthesis. Network monitoring tools are and have always been the key part of network management. For some, it may be just testing availability with ICMP or collect interface and CPU stats with SNMP. But for many network engineers, this is simply not enough.
To be able to build monitoring ecosystems correctly, one needs to have a full and very detailed understanding of implemented technologies and vendors or understand services that run on top of everything.
Any performance or telemetry stat is dependant on the data source and the more data we have to work with, the more options and insight we can provide.
In this article, we will describe the basic concept of sharing data between IP Fabric platform's data and PRTG Network Monitor (Paessler Router Traffic Grapher until version 7). The beauty of IP Fabric is that all data are available via API (yes, even the application end-to-end path simulation). And the beauty of PRTG is that it's not just a basic monitoring tool, it can read many different kinds of data, including API JSON responses. And that's exactly what we will try to achieve.
In PRTG, we will create a variety of new REST sensors, that will read data from IP Fabric's API. The sensors will include the number of discovered devices, the number of detected IP addresses via ARP protocol, or unreachable NTP sources detected by IP Fabric. All from the latest snapshot.
Before we start creating any new sensors in PRTG, we need to make sure we have following prerequisites ready:
The full documentation of PRTG Custom REST sensors is covering all we need for successful implementation. But first, let's discuss what we are going to achieve.
With the first REST sensor, we will monitor the number of discovered devices from the latest snapshot. It will help us to see the trend after every new discovery is completed. The reading frequency for the sensor should depend on the frequency of your snapshots. If you are running 1 full snapshot every 12 hours, the sensor could read the data let's say every hour (to possibly cover manual snapshots in between).
Let's see what parameters we need to include in the sensor to collect our data.
{
   "columns":["id"],
   "filters":{},
   "pagination":{"limit":1,"start":0},
   "snapshot":"$last",
   "reports":"/inventory/devices"
 }
Content-Type:application/json
The result is a trend monitoring for the number of discovered devices in time with each new snapshot.
This one is just an example of a random collection. PRTG integration with IP Fabric's API can accomplish anything that comes to our mind, the options are endless. It can be a number of detected MAC addresses per selected device and interface or amount of BGP routes on the route reflectors.
The IP Fabric's purpose, in this case, is to collect data and represent the output in a standardized fashion. The engineers' job is to use the data in any way they need.
Let's see what parameters we need to include in the sensor to collect the ARP data.
{
   "columns":["id"],
   "filters":{},
   "pagination":{"limit":1,"start":0},
   "snapshot":"$last",
   "reports":"/technology/addressing/arp-table"
 }
Content-Type:application/json
The following live data chart is showing a trend between two snapshots in time (from about 7500 to 9399 detected IP addresses from all ARP tables in the network).
For this particular sensor, we will use the intent verification rules in IP Fabric. The platform is loaded with about 100 best practice rules, that are immediately available after the very first discovery. They can be customized and more can be designed and created in GUI or over API.
One of the examples is the 'NTP Stratum Level', that represents the hierarchy of time servers. The Stratum value 16 means that the device is completely unsynced and it's easy to detect this issue in IP Fabric.
Let's see what parameters we need to include in the sensor to collect the NTP Stratum intent verification results (the filter part is very important).
{
   "columns":["id"],
   "filters":{"stratum":["color","eq","30"]},
   "pagination":{"limit":1,"start":0},
   "snapshot":"$last",
   "reports":"/technology/management/ntp/sources"
 }
Content-Type:application/json
The following live data chart is showing a trend between two snapshots in time (from 53 to 62 detected unsynced NTP sources).
There are some BIG updates coming over the next couple of major versions in the platform, due over the coming months. Keep coming back to wordpress-625423-2416527.cloudwaysapps.com and follow IP Fabric on LinkedIn for more information as it drops!