Large enterprise networks are constantly changing. Even if no administrative or configuration change activity is planned, the network lives by itself — the devices and links are going up/down and the network protocols are changing their states. How can you find unwanted changes as soon as possible?
The main goal in reactive network troubleshooting is to find the causality chain between the network problem (consequence) and network change (cause, often innocent) that happened beforehand. The change affected some components of the network which affected other components…and led to network problem at the end as a final consequence. Change visibility helps in proactive network analysis as well — some changes may not be visible to users yet, but the network administrator can see that problem may appear soon.
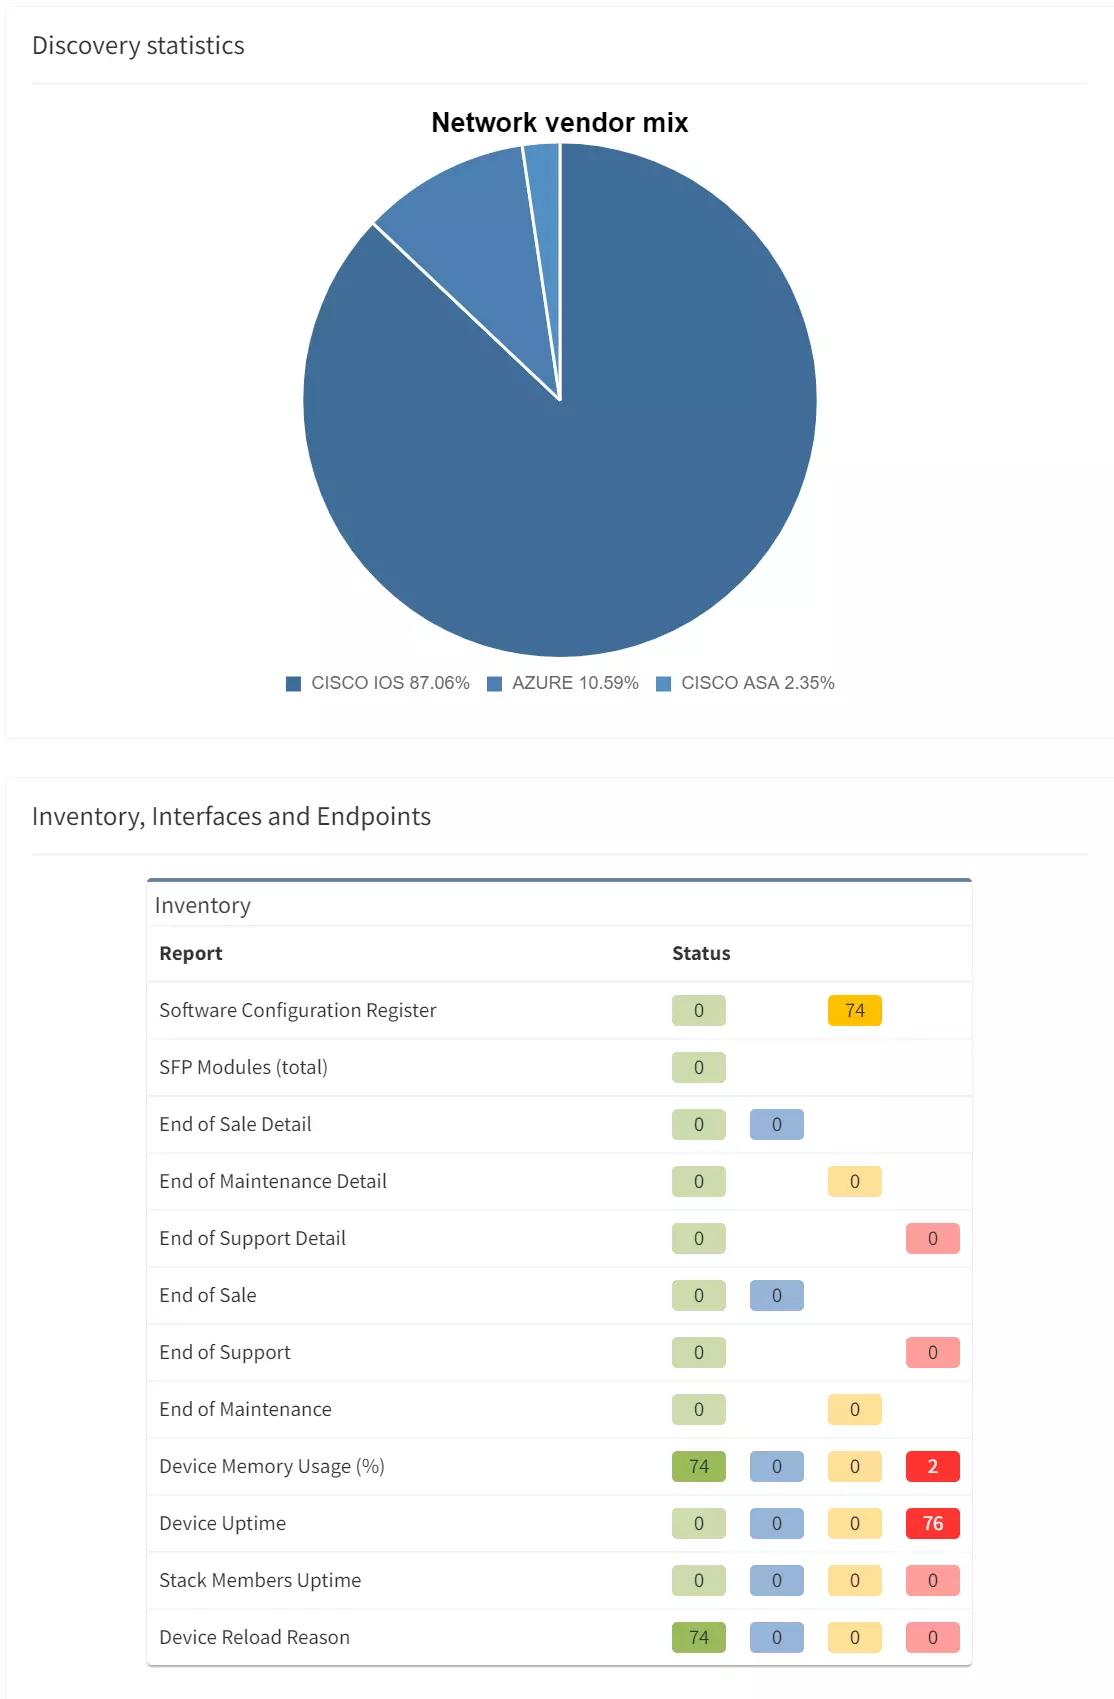
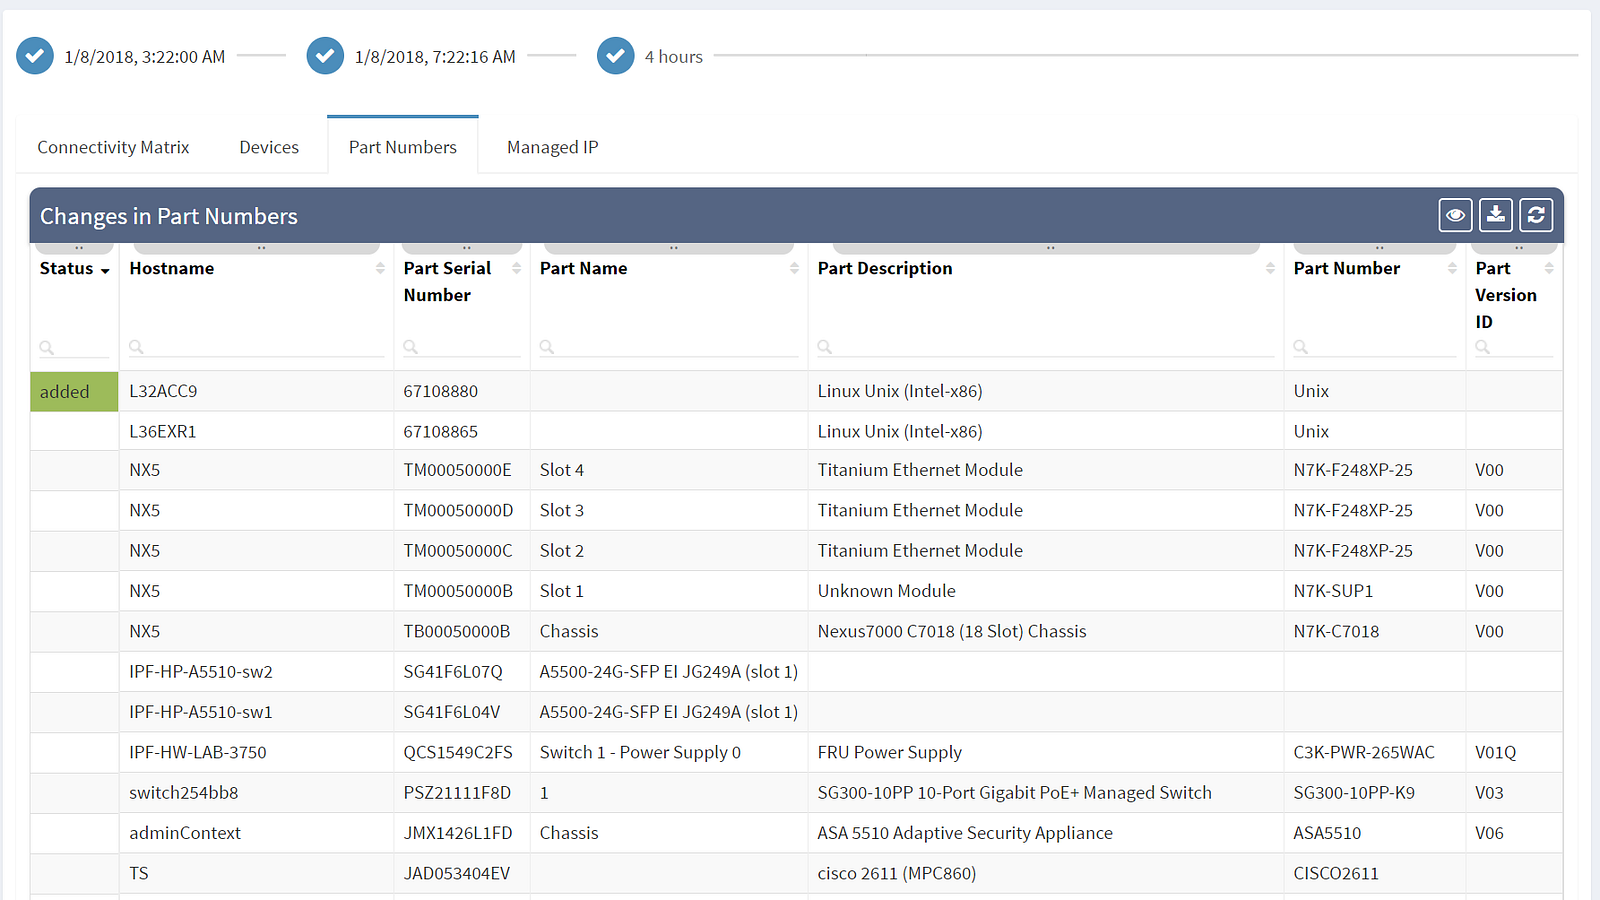
Thus the common question of a network engineer is: What has changed in the network since last time I was inspecting the network? Which device (or its component such as line cards, power supply, one of its transceivers…) was removed from the network? Which new device was added to the network? Which IP address changed its location or type? Which links were changed in the network? Is there a new protocol adjacency for STP? Is there different IP next-hop for a given destination (both indicating logical topology change)?
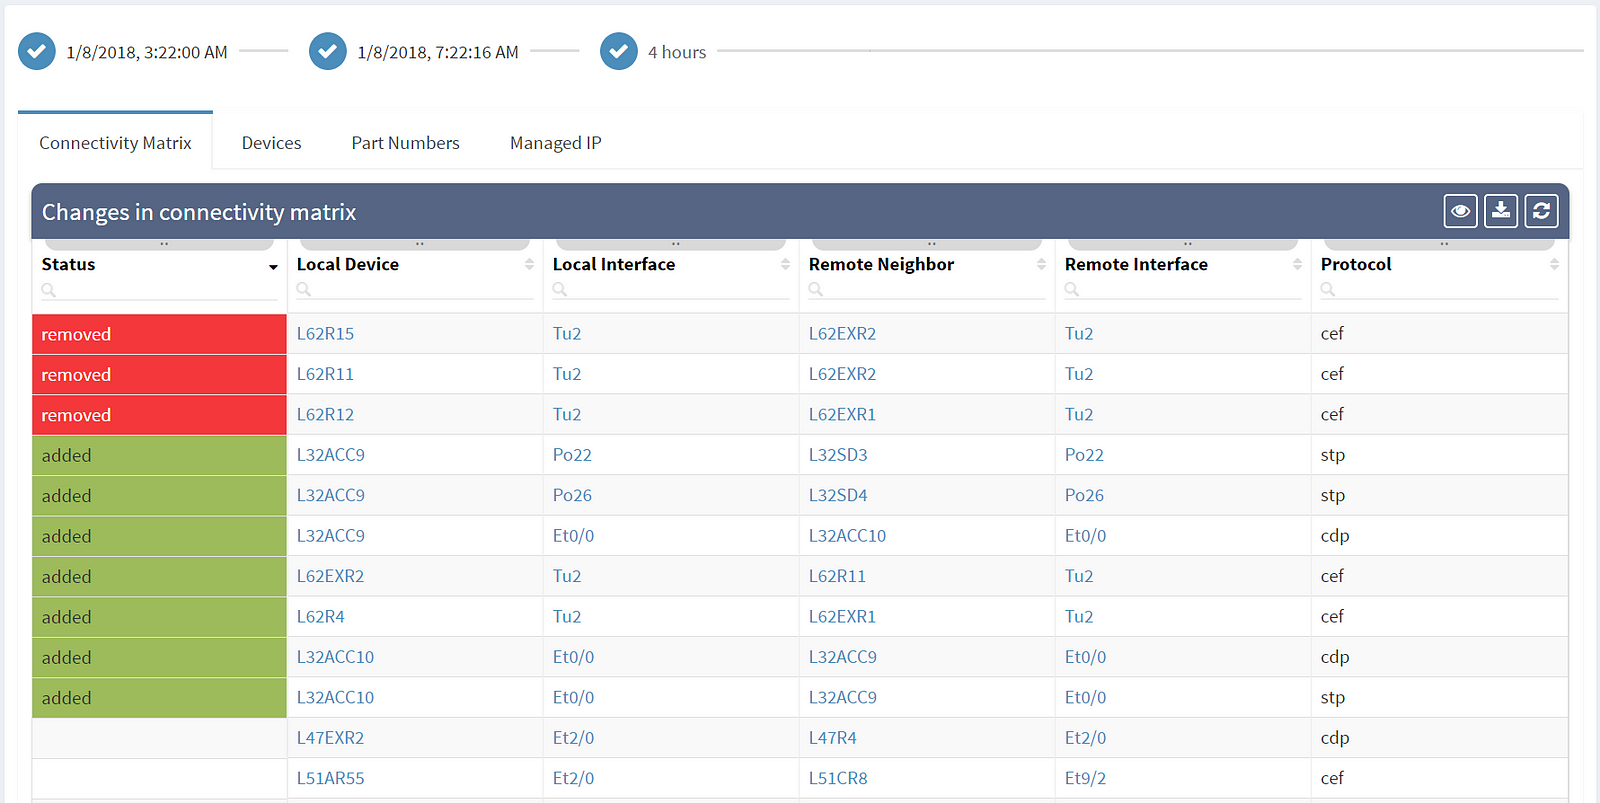
The first column shows the actual status — removed entities are in red, newly added entities are in green and the rest shows unchanged elements. Among the most common attributes displayed are the OS version (which should be as uniform as possible) and the serial number of the element (which if changed indicate HW replacement).
Are you interested to see all of IP Fabric's powerful features? Sign up for a trial or an online demo.
Large enterprise networks are constantly changing. Even if no administrative or configuration change activity is planned, the network lives by itself — the devices and links are going up/down and the network protocols are changing their states. How can you find unwanted changes as soon as possible?
The main goal in reactive network troubleshooting is to find the causality chain between the network problem (consequence) and network change (cause, often innocent) that happened beforehand. The change affected some components of the network which affected other components…and led to network problem at the end as a final consequence. Change visibility helps in proactive network analysis as well — some changes may not be visible to users yet, but the network administrator can see that problem may appear soon.
Thus the common question of a network engineer is: What has changed in the network since last time I was inspecting the network? Which device (or its component such as line cards, power supply, one of its transceivers…) was removed from the network? Which new device was added to the network? Which IP address changed its location or type? Which links were changed in the network? Is there a new protocol adjacency for STP? Is there different IP next-hop for a given destination (both indicating logical topology change)?
The first column shows the actual status — removed entities are in red, newly added entities are in green and the rest shows unchanged elements. Among the most common attributes displayed are the OS version (which should be as uniform as possible) and the serial number of the element (which if changed indicate HW replacement).
Are you interested to see all of IP Fabric's powerful features? Sign up for a trial or an online demo.