Juniper SRX is a wonderful firewall device with a lot of rich features. However sometimes the complexity of security policies may grow greatly with multiple embedded addresses or application objects, more virtual routing and forwarding instances, route leaks and so on. It can come to a point when managing all security rules and providing service to multiple clients for datacenter or other infrastructure at the same time, can become very cumbersome. The fastest and most secure interaction with the firewall so far is still the command line interface. This exact area is one of the strongest and most versatile, when it comes to Juniper boxes. If you are an experienced tech, you may be able to interact with the SRX swiftly and easily. Moreover, narrow down any critical information related to troubleshooted issue, but It’s not so simple with security rules export.
but It’s not so simple with security rules export.
To be able to successfully export security policies from SRX, we have handful of options. The very easy one is to export configuration between certain security zones to a file. Furthermore, upload to a server or send to a customer. But it could be time-consuming for a non-Juniper technicians or managers to be able to comprehend all the information.
Another option would be buying Junos Space software with Security Director plugin. It's a specialized administration and orchestration tool made by Juniper, which can be easily installed in the cloud. It’s a great all in one tool for almost any Juniper device. In Security Director, security policy exports can be filtered appropriately. However, the only format options are PDF or the ZIP file and only Juniper firewalls are supported.
Or we could develop any customized script using Junos PyEZ library and export policies to multiple file formats. A little bit of coding never hurts anyone and it’s fun. Nonetheless, it needs to be maintained and updated in time. Further, you would be still interacting with command line interface, if there would not be any front end supporting the script itself.
Or there’s one more option that is available since IP Fabric version 2.2.4 was released (the most current one is 2.2.5). After successful discovery of any Juniper SRX with security policies by IP Fabric, you are just few clicks away from full-fledged policies export. It’s simple as that.
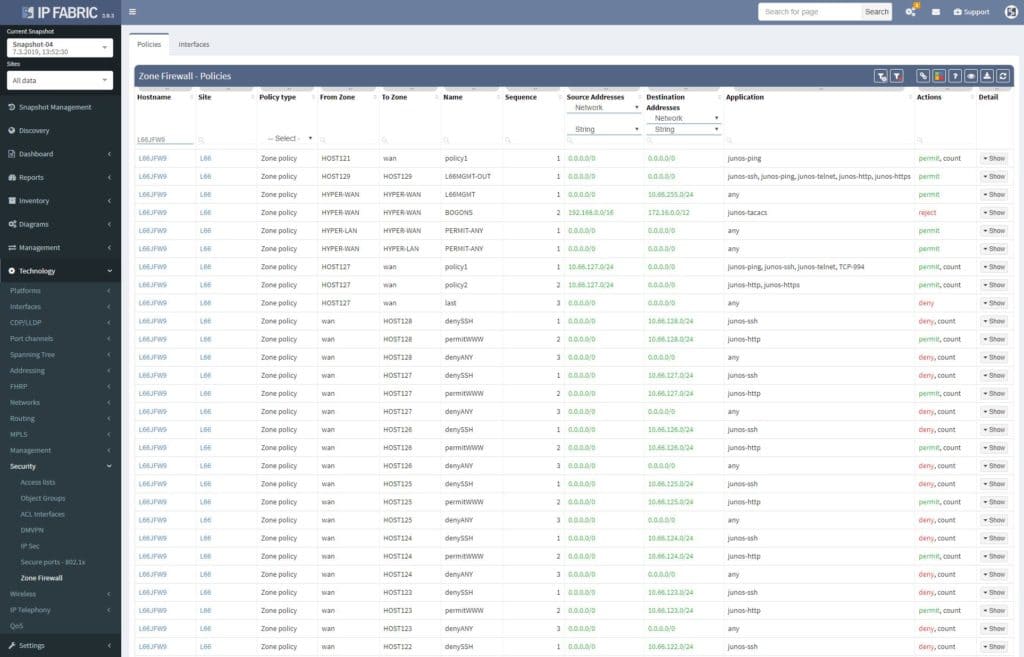
When opened in browser, the Zone Firewall related information can be navigated via Technology > Security. The default view is fully customizable, including colorizing columns, advanced filters and more. There’s a lot that has been done when it comes to custom tables and views recently.
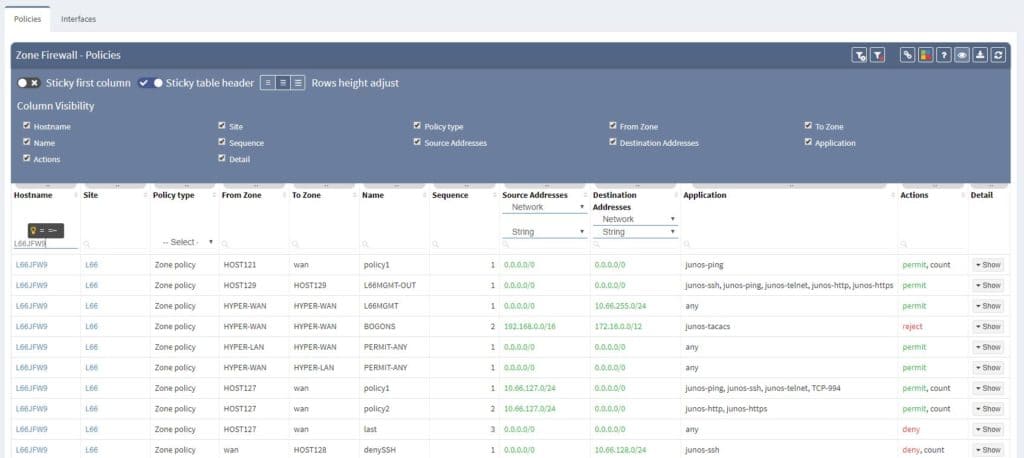
Single security policies can be furthermore unwrapped with address and application objects being resolved. IP Fabric understands even Junos default applications configured object and application sets, all well prepared for end-to-end path resolution via SRX, which is another stunning feature described in another article.
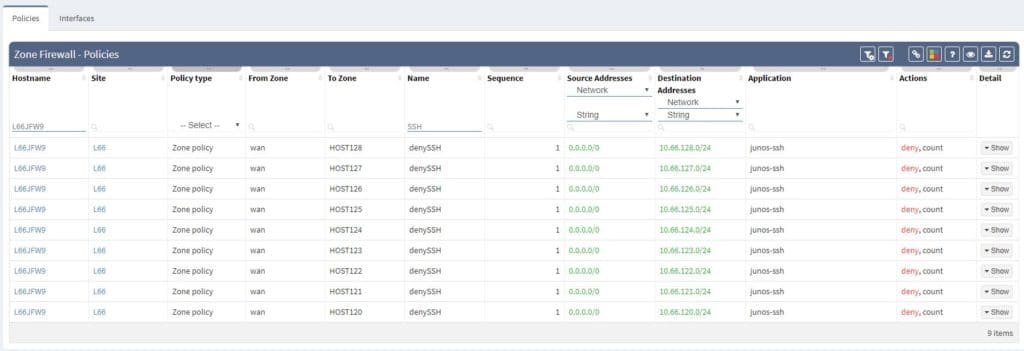
Filtering is supported with regex capabilities and its fast interface provides seamless experience to any security administrator or technical manager. Any filtered information can be exported to CSV format and downloaded.
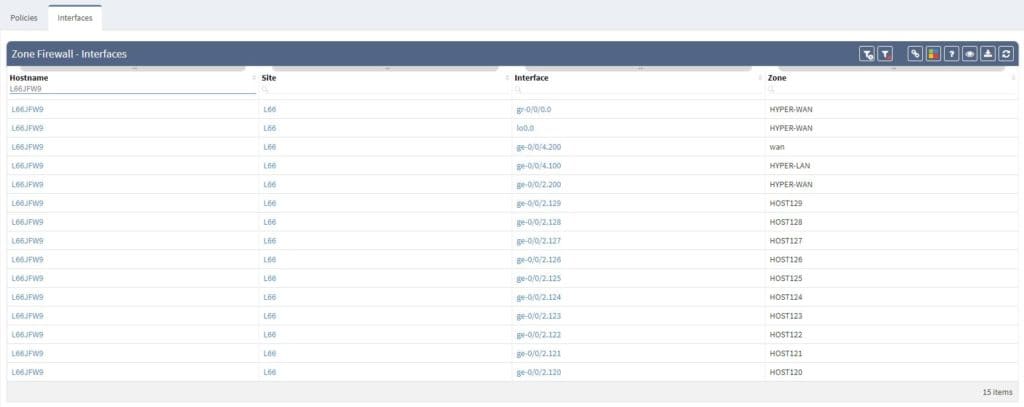
Another very handy feature is matching the security zones with its related interfaces. We need to simply navigate to Interfaces view when in Zone Firewall section and all information is available at hand, all can be exported as well. It’s all in one, easy to navigate and very fast to interact with.
If you’re interested in learning more about how IP Fabric’s platform can help you with analytics or intended network behavior reporting, contact us through our website, request a demo, follow this blog or sign up for our webinars.
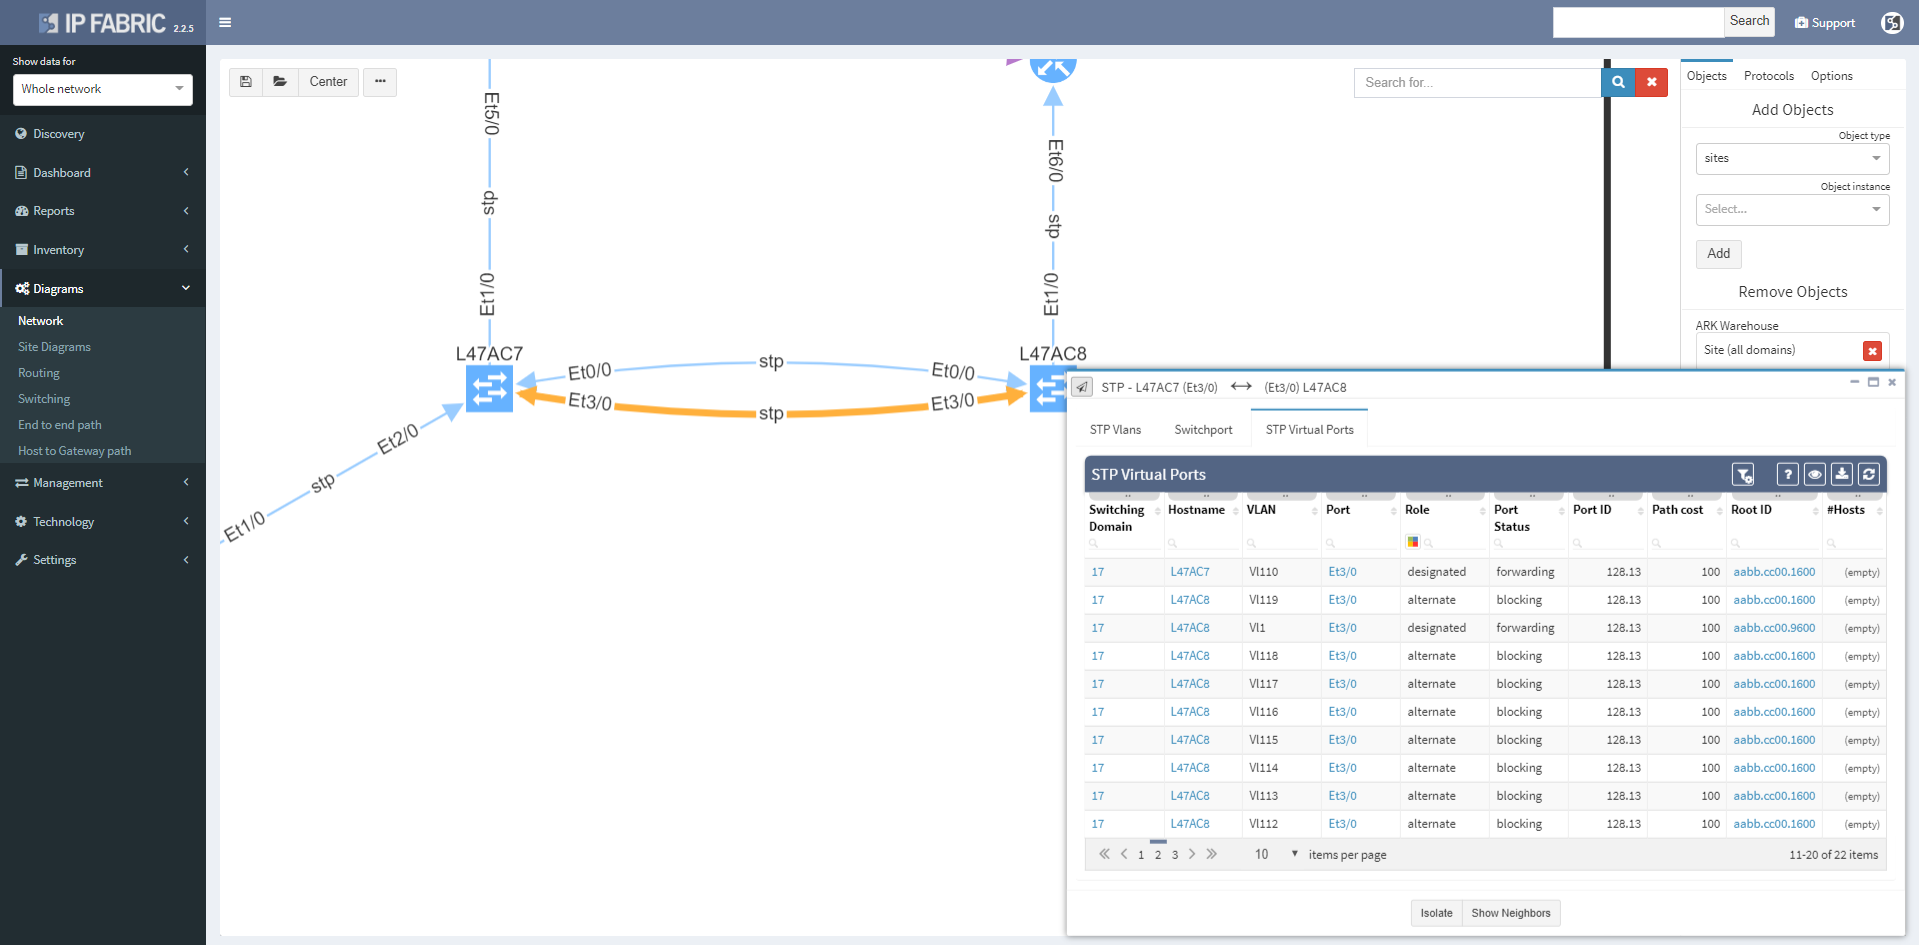
This week we released IP Fabric version 2.2.5 which focuses on improvements of network diagram workflow, significantly improving the depth of information provided in the diagram tooltips, and improving readability of the End to End path diagrams. We’ve also added pseudo-STP links, or MAC edges, to correctly interconnect Layer 2 and Layer 3 when discovery protocol is not present between the devices. This release also adds support for GLBP protocol, support for multi-context Cisco ASA firewalls, support for discovery of ExtremeXOS devices, wireless support for HP830/850, and many other improvements and fixes as detailed in the release notes.
Clicking on a device or link in the network diagram now opens a detailed tooltip with information about the object. Information is contained in tabs of each window, and tabs depend on what functions the device is performing and what protocols it is running. For routers there is naturally more Layer 3 information, including ARP and active routing table entries. For switches there is much more Layer 2 detail, such as switchports and MAC address table entries.
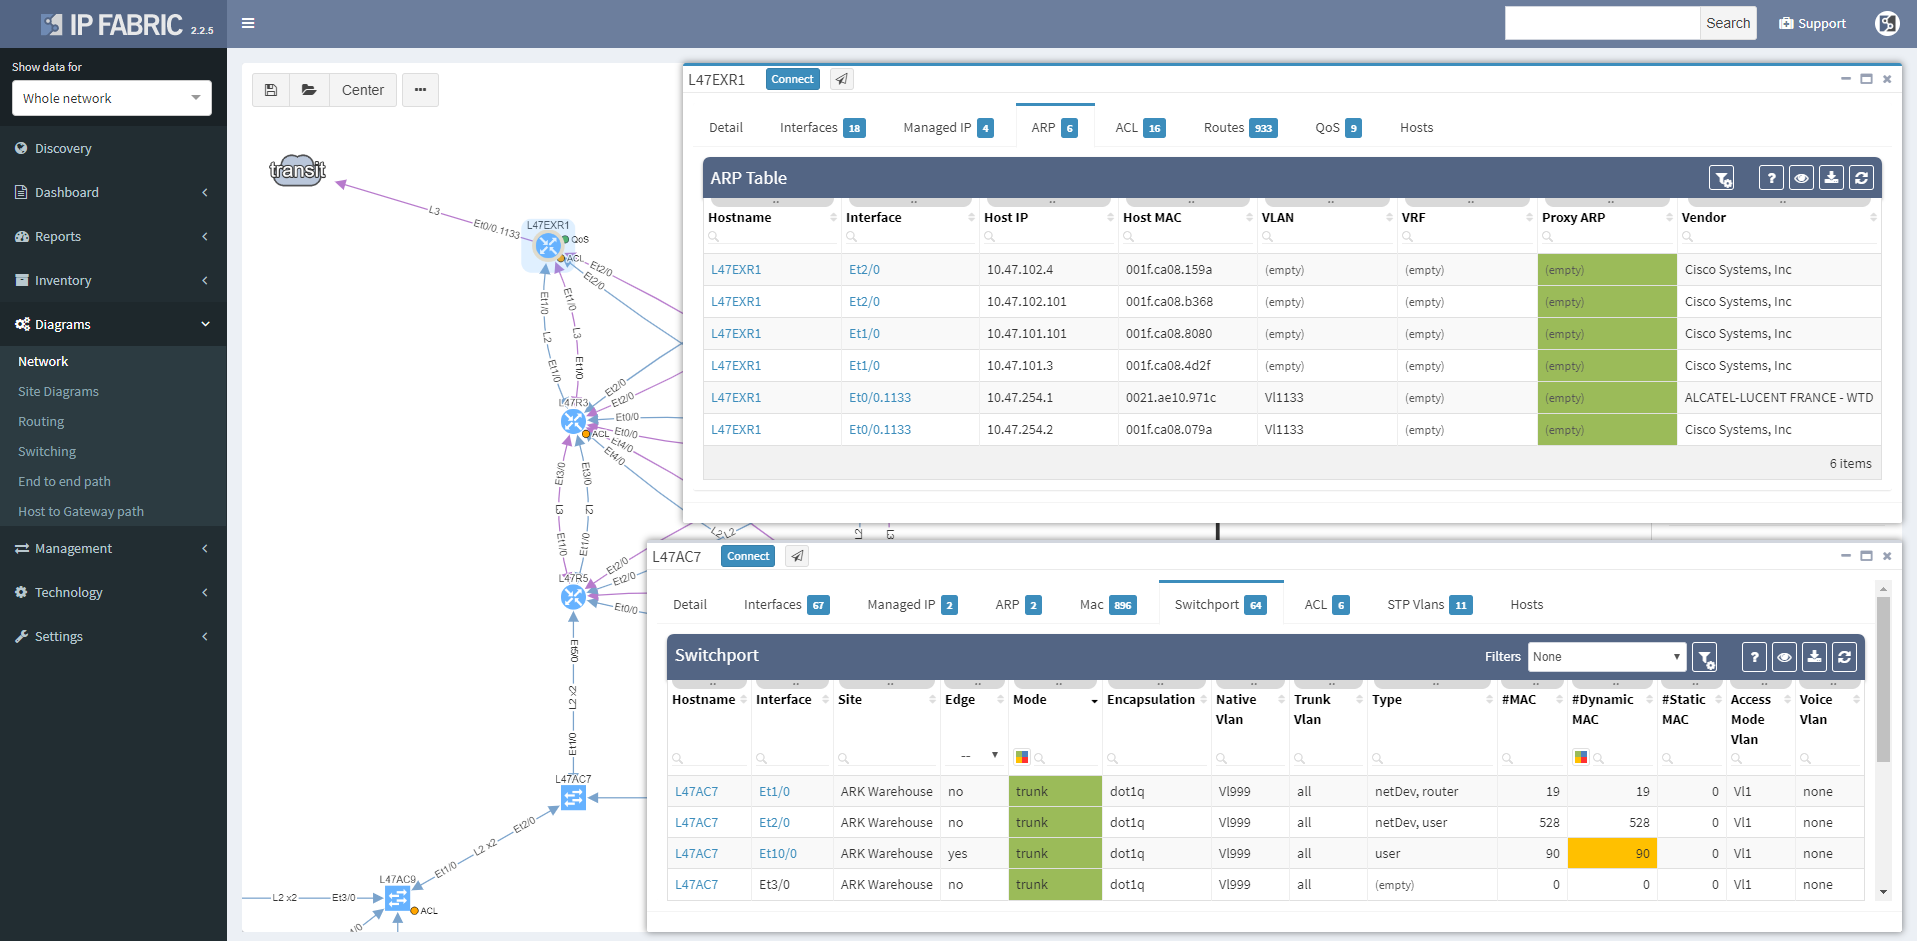
Wireless controller tooltips contain information about APs, firewalls about zones, and so on.
Clicking on a protocol link also opens a window with specific details relevant for the protocol, such as virtual ports and switchport details for the STP link
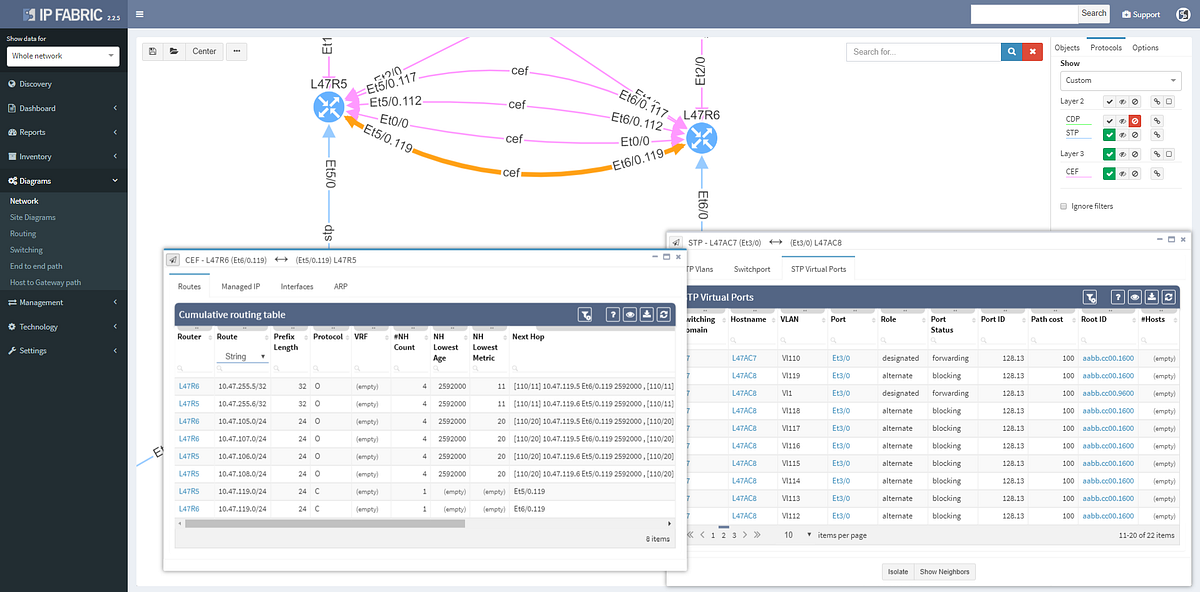
Or routes and for the routed links
Switching tab to the Managed IP on the routed link shows active IP addresses on both sides of that link.
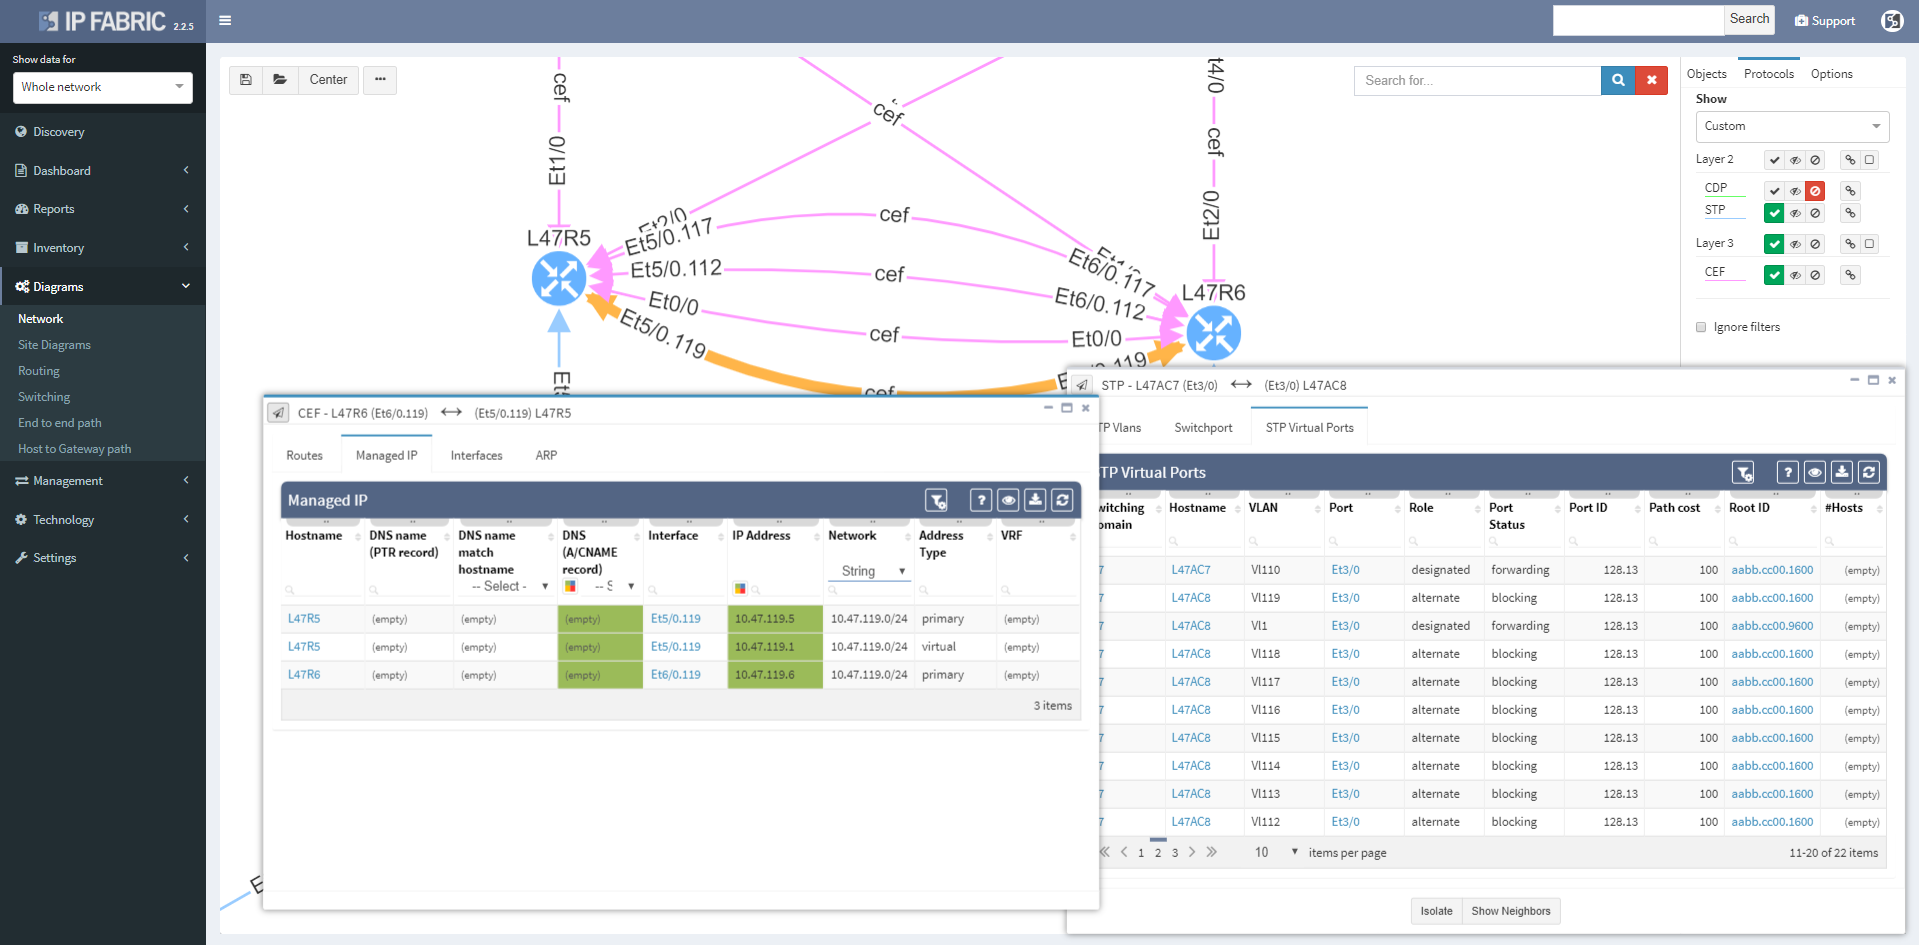
More time can now be spent in network diagrams and going through the detail without leaving the diagrams by managing tooltip windows. These can be resized, moved, or minimized as needed, and can be referred to later by clicking on the window icon in the bottom right corner of the browser window.

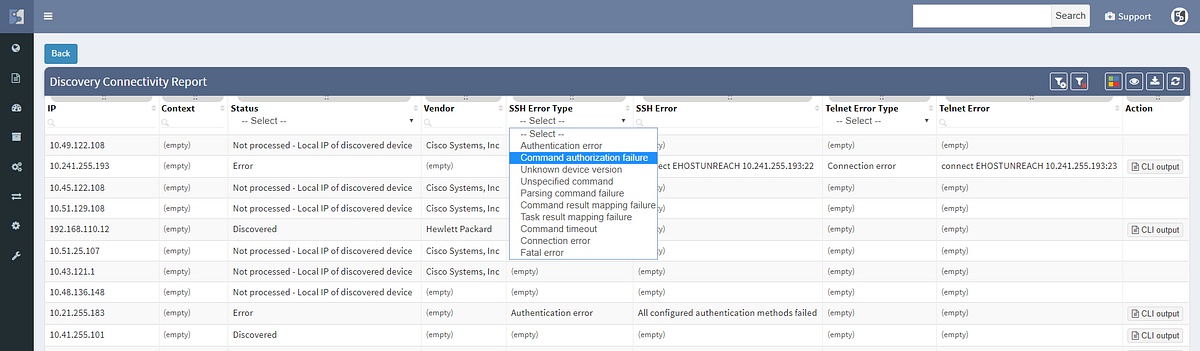
We haven’t focused exclusively on the diagrams, and the Discovery interface has been improved to include information about encountered errors during parsing of device output, grouping issues by error types and enabling to click through to specific output that caused a problem for IP Fabric. This enables to quickly spot issues such as missing authorization for a specific command, or inappropriate timeouts for very long command outputs.
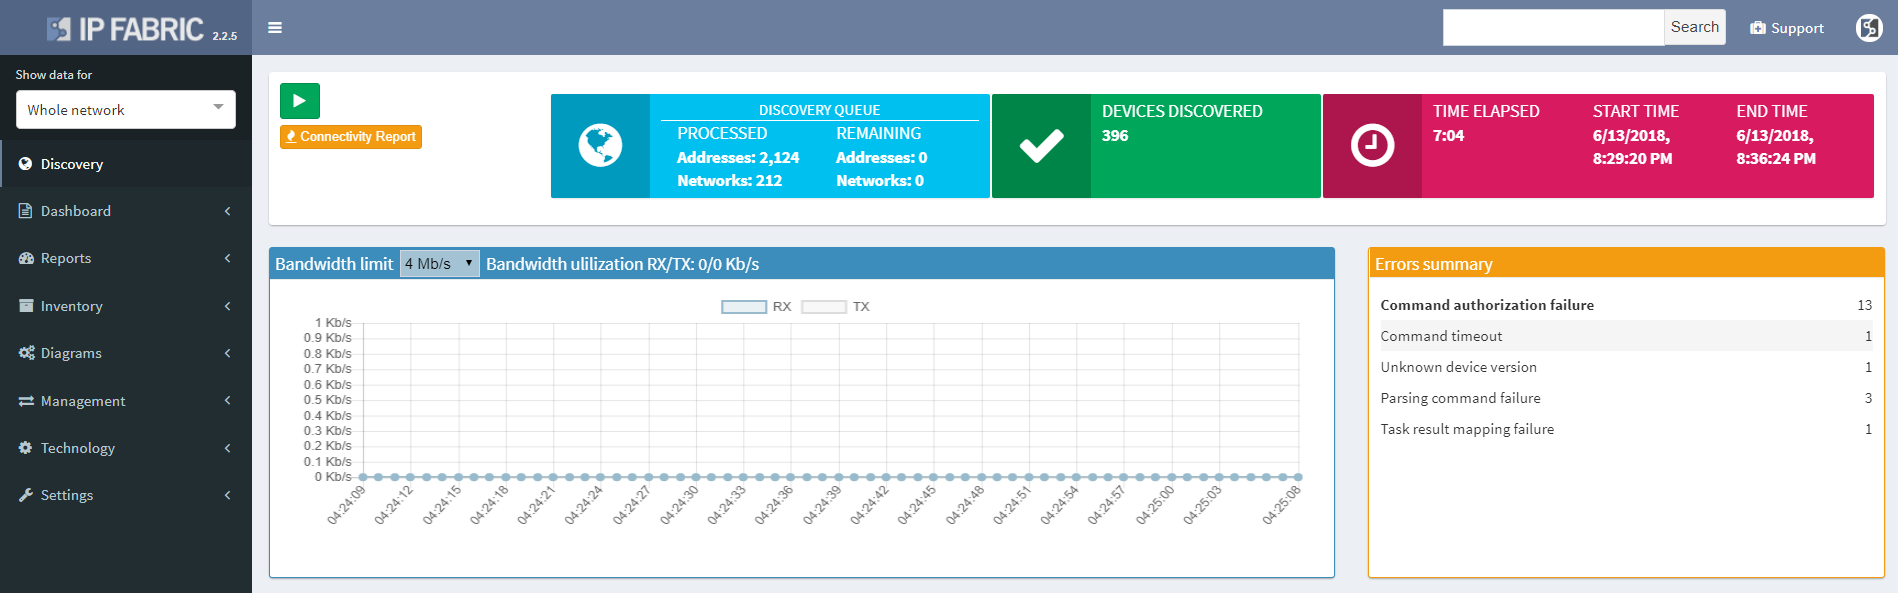
The discovery connectivity report itself has also been improved to include not only successful and failed attempts, but also skipped attempts when an IP in queue was found to be belonging to one of the discovered devices, or halted attempts when device being discovered was found to be discovered in parallel by another process (simultaneous duplicate discovery). A complete CLI output log is also available for each attempt.
If you’re interested in learning more about how IP Fabric’s platform can help you with analytics or intended network behavior reporting, contact us through our website, request a demo, follow this blog or sign up for our webinars.


